Lamborger Alerts**📈 MARA Long @ $19.8**
Stop: $17.91 | Target: $24.61 | R:R: 2.55
The technical indicators suggest a positive momentum with RSI at 63.15 indicating a bullish trend without being overbought. The MACD is positive, supporting upward momentum. The ADX at 27.
**Key Factors:** Positive RSI and MACD, Strong ADX, Positive news sentiment
**News:** Positive
_Signal: 0.78 | 2025-10-09 15:09_
Trade ideas

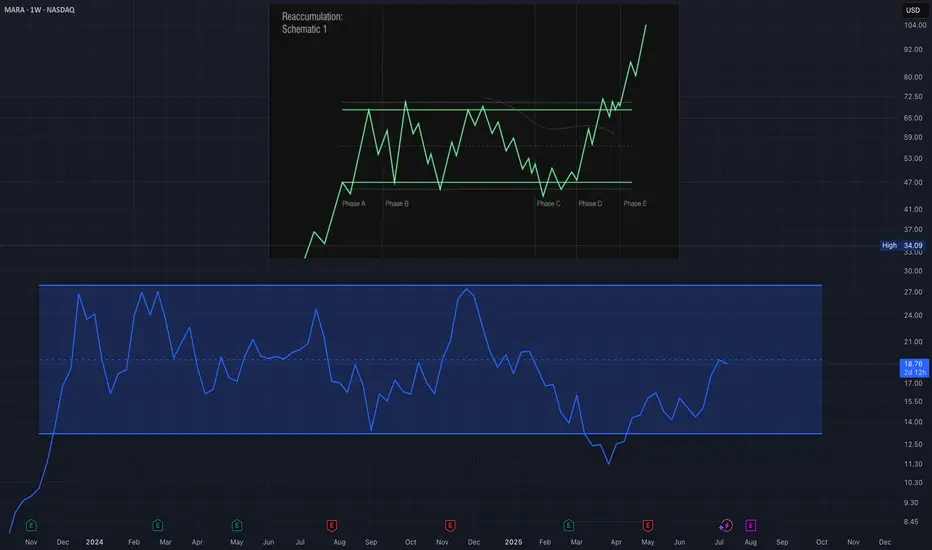
MARA Showing Classic Wyckoff Reaccumulation SetupI’m currently observing what appears to be a Wyckoff Reaccumulation Schematic developing in MARA (Marathon Digital Holdings). After a significant decline, the price seems to have found a floor with a clear Selling Climax (SC), followed by an Automatic Rally (AR) that established the upper boundary of the trading range. The price action since then has remained largely within this range, showing multiple Secondary Tests (ST) that confirm both support and resistance levels. The structure and volume behavior suggest that MARA is likely in Phase C of the Wyckoff reaccumulation process, where we typically anticipate a spring or shakeout to test supply before the next leg higher. If the schematic continues to unfold according to the Wyckoff method, we could see signs of Phase D soon, which would involve a successful test of the spring and a rally back toward resistance with increasing demand. This would set the stage for a potential breakout, marking the beginning of Phase E. I’m closely watching price behavior near the lower range, along with volume confirmation, to validate this scenario. While the structure is still developing, the current formation is consistent with historical reaccumulation patterns seen prior to bullish continuations.
MARA: shoulders done, now walk toward the targetOn the daily chart, MARA completed a textbook inverse Head & Shoulders reversal with a clear breakout above the descending trendline. A corrective pullback followed, and the price is now heading into the key buy zone at 15.21–15.77 - aligning with the 0.72 and 0.79 Fibonacci retracements, and the upper boundary of the broken channel. This is the area to watch for a potential continuation of the bullish impulse.
Volume on the breakout was above average, confirming strong buyer interest. The EMAs are trending below the price, supporting the upward structure. The first target is located at 21.57 (previous resistance), with a potential extension to 28.77 (Fibonacci 1.618).
Fundamentally, MARA remains highly correlated with BTC and crypto sentiment. As interest returns to crypto-related assets due to ETF flows and possible Fed easing, mining stocks like MARA gain attention. Recent reports also show improved production efficiency and lowered costs - a tailwind for bulls.
Tactically, the best setup would be a confirmed reaction from the buy zone — whether a strong candlestick formation, volume surge, or reclaim of a key level. If that happens, aiming for 21.57 and 28.77 becomes a solid plan.
The pattern played out - now it's time for the market to walk the talk.

MARA the bitcoin minerIf MARA breaks $25 and holds it on volume — that’s we have lift off.
It will signals renewed strength in Bitcoin miners, and MARA tends to lead that charge when the crypto market runs hot.

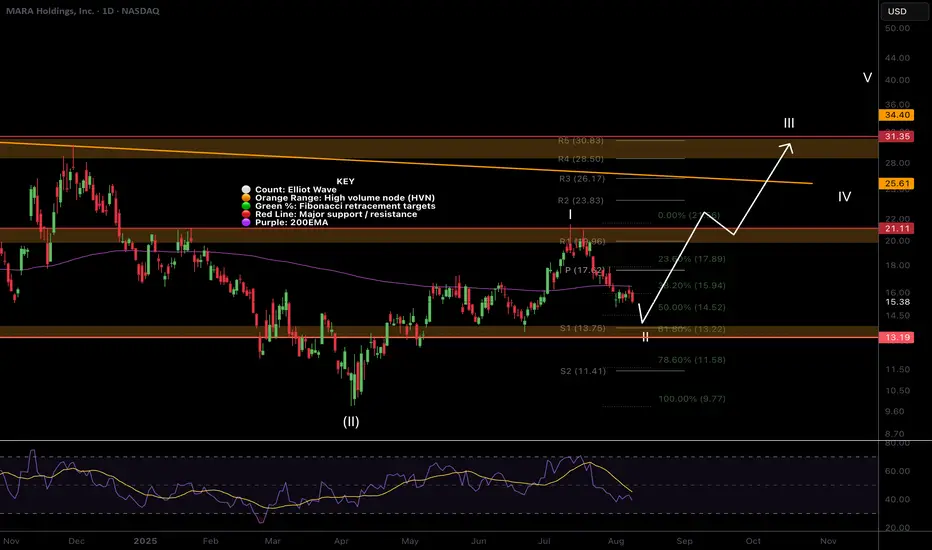
MARA Ready To Finally Move towards $30?MARA’s Elliot Wave (II) retracement front run the Fibonacci golden ratio and has now overcome the weekly 200EMA. The weekly pivot looms as strong resistance $21 just above the first target of our recent trade signal. If wave (III) is underway we should see price begin to accelerate alongside Bitcoin with an initial target of $31 followed by $80 High Volume Node.
Expect price to consolidate at the wave (I) resistance $30 for a while. Weekly RSI is crossed bullishly at the range EQ giving it room to move bullishly!
Safe trading
MARA | My Life Long Girlfriend Stock | LONGMARA Holdings, Inc. is a digital asset technology company, which engages in mining cryptocurrencies with a focus on the Bitcoin ecosystem. It also deals with owning and operating bitcoin mining facilities or data centers, selling proprietary software or technology to third parties operating in the Bitcoin ecosystem, offering advisory and consulting services to support Bitcoin mining ventures in domestic and international jurisdictions, and generating electricity from renewable energy resources or methane gas capture to power Bitcoin mining projects. The company was founded on February 23, 2010 and is headquartered in Hallandale Beach, FL.

Next wave might be shaping up I am bullish above $14.53. I would like to see price close over the daily 20 ema, but sometimes that happens via bigger move without me. So smaller size, loose stop.
My target is $21.50 to $23 range, price action depending.
So it's a support trade, in a wave to wave setup.
Good luck, btw I am no expert so . . .

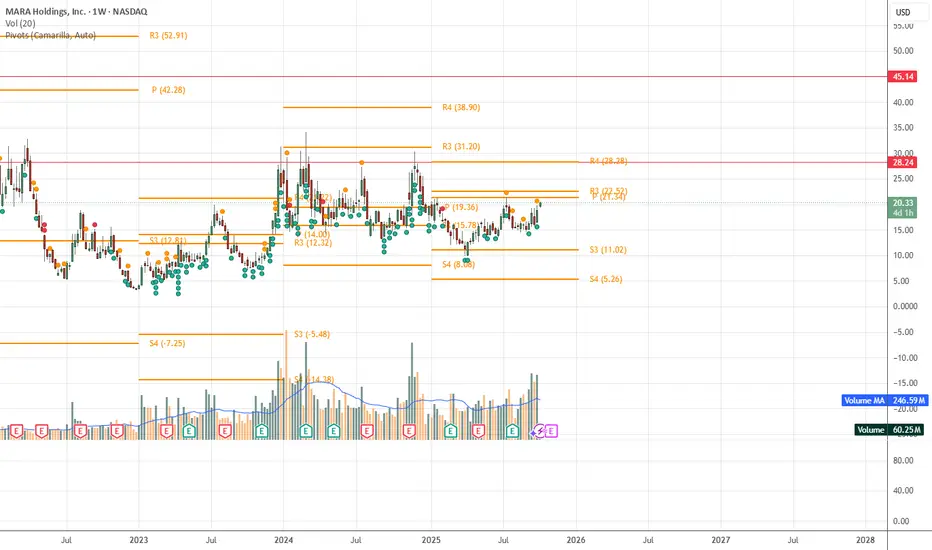
MARA StockAnalysisAs of the latest data, Marathon Digital Holdings, Inc. (NASDAQ: MARA) is trading at $20.42.
StockAnalysis
Based on pivot point calculations, here are the key support and resistance levels for MARA:
Mara Holding Stock Long InvestmentMARA Holdings Inc. (NASDAQ: MARA) is a leading digital asset technology company specializing in cryptocurrency mining, particularly Bitcoin. Headquartered in Fort Lauderdale, Florida, the company operates large-scale mining facilities in the United States and Europe. As of August 2025, MARA is the second-largest corporate holder of Bitcoin globally, with over 50,000 BTC on its balance sheet.

$MARA — Early Reversal in MotionMARA dropped into the 0.618–0.786 Fib retrace zone and bounced right near the 200 EMA. Since then, price has reclaimed above the short EMAs (8/21) and pushed back into the Fib retracement levels.
✅ Entry trigger: Close above 200 EMA confirmed the reversal
🎯 Targets: Fib 1.0 reclaim, then 1.272 and 1.618 extensions
⛔ Stop: Just below the swing low (0 Fib)
This setup follows my playbook: early reversal long @ 200 EMA + Fib confluence. Watching for continuation toward Fib extensions.

MARA EOYMara, mara, mara... *sigh*
Back in Q4 of 2024 I began positioning myself in MARA and set a target of 6-12 months at around 80$. This has not gone as hoped and I am readjusting my target to around 30$ by EOY (worst case scenario). MARA had and even still has a lot going for it as it is still the 2nd company with the largest BTC holdings.
Ultimately if you believe in the long-term growth of BTC you must believe in the long-term potential of MARA. But as far as this cycle is concerned the miners have struggled heavily in comparison to how they performed last cycle, and realistic expectations must be set.
I don't believe the top is in for BTC and think Q4 will be explosive for the crypto space all around. Theres one final leg to go and MARA may just turn it around fast as the miners have exploded well over 300% in Q4 previously. I plan to offload the majority of my position by EOY as the historic cycle closes out and will take advantage of long-term capital gains tax.
Q4 should be exciting, Best of Luck.

I will be very happy to reach with this stock 30$ NASDAQ:MARA
Why I am bullish on this stock ? Because I bullish on Bitcoin in mid-term, so if we take level 20$ I will be seeking to 30$ there is big resistance and will be my future cashout. This stock show some potential to do it and I am believing. I am trading this stock a two years and its not financial advise or recomendation its just my opinion. This stock are very volatile , so don't make emotions make discipline and make your goals what you said to do with this stock when you entry position, have a plan A , b...
Thank you for your time :)

MARA Huge bullish engulfing!NASDAQ:MARA had a huge bullish engulfing candle yesterdays almost eclipsing 9 days of price action in 1 session, a characteristic candle for wave 3!
Partial take profit target for me is the High Volume Node between the R4 and R5 pivot, $20, where I expect price to struggle before more upside. Next target is $28 at the descending macro resistance trend-line.
RSI didn't hit overbought and was rejected back to EQ resetting for higher.
Safe trading

#MARA NASDAQ:MARA
MARA is poised to go higher potentially towards $50 as the first target and onto 150+ in the next few years if bitcoin continues to break higher highs. Its only a matter of time before the miners start to catch up as the revenues would grow significantly and with green energy initiatives these companies can really go above and beyond in the future.

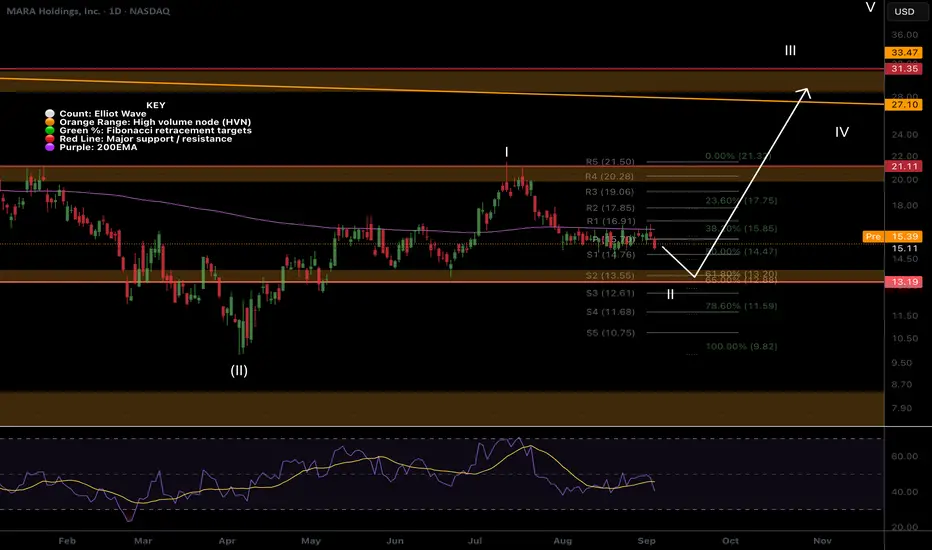
MARA Wave III Underway!Local Analysis / Targets / Elliot Wave
MARA appears to have begun wave III with a rally out of the range and above the daily 200EMA. Wave III has a price target of the High Volume Node resistance at $31 but with the current tailwindsI I expect to overextend.
RSI is overbought and there is looming resistance from the wave 1 high just ahead. Traders should be cautious of this resistance and expect a range below for a while.
Standard Deviation Band Analysis
Standard deviation bands shows price coming into the fair value regression line as resistance. A breakout above this will bring up the SD+2 threshold target of $55. Bands offered a great buy opportunity when price dipped into the green opportunity zone at $3.
Safe trading

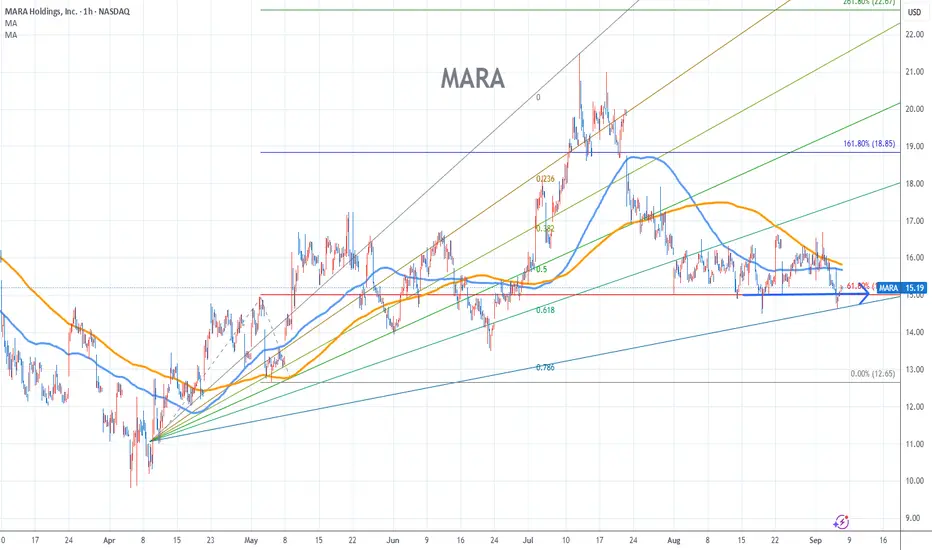
Marathon Stock Chart Fibonacci Analysis 090625Trading Idea
1) Find a FIBO slingshot
2) Check FIBO 61.80% level
3) Entry Point > 15/61.80%
Chart time frame:C
A) 15 min(1W-3M)
B) 1 hr(3M-6M)
C) 4 hr(6M-1year)
D) 1 day(1-3years)
Stock progress:A
A) Keep rising over 61.80% resistance
B) 61.80% resistance
C) 61.80% support
D) Hit the bottom
E) Hit the top
Stocks rise as they rise from support and fall from resistance. Our goal is to find a low support point and enter. It can be referred to as buying at the pullback point. The pullback point can be found with a Fibonacci extension of 61.80%. This is a step to find an entry-level position. 1) Find a triangle (Fibonacci Speed Fan Line) that connects the high (resistance) and low (support) points of the stock in progress, where it is continuously expressed as a Slingshot, 2) and create a Fibonacci extension level for the first rising wave from the start point of the slingshot pattern.
When the current price goes over the 61.80% level, that can be a good entry point, especially if the SMA 100 and 200 curves are gathered together at 61.80%, it is a very good entry point.
As a great help, TradingView provides these Fibonacci speed fan lines and extension levels with ease. So if you use the Fibonacci fan line, the extension level, and the SMA 100/200 curve well, you can find an entry point for the stock market. At least you have to enter at this low point to avoid trading failure, and if you are skilled at entering this low point, with the fibonacci6180 technique, your reading skill of to chart will be greatly improved.
If you want to do day trading, please set the time frame to 5 minutes or 15 minutes, and you will see many of the low points of rising stocks.
If you prefer long-term range trading, you can set the time frame to 1 hr or 1 day
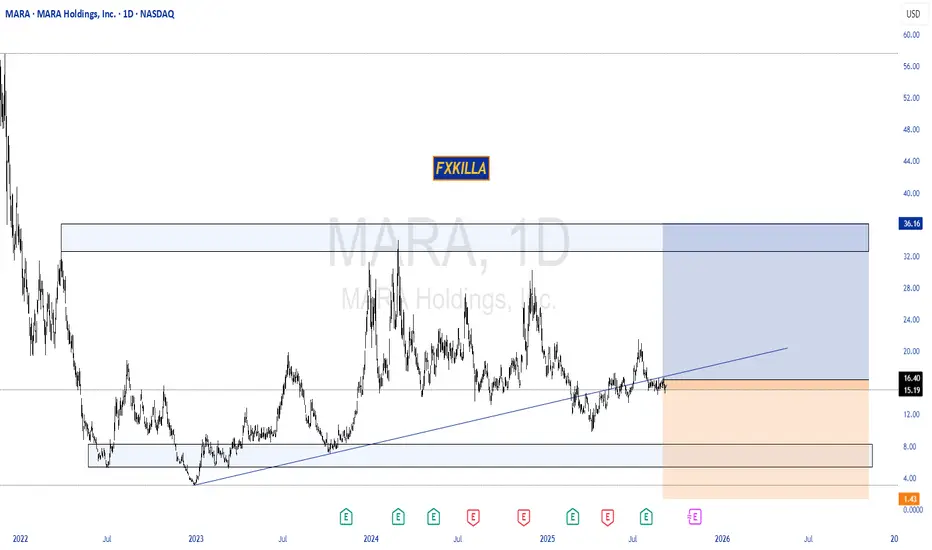
MARA HIGH PROBABILITY SETUP SOON!!!🚨 MARA HIGH PROBABILITY BUY SETUP 🚨
* Here We Can See Clearly The Next Potential Move For MARA Coming Hours/Days.
* Keep Your Eyes Close On Your Trading Positions.
* Happy PIP Hunting Traders.
FXKILLA.
$MARA One More Push Lower to the Golden Pocket?NASDAQ:MARA was rejected hard on the 6th test of the daily 200EMA! The probability of a breakthrough is huge but it just cant overcome supply as people want out of this underperforming Bitcoin Miner! Just the recipe we need for explosive upside, capitulation.
The S2 pivot and Fibonacci golden pocket should see strong support and potential bottoming of wave II, $13.20
Daily RSI is working its way into oversold which will line up nicely for a high probability trade set up I will share in my trading signals substack.
Safe trading
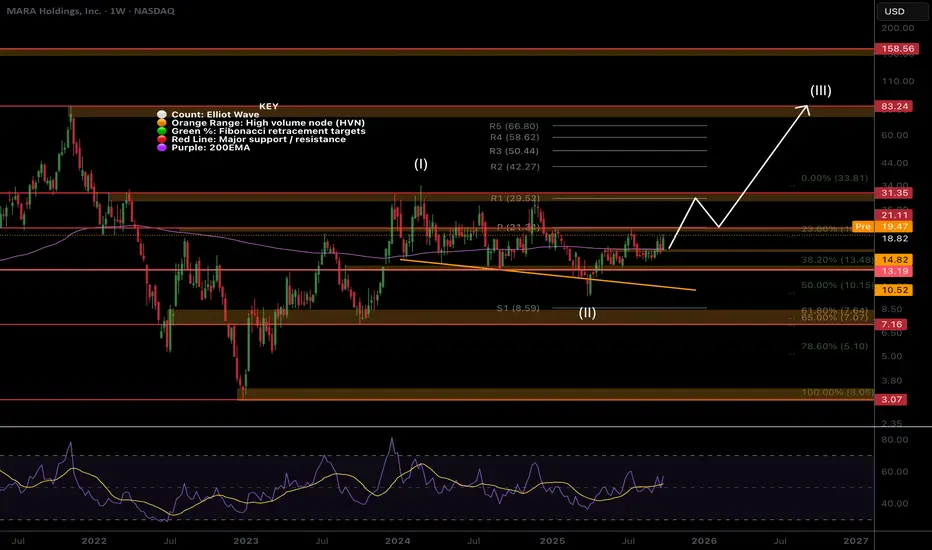
MARA Holding Tight!NASDAQ:MARA continues to lag behind the small cap Miners. It is attempting to break through the weekly 200EMA once more after the rejection from the weekly pivot and High Volume Node (HVN) resistance I warned about.
My long term outlook remains up in Elliot wave 3 towards the R% weekly pivot at $66.
The golden pocket and HVN support of the local retracement has yet to be tested as resistance which acts like a magnet for price.
RSI remains at the EQ and price remains just below the channel EQ.
Safe trading

$Mara bullish or ultra bullishIf you believe bitcoin mining is the future among other crypto projects, may be there is something here. Log trendline break could lit fire under this beast or not. We'll see.

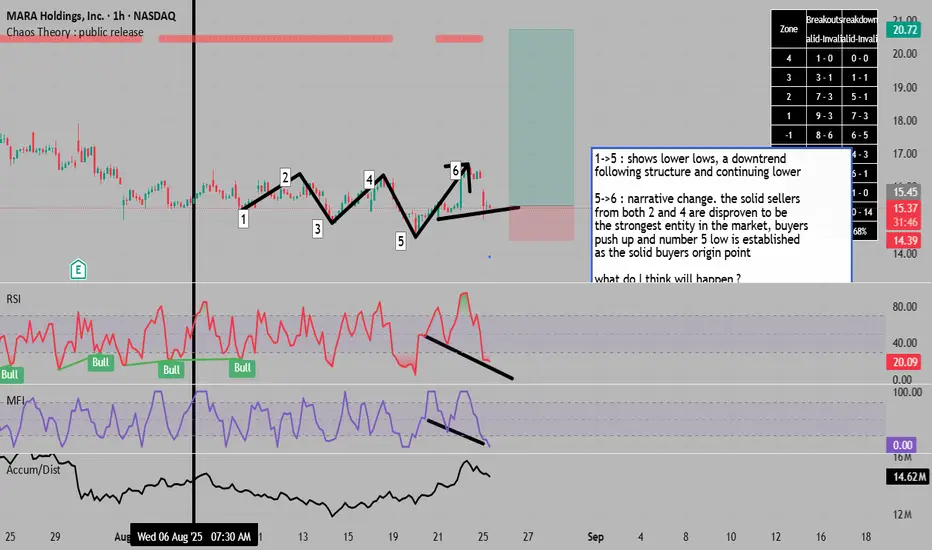
a change in narrative with return to solid =BUYers ## MARA Technical Analysis & Market Outlook
### **Elliott Wave Structure (1→5)**
The decline from wave 1 to 5 traced a clear five-wave impulsive move lower, establishing a downtrend with progressively lower lows. This bearish sequence bottomed around $10, marking the completion of the corrective phase.
### **Market Structure Shift (5→6)**
Wave 5 marked a critical inflection point. The subsequent rally to wave 6 (~$21) invalidated the bearish control established at waves 2 and 4, confirming that selling pressure had been exhausted. This pivot established the $10-14 zone as the **"smart money" accumulation area** - a level now being retested.
### **Current Setup at $15.47**
We've returned to this proven demand zone with multiple confluence factors:
**Technical Indicators:**
- **Inside candle formation** after aggressive selling - classic equilibrium pattern suggesting seller exhaustion
- **Bullish divergence** on RSI (currently 36.76) and MFI - price making lower lows while momentum indicators show higher lows
- **Oversold conditions** across multiple timeframes with RSI in the 30s
- Testing the **critical $14-15 support zone** that sparked the previous 100%+ rally
**Market Context:**
- Analysts maintain **$22.95 average price target** (47% upside) with targets ranging to $39
- 8 Buy ratings vs 0 Sell ratings from Wall Street analysts
- Bitcoin correlation remains strong, with BTC targeting $140,000 by year-end per Elliott Wave analysis
- Institutional accumulation continuing via ETFs despite recent price weakness
### **Trade Thesis**
The convergence of oversold technicals, bullish divergence, and a retest of proven support creates an asymmetric risk/reward opportunity. The inside candle represents the market catching its breath before the next directional move. Given that:
1. Previous buyers defended this zone aggressively (wave 5→6 move)
2. Momentum indicators are flashing oversold with positive divergence
3. Analyst consensus sees 40-50% upside to fair value
4. Bitcoin's broader trend remains intact with $140k targets
**The probability favors a bounce from current levels back toward $20-23 initial targets, with $14 as a clear stop-loss level.**
### **Risk Management**
- **Entry Zone**: $15-16
- **Stop Loss**: Below $14 (wave 5 low)
- **Initial Target**: $20-23 (analyst consensus range)
- **Secondary Target**: $25+ (if Bitcoin reaches $140k projections)
- **Risk/Reward**: ~1:3 minimum
The market has shown its hand - buyers step in aggressively at these levels. Until proven otherwise, this zone should act as a springboard for the next leg higher.
MARA - Currently Favorite Short-Term PickI believe MARA is primed for a sharp 50–80% upside move in the short term.

$MARA Setting Up for A Huge Move?This stocks price action has been subdued far too long after they sold shares to investors but should be moving more aggressively alongside Bitcoin, being the second largest holder of BTC in its treasury.
Price appears to have completed an awkward wave 1 potentially a leading diagonal with wave 2 now underway while price is under the daily and weekly 200EMA. Wave 2 target is a little bit lower in the Fibonacci retracement golden pocket and major High Volume Node support $13.19.
Daily RSI has made its way lower currently showing bullish divergence. If the count is right wave 3 should be hard and fast!
Bitcoin stocks have all had a decent retracement causing me to upgrade my Elliot Wave count to a completed macro wave 1 with wave 2 now underway, suggesting the best returns are still to come over the next months for this category asset class in wave 3!
Analysis is invalidated if we go to new highs above $21.5 or lose $9.85
New long signals are certainly building in the DEMA PBR and Price Action strategies so keep an eye out on the Trade Signals Substack as we have made very food profits lately in these markets!
Safe trading