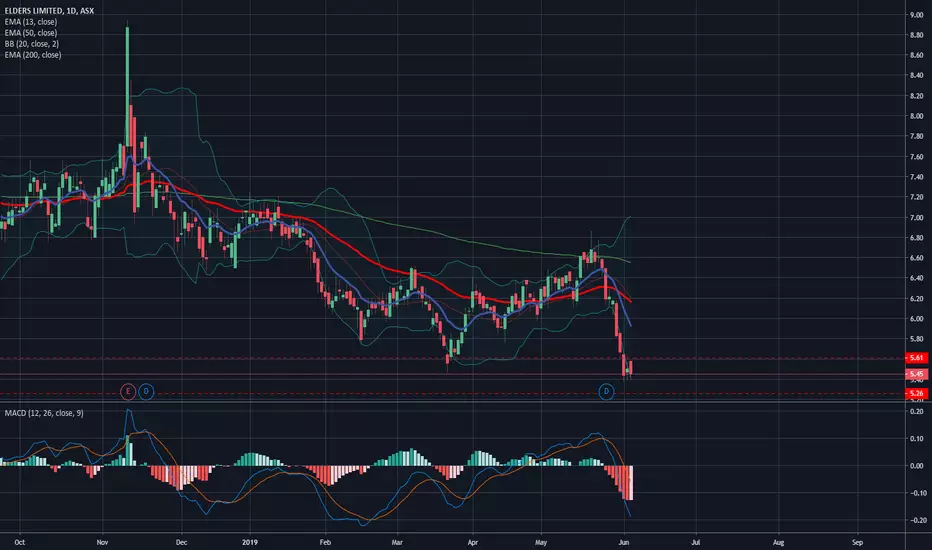
ELD.ASX - Elders confirms breakout?Downtrend stucture as been broken
- Price has been in a decending trendline (lower highs)
- That trendline has now cleanly broken to the upside, not just wicked through
- Importantly, price has closed above the trendline, which is what turns a break into a confirmation
Elders Ltd
No trades
0.88 USD
32.38 M USD
2.06 B USD
About Elders Limited
Sector
Industry
CEO
Mark Charles Allison
Website
Headquarters
Adelaide
Founded
1955
IPO date
Jun 30, 1981
Identifiers
3
ISIN US28450T3005
Elders Ltd. is engaged in providing financial, real estate services to rural, agricultural and automotive businesses. The firm operates its business through the following segments: Branch Network, Wholesale Products, Feed and Processing Services, and Corporate Services and Other. The Branch Network segment includes the provision of a range of agricultural products and services through a common distribution channel. The Wholesale Products segment comprises of the AIRR business based in Shepparton, Victoria, supported by a network of eight warehouses to supply independent retail stores throughout Australia. The Feed and Processing Services segment focuses on Killara feedlot, a beef cattle feedlot near Tamworth in New South Wales. The Corporate Services and Other segment provides general investment activities not associated with the other business segments and the administrative corporate office activities. The company was founded by Alexander Lang Elder in 1839 and is headquartered in Adelaide, Australia.
Related stocks

Break of consolidationSee chart
Large volumes at the lows
Break of consolidation continue in uptrend possibly

$ELD - Wyckoff Accumulation StructureThis analysis is for my learning purpose only - DYOR.
After year long consolidation in the trading range, Elders broke the trading range and jumped across creek (JAC) and tested back up to creek (BUC) on low volume.
A text book Wyckoff accumulation structure. Lets see how far it runs before it st

ELD.ASX_Range Breakout Trade_LongENTRY: 12.50
SL: 11.77
TP1: 12.86
TP2: 13.22
- ADX>20
- RSI<50,RSI<70
- Daily RS +ve
- Daily FFI +ve
- Daily MACD +ve
- Weekly RS +ve
- Weekly FFI +ve
- Weekly MACD +ve
- Breakout of range today with high volume and also engulfs yesterdays red candle of high volume. Showing possible buyers back in


Breakout with retest and hammerStock broke from a pattern largely resembling a cup and handle, with the breakout resistance indicated by the purple line. Stock has since retraced to the breakout and found support with a good hammer candle on the retest. Seeking a measured target as shown based on the depth of the cup.
Stock has

Go Long on Elders ASX $ELDWe saw a nice breakout for Elders on Friday,
however, the stock price failed to break the moving average.
If we close above it next week it will be a buy signal for me.
MACD, RSI, and DMI are bullish and the stock would more likely to go up from this breakout.
Similarly, the Lucid Sar ( AKA Par

ASX:ELD ( Elders Limited) Getting ready for next moveASX:ELD
As per my observation & Study.
Trading + Investing Idea
Momentum building up ( Higher high - Higher low) on the monthly and weekly charts
PriceAction (Zig-Zag) changed for next leg move.
Good support around $8.83 ( possible entry price)
Company has been relative to ASX200 has n

ELD with highly compressed GMMA bandsELD has significant GMMA band compression on both the long and short sets of bands.
Note that the green shorter bands have been able to pierce the red bands are now retending upwards.
The last two similar situations for ELD circled in white, with compression of long EMAs of the GMMA following gre

Short ELD Due to oversees market the ASX 200 should be opening on a positive note and that could lead to consumer defensive sector on the downside. This is why i'm looking into shorting ELD, on the daily it had 3 down days and took a breath for a couple of days. This could lead to a further down to $5.26 a ke
See all ideas
Summarizing what the indicators are suggesting.
Oscillators
Neutral
SellBuy
Strong sellStrong buy
Strong sellSellNeutralBuyStrong buy
Oscillators
Neutral
SellBuy
Strong sellStrong buy
Strong sellSellNeutralBuyStrong buy
Summary
Neutral
SellBuy
Strong sellStrong buy
Strong sellSellNeutralBuyStrong buy
Summary
Neutral
SellBuy
Strong sellStrong buy
Strong sellSellNeutralBuyStrong buy
Summary
Neutral
SellBuy
Strong sellStrong buy
Strong sellSellNeutralBuyStrong buy
Moving Averages
Neutral
SellBuy
Strong sellStrong buy
Strong sellSellNeutralBuyStrong buy
Moving Averages
Neutral
SellBuy
Strong sellStrong buy
Strong sellSellNeutralBuyStrong buy
Displays a symbol's price movements over previous years to identify recurring trends.