AFDI : Symmetrical triangle + Cup & Handle(AFDI)
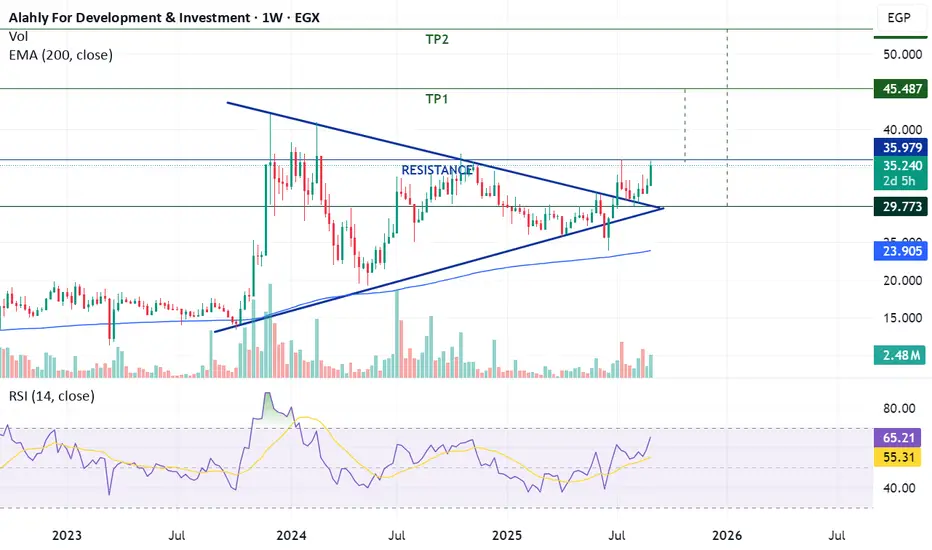
The stock previously formed a symmetrical triangle, which was successfully broken on July 9. On the weekly chart, a clear Cup & Handle pattern has also developed.
If the price breaks above 35.8 and sustains, this would validate the pattern and open the way for the following medium- to long-term targets: 45 – 53.
⚠ The stop-loss level after a confirmed breakout is set at 35.5.
Trade Setup:
-Stock Code: AFDI
-Potential Buy Range: 35.8 – 36.8
-Target Price 1 (TP1): 45
-Target Price 2 (TP2): 53
-Stop-Loss (SL): 35.5 after breakout
AFDI trade ideas

#AFDI Egyptian stock#AFDI time frame 1 DAY
created a bullish Gartley pattern
entry level at 30.60
stop loss 30.00
first target at 32.65
second target 34.20
NOTE: if prices closed under 30.00 (1 DAY frame) may go down to 27.00
MACD indicator show bottom less than last bottom unlike the data on chart , may that is support our idea.
NOTE : this data according to time frame 1 hour
Its not an advice for investing only my vision according to the data on chart
Please consult your account manager before investing
Thanks and good luck

AFDIThe stock is moving in a consolidation trend between 30 and 34 This period is expected to end soon with the Bollinger Bands tightening and volume highs falling R1. 33.95 R2. 38.3 S1. 31 to 30 T1. 41

still in the downtrend still down trending
5 minutes trading in Kumo cloud & very close to Senko Span A
There might be an opportunity for same day trading if AFDI breaks out of the KUMO in 3 consecutive bars 5 minutes.

Afdi Levels and GridHello Dear Traders.
Support 32.15
Next Resistance 36.79 then 41.74
Long Term Target is Between 52.5 - 64.6
On The Chart:
Horizontal Levels : Gann square of 9 Levels! very Important.
Jinny Gann Fan
Jinny Gann Grid
Best Regards

Afdi Complex ChartHello Dear Traders.
Support 32.15
Next Resistance 36.79 then 41.74
Long Term Target is Between 52.5 - 64.6
On The Chart:
Horizontal Levels : Gann square of 9 Levels! very Important.
Jinny Gann Fan
Jinny Gann Grid
Best Regards

NEXT MARKET MOVE UP TO 2023NEXT MARKET MOVE UP TO 2023
At the bold black line, a major area,
At the orange line, a sub area
WE CAN UPDATE AFTER BROKEN


AFDI Downtrend Channel.Levels on the Chart.
Price trying to break above the downtrend Channel.
Worry again if it was a false break, then Going back down towards the Channel.
Will Target 1st the Middle Trendline of the Channel around 16.~
if it was just a retest and then went back up to the mini uptrend channel will have Targets up on chart.
Good Luck!

