MAJOR BEARISH WAVE STRUCTURE CYCLES TOPPINGThe chart posted is the etf SPY ,I am now as bearish and if not more that my work 11/29/12/6 2024 . I am of The view that the bull market that started on march 23 2020 is at the END That low was 2191 and we are now almost equal to the rally from AUGUST 11 1987 to the August 25th 1987 high o
About SPDR S&P 500 ETF Trust
SPY Fund Summary
The investment seeks to provide investment results that, before expenses, generally correspond to the price and yield performance of the S&P 500 Index. The Trust seeks to achieve its investment objective by holding a portfolio of the common stocks that are included in the Index), with the weight of each stock in the Portfolio substantially corresponding to the weight of such stock in the Index.
The investment seeks to provide investment results that, before expenses, generally correspond to the price and yield performance of the S&P 500 Index. The Trust seeks to achieve its investment objective by holding a portfolio of the common stocks that are included in the Index), with the weight of each stock in the Portfolio substantially corresponding to the weight of such stock in the Index.
Related funds

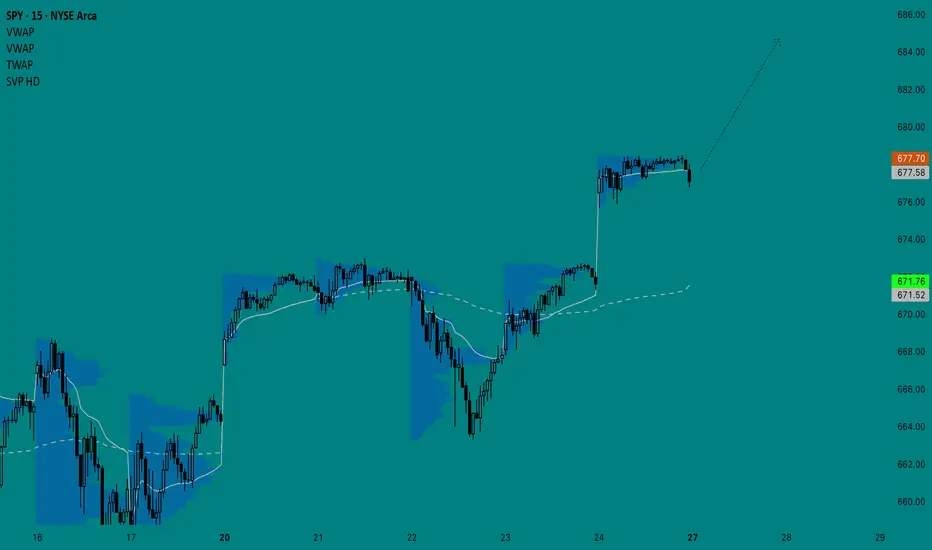
SpySo lets get this straight,
Market has rallied non stop since april lows.
the Fed is cutting rates, Tariff deals are about to be smoothen out, A.I bubble is booming and big tech smashing earnings. All this good news + the addition of Seasonality and market can rally for another 10% right?
Re

SPY: Last week of OctoberRealized, I forgot to do a halloween themed post :O! oh god,
Will have to make it up with a Christmas theme post haha.
My thoughts for next week, last week of October.
Not advice.
Safe trades and enjoy the scant amount of weekend left!
🎃🎃🎃🎃🎃🎃

Earnings Which Way Do We Go Pure TAStaying long took some off
see what earnings bring warning we can drop and continue lower to 460
Weekly stoch tuning up BUT has not broken the red line bottom up through 30%
no VOL

$SPY. Sell 682/683 bear call spreads at open tomorrow.Y'all - I lost my dog 3 days ago. :( But I can still make some sweet calls.

October 27 - October 31 2025Last week of the month and the market is back at ATH - but is this a true breakout or a final shakeout of buyers? I think the market is showing some important clues and will run through my charts again but plan on keeping this brief so I can move on to other things on this beautiful Sunday.
1. M
$SPY Symmetrical Triangle at Resistancewww.tradingview.com
Currently watching AMEX:SPY coil inside a symmetrical triangle after a strong run-up. Price is compressing between higher lows and lower highs. Volume is also tapering off, which is a classic sign of a potential breakout coming soon.
Sentiment for Next Week: Leaning Bullish
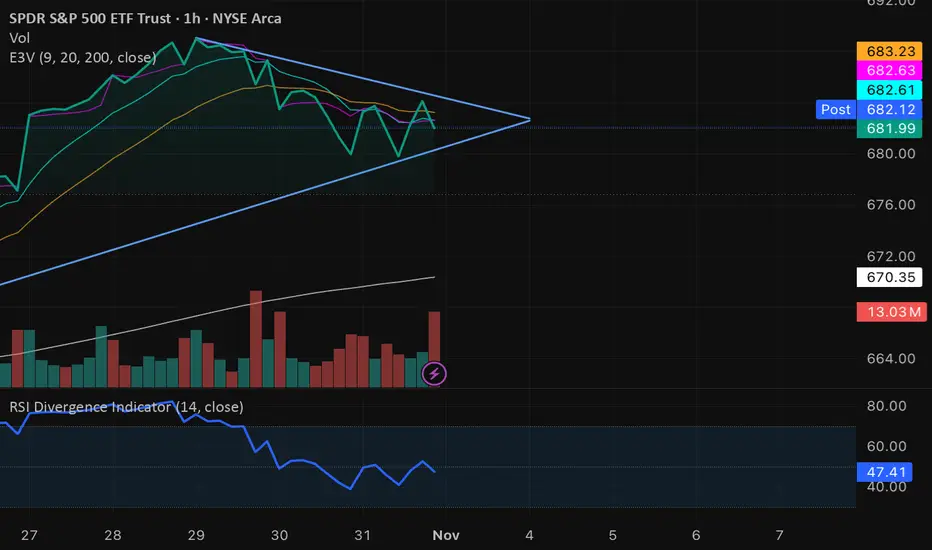
$SPY ends the week with a Shooting Star AMEX:SPY : The week ends with a Shooting Star pattern and a negative RSI 5 divergence.
Levels to watch if the Shooting Star pattern indicates a correction:
1. The last breakout resulted in a new all-time high at 674.
2. The last higher low, which coincides with the 10-week simple moving average,
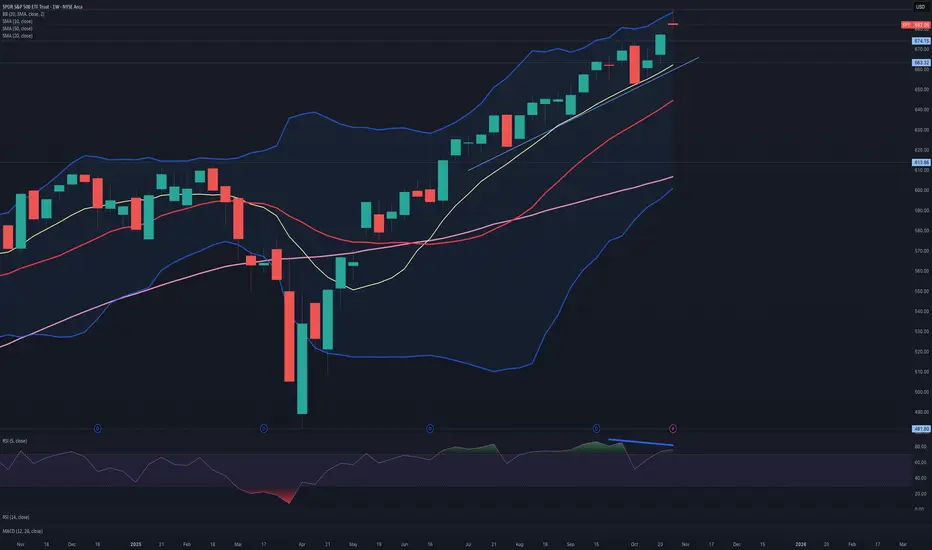
SPY is going to hit ATH around 700 but cautious for ABC wave droSpy is part of wave 5 on weekly time frame
Wave 5 target is 700 around Dec,2025
ABC target is 485 around Sep 2026
Best of luck.

HalloweenSPY may chop around and end bullish for the day but I think it would still be a sell into next week. Gold still bear flagging. Oil - a little pump but dropping quickly. VIX still at support. BTC testing it's 110k resistance and 18 daily ma.

See all ideas
Displays a symbol's price movements over previous years to identify recurring trends.
Frequently Asked Questions
An exchange-traded fund (ETF) is a collection of assets (stocks, bonds, commodities, etc.) that track an underlying index and can be bought on an exchange like individual stocks.
Since ETFs work like an individual stock, they can be bought and sold on exchanges (e.g. NASDAQ, NYSE, EURONEXT). As it happens with stocks, you need to select a brokerage to access trading. Explore our list of available brokers to find the one to help execute your strategies. Don't forget to do your research before getting to trading. Explore ETFs metrics in our ETF screener to find a reliable opportunity.
No, SPY doesn't pay dividends to its holders.