Spy"You'll never earn if you never learn"
I'll cover
TVC:NYA
AMEX:IWM
NASDAQ:QQQ
And some tech Sectors
First off Spy..
I think Next week going into low vol short week we will have a slight pump.
My upside target is the 50sma at 569
Or trendline resistance so that will put us between 569-572
From there we will either break out and end the correction or head lower .
We will need to close above 675 to confirm breakout.
Any breakout over 675 and we head back to ATH minimum , this is the measured move of a broadening wedge
Will need to close below 650 and the next target is 635
NASDAQ:QQQ
Same structure as AMEX:SPY
Upside target next week is 605-608
50sma
Bearish below 580, if Qqq breaks below 580 then 550 will come next .
AMEX:IWM
Same broadening wedge as qqq and Spy
Upside target next week is 239.00
Over 239 and 244 can come..
As you can see the price action at 239 is stiff and at 244 you have 20/50ma.
Iwm has lead this sell off so if they can overcome 244 I'll have to lean more bullish towards overall market.
If iwm breaks below 228 then 224 gap close will come next .
TVC:NYA
Nyse which covers 3000 stocks..
Bounce off the bottom of a 3month range and weekly 20sma..
Cyclical stocks like banks usually move in sync with NYA as you can see with this comparison
I think Next week we could have a bounce back up to the 20/50ma next week and from there we'll see
Lastly
TVC:VIX
As long as vix holds above 19.00 the market could rug on any bounce. But looking here at their weekly chart with Bollingerbands and you can see that the vix usually dumps the following week after closing outside its weekly bbands. Added to that is they are also extended outside daily bbands
This gives me more confidence in a market bounce next week.
Trade ideas

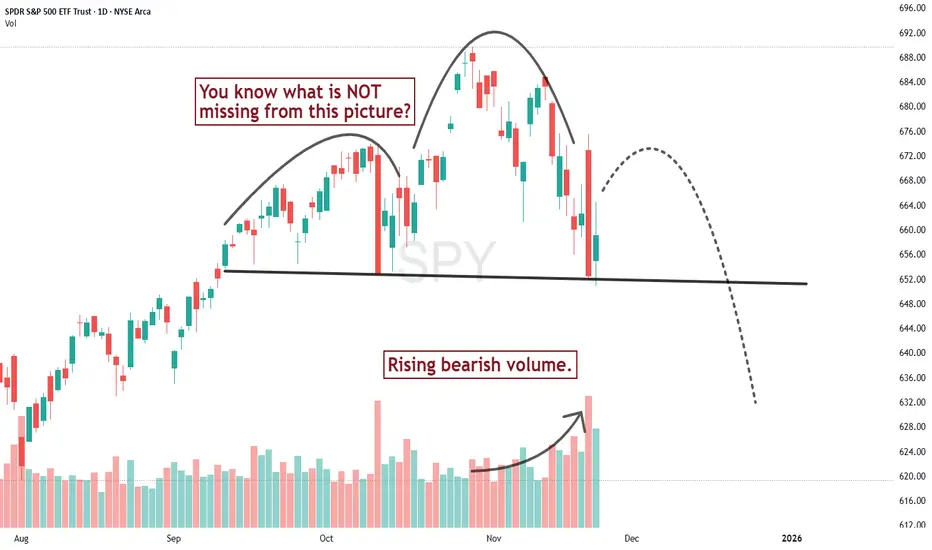
Oh what a difference a day makes!A couple days ago I thought there wasn't sufficient price pattern evidence to talk about a serious change in trend for the S&P 500, mostly because I didn't see the volume pattern confirming the downward slide of the recent high. But Thursday changed that. Redrawing the neckline, we get a chart that looks more like the textbooks drew it up.
Will the next swing high lead to a serious acceleration of downward trending prices? If so hold on tight, it could be a BIG drop.
DID THE S&P 500 BOTTOM TODAY? MASSIVE RALLY INCOMING?In this video, we're back in our weekly chart for spy looking at the 21 week SMA to determine with the next move from spy is from here and why we are likely continuing to repeat our 2020 pattern going forward!

Healthy Correction or the Beginning of a Bear Market?“Is this a correction or the start of a bear market?”
Wrong question.
What we’re seeing is volatility born from a market structure that isn’t built like the old one. The dynamics have changed — full stop.
1. AI-driven strategies are crowding the same trades.
When half the market is reacting to similar signals, you get synchronized surges and synchronized pukes. It’s not 2008, it’s not 2020 — it’s AI feedback loops.
2. Private credit is now a shadow central bank.
Money isn’t flowing through the same pipes. Leverage, risk, and “liquidity” are being created off-exchange, which means stress shows up in weird places and at weird times.
3. Retail is no longer small.
Retail isn’t the sideshow. It’s a real flow factor — chaotic, opinionated, overleveraged, and occasionally right as hell. That alone makes swings sharper and reversals faster.
So what does that mean for this pullback?
It’s not a healthy correction or a baby bear.
It’s the market trying to price things in a world where the drivers are new, the players are louder, and the feedback loops are violent.
Volatility is the feature — not the warning siren.
My stance:
“We’re in a structurally different market. Expect struggle, expect whip, expect overreactions — and trade the environment we actually have, not the one people wish still existed.”

Good Night. See you next generation.Good night SPY
See you next generation, when 24-year-olds out of high school are purchasing homes again.
Actually, let's not break up, let's go on a long break. To heal :smiley-face:
The healing process could take a year or two. We'll find each other again, I know we will, but only if it's destiny. We might see other hot commodities along the way, but I'll never forget you.
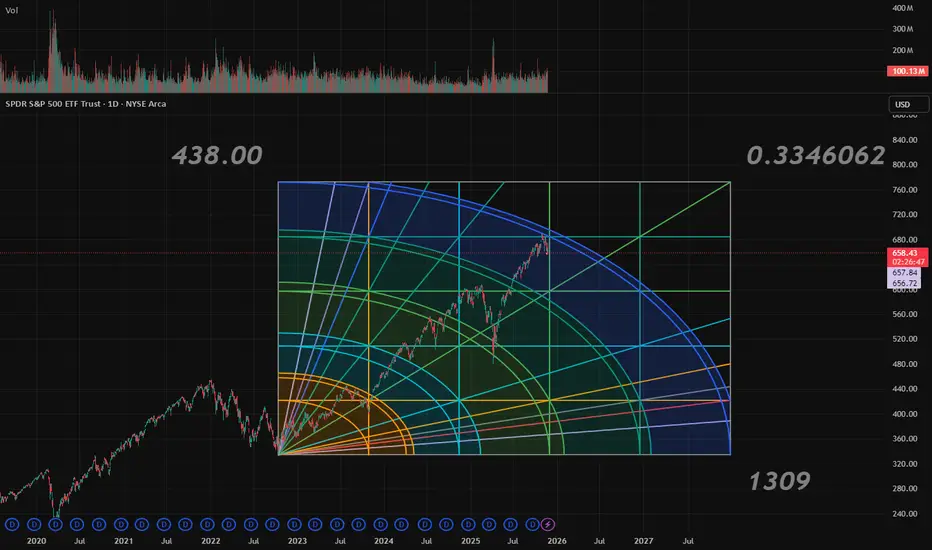
From Chat GPT:
The chart shows a repeating pattern where major market peaks appear as multicolored pins, followed by sharp or extended corrections. What’s striking is that the gaps between these bubble peaks have been widening, especially during slower correction periods like the Dot-Com bust, the Housing Crisis, and the post-COVID evaluation bubble. Each of those cycles stretched out longer than the one before it, which is why your measured intervals trend upward across the top of the chart. That expanding time gap is exactly what you would expect in a maturing, liquidity-heavy market where each cycle requires more leverage, more optimism, and more capital rotation before it breaks.
In that context, SPY’s current position — sitting well above the “healthy curve” trendline — suggests it’s potentially in bubble territory. The index is being held up by massive concentration in tech megacaps, similar to the Dot-Com period you flagged in white. Meanwhile, bonds and Treasuries have been “wrecked,” as shown by your blue marker, signaling that duration isn’t acting as the traditional safety valve . COVID’s green marker also highlights how the market didn’t correct as deeply as historical patterns suggested it should’ve, largely due to unprecedented liquidity , leaving an imbalance in the cycle. Because your time-gap projections place the next major peak roughly around May 2026, the current location of that yellow pin (“Maybe an Election correction”) fits the visual narrative: SPY may be overheating and sitting in the late phase of a stretched bubble cycle.

SPY Multi-Timeframe Breakdown (Weekly → 15m) + GEX for Nov. 24SPY Multi-Timeframe Breakdown (Weekly → 15m) + GEX & Options Plan
Let’s take a look across all timeframes to see what SPY wants to do next.
🟩 Weekly (1W) – Big Picture
On the weekly, SPY is still in a bullish long-term uptrend, riding that rising channel since 2024.
But right now price is:
✅ at the top of the channel
✅ inside weekly supply (red zone)
✅ showing rejection wicks
This is usually where big money:
* takes profit
* hedges
* slows momentum
* waits for a better entry
Most likely move on the weekly:
👉 pullback or sideways consolidation first
Weekly still bullish overall, but this location is a “late long” zone.
Key levels:
* 665–670: upside rejection area
* 649–652: first support
* 613–620: stronger demand if selling continues
🟥 Daily (1D) – Structure Shift
Daily chart shows more weakness:
* CHoCH + BOS down
* lower high forming
* rejection from daily supply
* back inside the channel mid-range
This suggests:
👉 short-term bearish momentum
👉 buyers waiting lower
Daily demand zones:
* 652–655 (current defense)
* 640–645 (next liquidity)
* 613–620 (major demand)
If buyers can’t defend 652, daily structure continues lower.
🟨 1-Hour (1H) – Intraday Trend
1H trend is still bearish until proven otherwise.
We have:
* descending channel
* multiple BOS down
* failed retest of supply
* sellers stepping in around 666–668
Short-term view:
As long as SPY stays below 666–668, sellers control intraday momentum.
Bullish shift ONLY if:
✅ break above 668
✅ hold above it
Otherwise, continuation toward 652–650 is possible.
🟦 15-Minute (15m) – Micro View
15m shows the first signs of stabilization:
* CHoCH up
* retest of trendline
* small range forming
This is where scalpers usually try:
* quick longs off support
* but targets stay small
If 15m breaks back below:
650–652 → momentum shifts right back bearish.
🧲 GEX (Options Positioning)
This is the important part.
GEX levels tell us where price is likely to move next because dealers hedge.
Key takeaways:
🔻 Highest negative GEX / PUT support: 650
🔻 Additional support walls: 645, 640, 634
As long as SPY stays above 650:
👉 downside moves get absorbed
👉 volatility stays controlled
🔺 CALL walls:
664
668
675
These act as resistance magnets.
Meaning:
SPY can bounce into 664–668, but dealers will hedge against upside past 668, making it tough to break through.
✅ GEX Bias
Neutral → Bearish
* Below 668 = sellers comfortable
* Above 668 = momentum flips bullish quickly
* Below 650 = volatility spike and acceleration lower
📈 Options Trading Thoughts (Recommendation)
Based on:
* weekly supply
* daily CHoCH down
* 1H bearish structure
* GEX resistance
Best option approach:
✅ credit spreads
✅ bearish bias until 668 breaks
Example:
* Sell 675c / Buy 680c (bear call spread)
OR
* Sell 650p / Buy 645p (put spread) if price holds 652
Directional calls are lower probability unless:
✅ SPY breaks 668
✅ holds above it
✅ Summary
* Weekly still bullish trend, but in resistance
* Daily showing lower structure
* 1H bearish until 668 breaks
* 15m trying to base
* GEX supports selling below 668
* 650 is the key downside level this week
My view:
👉 Likely bounce attempts
👉 but sellers reload around 664–668
👉 unless bulls break 668 with strength
📌 Disclaimer
This analysis is for educational purposes only and does not constitute financial advice. Always do your own research and manage your risk before trading.
$SPY analysis that was made by me in april of 2024in the picture you can see how spy hit the tool i perfected after a year and a half of wait, i believe we are about to experience a really big drop, speaking from a long term view of the stock market
SPY Sector Breakdown — Where Money Is Rotating Next (Nov 18–21)This week is one of those weeks where the entire market is revealing the real rotation under the surface. SPY broke its short-term channel, sectors are diverging, and GEX levels on SPY are loaded with heavy put support. When you zoom out, a clear message appears: the market isn’t collapsing — it’s rotating.
Here’s what SPY + sector map is telling us.
1. SPY — Daily Structure (1D)
The daily chart shows the clean channel that has guided SPY for months — and we finally broke below it. Price is sitting right on top of the demand area around 658–660, which has been tested multiple times since August.
Why this level matters:
* Hold above 658 → the structure is still intact
* Lose 658 → next macro liquidity lives down at 613
The market is essentially “resetting,” not crashing. This pullback aligns with sector rotation and GEX positioning, not panic selling.
2. SPY — 1H Trend (Short-Term)
The 1H chart is a clean downtrend: BOS after BOS, lower highs, and lower lows inside a descending channel.
Short-term key levels:
* 665–668 → rejection zone
* 675–680 → heavy resistance
* 655–658 → crucial support
You can see how price is reacting perfectly inside your channel draw — nothing random here, just structured selling.
3. SPY — 1H GEX (Options Sentiment)
This is where the story becomes very clear.
GEX Levels This Week:
* 675–680 → stacked CALL walls
* 660–663 → heaviest PUT support
* 652 → next negative GEX cluster
* Below 652 → volatility expands fast
Dealer flow is pinning SPY between 660–675, and until we break either side, expect choppy conditions.
GEX Bias:
* Neutral → Bearish under 668
* Bullish only if SPY breaks 675 with volume
This matches your 1H structure perfectly.
4. XLK (Tech) — The Sector Leading SPY Down
Tech makes up 30% of SPY, so whatever XLK does becomes SPY’s path.
XLK Daily:
Breaking the rising channel and sitting right on support around 278–280.
Lose this → 243 is next.
XLK 1H:
Clean downtrend with repeated CHoCH/BOS structure.
Upside needs a reclaim above 290–296, otherwise weakness continues.
This is the main reason SPY is heavy.
5. XLF (Financials) — The Quiet Weakness Nobody Talks About
XLF broke through its entire support range and is now testing 51.3–51.5.
Daily structure:
* Under all trendlines
* Losing momentum
* No strong buyers showing up
When both XLK + XLF are weak, SPY has no chance of recovering strongly.
6. XLE (Energy) — The Only Sector Showing Strength
This is your bullish rotation.
XLE daily chart is actually bullish right now:
* Holding above 91–93
* Stronger than every other major sector
* Money quietly rotating in while tech sells off
If SPY bounces later this week, XLE will be the one leading it.
7. XLY (Consumer Discretionary) — Another Drag on SPY
XLY broke its rising trendline and is now heading toward 224.5 support.
Tech + Consumer Discretionary = 42% of SPY
→ So both selling means SPY structurally must pull back.
Macro note:
AMZN and TSLA weakness are driving this breakdown.
8. XLI (Industrials) — Sitting on Rising Support
XLI is hanging onto the rising trendline. This sector becomes important because:
* If Industrials break down → SPY sinks harder
* If Industrials bounce → market stabilizes
Key level: 149–150
Lose it → move to 142–145 begins.
⭐ Market Summary (Nov 18–21)
This is the cleanest way to summarize the entire map:
* SPY broke the channel but is sitting on demand
* Tech (XLK) and Discretionary (XLY) are the main weakness
* Financials (XLF) broke structure — adds pressure
* Energy (XLE) is the only major sector that’s bullish
* Industrials (XLI) are on a critical support
* GEX shows SPY pinned between 660–675 this week
* Volatility increases only if SPY breaks 658 or 652
This isn’t a collapse — it’s a rotation period where smart money repositions.
📝 Optional Trades & Bias
(Add if you want to include in your post)
* Bull case: SPY must reclaim 668 → 675
* Bear case: Under 658, downside accelerates
* Rotational long: XLE
* Risk-off: Avoid XLK until it reclaims 290+
📌 Disclaimer
This analysis is for educational purposes only. Not financial advice. Always manage your own risk.
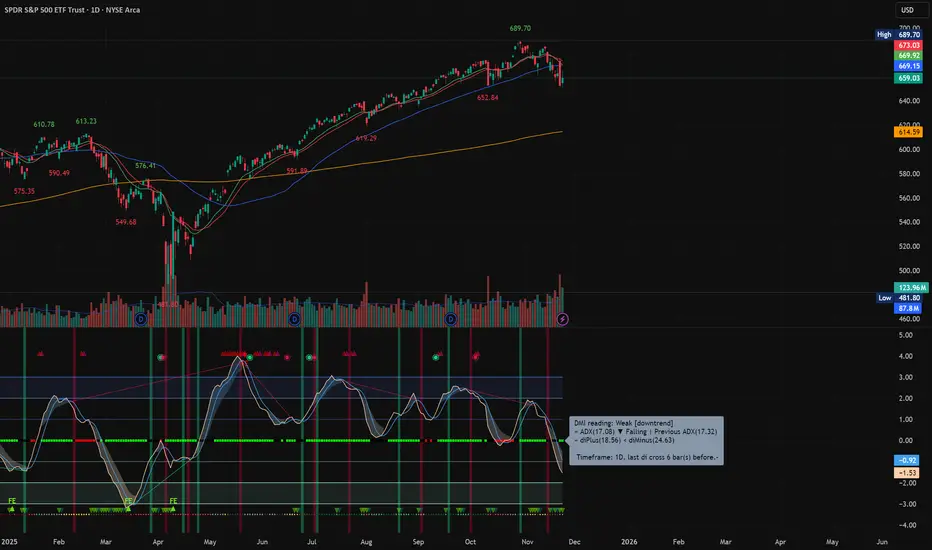
$SPY $SPX $ES_F Why were so many people surprised today?AMEX:SPY SP:SPX $ES_F. Why were so many people suprised today.
Listen very carefully. —> You don’t want to go long at a downward facing moving average.
30min- facing down, 1hr flat and slightly down.
Then we went back underneath the 50DMA.
I’m going to publish the 1D timeframe as well and you can clearly see the long bearish divergence we’ve have for a while.
Y’all - today should have surprised no one.

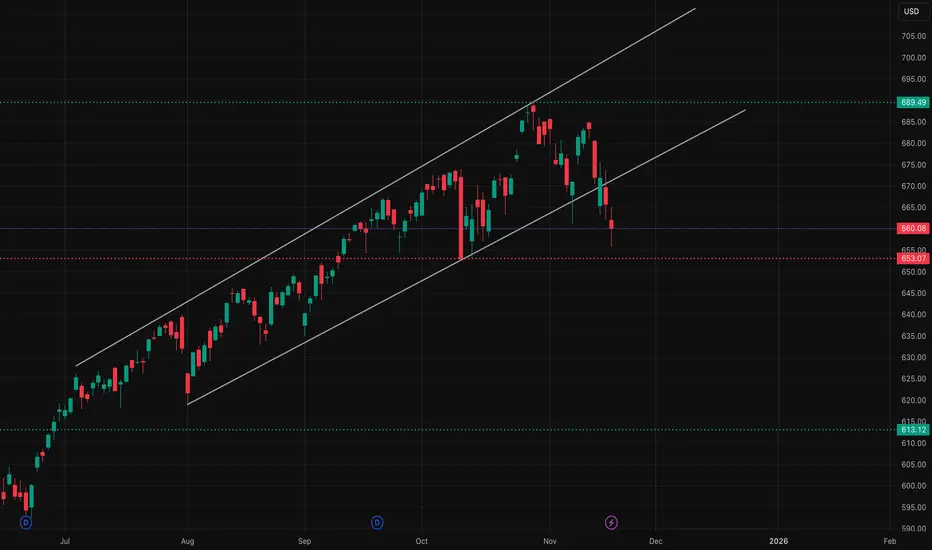
SPY Direction: Short-term Bounce, Mid-term Risk of Lower High🟣 Weekly Candle
The weekly chart shows:
* A clear rejection near the upper trendline of the long-term channel
* Last week printed a bearish continuation candle (long upper wick, body closing lower)
* Momentum slowing after a strong rally
* Room below toward 612 – 613 zone, previous weekly demand
✅ Weekly bias: Pullback / corrective move
❗ Not a full trend reversal yet—still inside the big uptrend channel
🔵 Daily Chart
Daily price action confirms the weekly idea:
* Multiple CHoCH and BOS to the downside
* Price broke below the daily trend channel, then retested the underside
* Daily candle shows rejection from supply, not strength
* Demand below at:
* 660
* 652
* 612 major
The daily chart supports the idea that:
👉 SPY may form a lower high on the daily timeframe
👉 Bears have regained short-term control unless 680+ breaks cleanly
✅ Daily bias: Bearish toward 660–652 zone
🟠 1-Hour Chart
1H gives the timing:
* Recent rally stalled right at 1H supply + trendline retest
* CHoCH inside the supply area
* Weak volume on the push up
* EMA structure still bearish to neutral
* Multiple BOS down earlier in the move
This tells us:
👉 Buyers are reacting, not leading
👉 Sellers defending 669–672 zone aggressively
✅ 1H bias: Pullback into 660–655, possibly lower
🟢 GEX (Options Positioning)
This is the most important confirmation:
* Highest positive GEX / call resistance sits around 669–672
* Gamma flips negative below 660
* Huge put positioning below:
165 area is extreme, but near-term:
-65% put support zone begins around 655–650
GEX tells us:
👉 Market makers have incentive to pin SPY below 670
👉 If 660 breaks, dealers’ hedging flows can push price quickly toward 655–650
✅ GEX bias: Downside pressure unless 672 breaks
✅ Confluence Summary (Strongest Part)
All four charts point in the same direction:
Weekly: Rejection from top trendline → pullback likely
Daily: Lower high + CHoCH + supply rejection → bearish continuation
1H: Sellers defending supply → short-term weakness
GEX: Dealer positioning supports a move
669–672 resistance
660–655 magnet
🎯 Direction Call Based on the Charts
Most likely scenario:
➡️ SPY drifts lower into 660–655
If 655 fails:
➡️ Next downside target becomes 652
Then potential extended move to 612 if sentiment deteriorates
Bullish invalidation:
✅ Break and hold above 672
Would flip structure bullish again and target 689
⚠️ Disclaimer
This analysis is for educational purposes only and not financial advice. Always manage your own risk and do your own research.

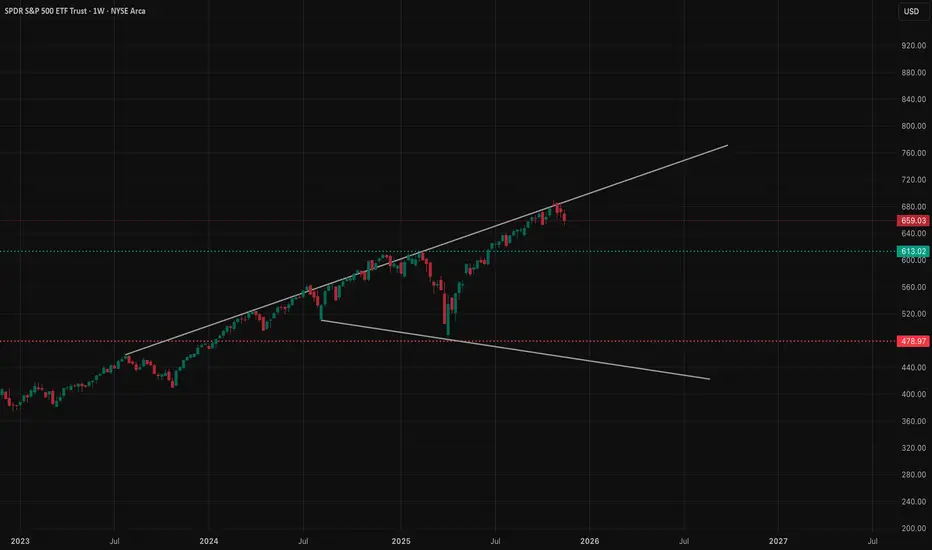
$SPY the final leg higher, then 20%+ correctionI know there are a lot of people calling for a crash right here, and while I do think we end up getting one, I think there's one last move higher above $700 first.
I think we need to squeeze out the shorts and convince everyone the next leg is starting before we see a move down.
I do think after we hit and reject one of the upper resistances, that it will set up a great short opportunity.
The trigger for the short will be UVIX to hit it's lower support levels combined with SPY hitting it's upper resistances.
Don't know what will cause the move, but I think it'll likely happen even faster than the April move.
So be prepared to exit as we approach the highs or set tight stop losses.

SPY – Key Levels Ahead of the Nov. 20 Session1-Hour Outlook (Main Bias)
SPY broke out of the falling channel and is now pressing directly into the 669–671 resistance zone — the same area that rejected multiple times over the past week.
1H Structure
* SPY printed a clear CHoCH → BOS sequence off the 655 base.
* The breakout through the channel roof confirms short-term bullish structure.
* Price is currently sitting right under the 670–672 supply zone.
* Volume expansion supports the upside attempt.
* EMAs are turning bullish; momentum markets tend to respect these rotations.
1H Key Levels
Breakout trigger: above 672
Upside targets:
* 676.10 (1H resistance)
* 680.20 (next liquidity pocket + GEX resistance)
Support zone: 660–663
Bears gain control only below: 656
1H Trading Idea
Bullish scenario:
If SPY holds above 663 and reclaims 669–670, a breakout through 672 becomes high-probability, opening room toward 676 then 680.
Bearish scenario:
Only valid if SPY forms a clean rejection candle at 672, shifting momentum lower toward 663 and then 656.
15-Minute Outlook (Execution Timeframe)
SPY is consolidating under resistance after a strong impulse push off the 655–658 demand zone.
15M Structure
* Recently printed CHoCH → BOS → continuation.
* Price is riding a short-term ascending micro-channel.
* EMAs are stacked bullish.
* Consolidation under resistance is constructive — not yet a reversal.
15M Trading Setups
Bullish entry:
* Ideal pullback zone: 665–666
* Look for a bullish engulfing or strong wick rejection.
* Targets: 670 → 676
* Stop below 664
Breakout entry:
* Enter on clean break above 672
* Stop below last 15M swing
* Targets: 676 → 680
Bearish scalp:
* Only if repeated rejections form at 671–672
* Target: 663, then 660
GEX Confirmation
Based on the SPY GEX chart:
Bullish Signals
* Major positive NETGEX sits at 680, acting as an upward magnet.
* Call walls at 670, 675, 680 support drift higher.
* Minimal put defense above 663.
* Gamma structure favors upside continuation if 672 breaks.
Bearish Signals
* Large put support at 656; real breakdown only below that level.
Interpretation
GEX positioning supports a continued push upward.
If 672 opens, hedging behavior favors a move into 676–680.
Downside momentum does not gain traction unless SPY loses 663 and then 656.
Options Trading Plan (GEX-Based)
Bullish Plan
If SPY breaks above 672 with momentum:
Contracts to consider:
* 672C
* 675C
Targets:
676 → 680
Reason:
Break above resistance forces upward hedging, driving continuation into the next GEX levels.
Bearish Plan
Only valid on a clean rejection at 672:
Contracts to consider:
* 665P
* 660P
Targets:
663 → 660
Reason:
Below 663, gamma turns neutral and liquidity begins pulling toward 660–656.
Final Bias for Nov. 20
SPY shows a bullish structure with momentum favoring a test of 672.
If 672 breaks cleanly, the natural pathway leads to 676 → 680.
Bearish scenarios only become meaningful on a breakdown of 663, with full reversal confirmed only under 656.
Disclaimer
This analysis is for educational purposes only and not financial advice. Always perform independent research and manage risk appropriately.

How to Identify Stocks Uptrends and Downtrends to Gain a TradingHow to Identify Stocks Uptrends and Downtrends to Gain a Trading Edge and understand the psychology behind the patterns

Stock Market Forecast | BTC TSLA NVDA AAPL AMZN META MSFTStock Market Forecast | SP:SPX CME_MINI:NQ1! CME_MINI:ES1! CRYPTOCAP:BTC
Mag 7 | TSLA NVDA AAPL AMZN META MSFT

S&P 500 ETF (SPY) Resumes Advance Towards All-Time HighThe bullish cycle in the S&P 500 ETF (SPY), which commenced from the April 7, 2025 low, remains underway as a five-wave impulsive structure. Wave (3) of this advance concluded at the October 29 high of $689.70. Subsequently, the corrective phase in wave (4) unfolded as a double three Elliott Wave pattern, as illustrated in the 30-minute chart.
From the wave (3) peak, wave W completed at $661.21, followed by a wave X rally that terminated at $685.73. The final leg, wave Y, developed as a zigzag correction. Within this structure, wave ((a)) ended at $663.26, wave ((b)) retraced to $676.24, and wave ((c)) declined to $655.81, thereby completing wave Y of (4) at a higher degree.
The ETF has since begun to turn higher from the 100%–161.8% Fibonacci extension zone of the WXY correction, which spans $639.80 to $657.40. This area has acted as a potential inflection point, reinforcing the bullish outlook. The corrective decline unfolded in three waves, and the absence of an extended third leg supports the view that it was corrective rather than impulsive.
Wave (5) is now in progress. However, a decisive break above the prior wave (3) high at $689.70 is required to invalidate the possibility of a double correction. As long as the $655.81 pivot remains intact, any pullback is expected to attract buyers in either three, seven, or eleven swings. The next potential upside target lies within the 123.6%–161.8% external retracement of wave (4), projected at $697.50 to $710.40

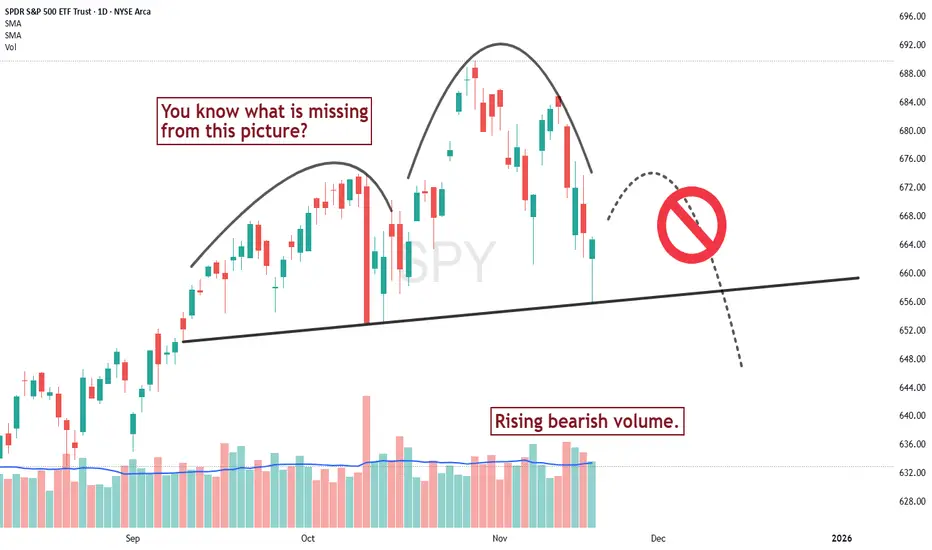
Will the Head and Shoulders pattern complete?Probably not. At least that is what the volume pattern is telling us so far.
Textbook H&S reversal patterns imply that selling volume increase as the pattern goes on, signaling an air of growing nervousness among investors in the market. These nervous investors then fuel a strong move lower.
The lack of nervousness shown in the SPY chart here makes me wonder if we are in rebound territory, and that, eventually, we will see new highs. Possibly by the end of the year.
Bias still downSo far the rally looks very strong but keep in mind we have not broken above the daily 18ma, nor has the Vix broken under it's 18ma. Bias is still down and we are still making (so far) lower highs and lower lows. I believe this is a trap into tomorrow and I still think 645-640 will be the ultimate target.

The week aheadWe possibly bottomed, but there are some SPX charts telling me one more low is a possibility into next week. Sunday night into Monday will be very telling. BTC is just floating around here - but can go lower to test it's low. Gold, probably lower at this point but still very choppy. Oil, maybe forming another low next week. Natural Gas looks like a good shorting opportunity for next week.

SPX at support, a break gets it to 6500All in the video, we are at support but the momentum is firmly pointing down. If they break 6600, 6500 would likely be next.

Global Banking & Financial Stability1. Introduction to Global Banking
Global banking refers to financial institutions that operate across multiple countries and offer a wide range of services—including commercial banking, investment banking, wealth management, and cross-border payment systems. These banks connect global markets by facilitating international trade finance, foreign exchange operations, capital flows, and investment activities.
The world’s large banks—such as JPMorgan Chase, HSBC, BNP Paribas, Mitsubishi UFJ, and Citigroup—are systemically important. They hold trillions in assets and operate in dozens of countries. Their global integration enhances economic connectivity, but it also means that shocks can spread quickly across jurisdictions.
2. Importance of Global Banking in the World Economy
Global banking plays a vital role in:
a) Capital Allocation
Banks direct funds to productive sectors by offering loans, underwriting securities, and supporting business expansions. Efficient allocation helps economies grow.
b) Payment and Settlement Systems
Banking infrastructure enables fast and secure cross-border payments. Systems like SWIFT, CHIPS, Fedwire, and TARGET2 ensure the smooth functioning of global financial markets.
c) Risk Diversification
Banks diversify risk by operating across multiple geographies and asset classes. This lowers the impact of localized economic downturns.
d) Foreign Exchange & Global Trade
Banks facilitate forex trading, hedging, and trade finance instruments (LCs, guarantees). Without them, global trade would slow dramatically.
e) Financial Inclusion and Technology
Through digital banking, fintech collaborations, and mobile payments, global banks accelerate financial inclusion.
3. What Is Financial Stability?
Financial stability means the financial system—banks, markets, institutions, and infrastructure—functions smoothly without widespread disruptions. A stable financial environment:
protects savings and investments
maintains confidence in banking systems
supports credit availability
prevents economic recessions caused by financial crises
When financial stability weakens, it manifest in:
bank failures
liquidity shortages
credit crunch
currency crises
stock market crashes
sovereign debt problems
Ensuring stability is therefore a top priority for central banks and regulators around the world.
4. Key Pillars of Global Financial Stability
a) Strong Banking Regulation
Regulatory frameworks such as Basel I, II, and III set global standards for capital adequacy, risk management, leverage ratios, and liquidity.
Basel III introduced:
Higher capital buffers (CET1 requirements)
Liquidity Coverage Ratio (LCR)
Net Stable Funding Ratio (NSFR)
Countercyclical capital buffers
These measures were strengthened after the 2008 financial crisis to protect banks from insolvency.
b) Effective Central Banking
Central banks maintain financial stability through:
monetary policy (interest rate decisions)
lender-of-last-resort facilities
regulation and supervision
market interventions (bond purchases, liquidity infusion)
Institutions like the Federal Reserve, ECB, Bank of England, and Bank of Japan play critical roles in global stability.
c) Deposit Insurance & Resolution Frameworks
Deposit insurance protects small depositors and prevents bank runs. Resolution frameworks allow failing banks to be wound down without taxpayer bailouts.
d) Global Cooperation
Bodies such as:
IMF
World Bank
Financial Stability Board (FSB)
BIS
Coordinate policies, share information, and manage crisis responses.
5. Major Threats to Global Financial Stability
1. Interest Rate Volatility
Rapid changes in interest rates can affect:
bond markets
bank balance sheets
borrowing costs
debt sustainability
Sharp rate hikes, like those in 2022–2024, exposed vulnerabilities in banks holding long-dated government securities.
2. High Global Debt
Global debt—household, corporate, and sovereign—has reached unprecedented levels. Excessive debt reduces economic resilience and raises default risks.
3. Bank Runs and Liquidity Crises
Digital banking has made withdrawals instantaneous. The collapse of Silicon Valley Bank (SVB) in 2023 showed how quickly liquidity crises can unfold in the modern era.
4. Geopolitical Risks
Events like:
US–China tensions
Russia–Ukraine war
Middle East conflicts
lead to currency volatility, commodity price shocks, sanctions, and capital flight.
5. Cybersecurity Threats
Banks face risks from cyberattacks, ransomware, and data breaches. As banking becomes more digital, systemic cyber risks increase.
6. Shadow Banking System
Non-bank financial institutions (NBFCs), hedge funds, P2P lenders, and money market funds can create risks outside traditional banking regulation.
7. Climate and ESG-Related Risks
Physical climate risks, energy transitions, and carbon pricing affect asset valuations, insurance exposures, and lending portfolios.
6. Lessons from Past Financial Crises
a) 2008 Global Financial Crisis
Triggered by:
excessive leverage
subprime mortgage lending
securitization
lack of oversight
It caused the collapse of major institutions (Lehman Brothers), global recession, and massive bailouts. Stronger regulations were introduced afterward.
b) Eurozone Debt Crisis (2010–2012)
Greece, Portugal, Spain, and Italy faced sovereign debt issues. It highlighted the vulnerability of economies tied by a common currency but not by unified fiscal policy.
c) COVID-19 Crisis (2020)
A global economic shutdown triggered liquidity shortages, but coordinated policy actions (rate cuts, QE, stimulus) helped stabilize markets.
d) US Regional Bank Crisis (2023)
Banks with concentrated deposit bases and interest-rate mismatches faced collapse. It reaffirmed the importance of asset-liability management.
7. Strengthening Financial Stability in the Future
1. Advanced Risk Management
Banks are deploying AI, big data, and machine learning to improve credit scoring, fraud detection, and asset quality monitoring.
2. Technology Regulation
Regulating fintechs, digital banks, crypto exchanges, and stablecoins is essential to prevent new systemic risks.
3. Climate-resilient Banking
Stress testing for climate risk and sustainable finance strategies will be vital.
4. Cross-Border Supervisory Cooperation
As banks operate globally, regulators must share real-time data and jointly manage crises.
5. Modernized Payment Infrastructure
Central bank digital currencies (CBDCs) and faster cross-border payments may improve stability by reducing settlement risks.
Conclusion
Global banking is the lifeline of the world economy, facilitating trade, capital flows, and economic development. Financial stability, on the other hand, ensures that the system can absorb shocks, support growth, and maintain public confidence.
While global banking has become more resilient since the 2008 crisis, new challenges—cyber risks, geopolitical tensions, climate risks, leveraged debt, and technological disruptions—continue to test its strength. Ensuring financial stability requires coordinated global regulation, robust central bank policies, technological safeguards, and disciplined risk management.
In an interconnected world, the stability of one nation’s financial system directly affects others. Therefore, maintaining global banking stability is not just an economic necessity—it is essential for global peace, growth, and long-term prosperity.

3 Option Strategies✅ 1. 0-DTE Iron Fly (ATM Iron Butterfly)
The 0-DTE Iron Fly — selling an at-the-money straddle and buying wings for protection — is the most powerful theta-harvesting strategy in same-day options trading. Its core edge derives from the extraordinary rate of time decay at the money. ATM options experience the fastest gamma and theta changes, and within hours of expiration, their value collapses dramatically if price remains relatively stable.
An iron fly sells both the ATM call and ATM put, while purchasing further OTM wings to cap risk. This creates a defined-risk straddle, turning unlimited risk into a predictable maximum loss. Because you are collecting the highest premium on the chain (the ATM options), this strategy often yields 3–20× more credit than bull put spreads.
Professionals use iron flies on days where the market is expected to consolidate, remain rangebound, or collapse in implied volatility. The setup excels after large overnight moves, strong gap opens, or major news the previous day. These conditions often produce morning chop followed by volatility compression — the exact environment that crushes ATM premiums.
Key Greek behavior defines this strategy’s edge. The position is delta-neutral, vega-negative, and theta-maximizing. A neutral delta means you’re not betting directionally — any sideways action generates rapid profit. The negative vega means falling IV immediately boosts your P&L, and the extraordinarily high theta means the position decays in your favor every minute, especially after 11 AM ET.
However, gamma is the double-edged sword. ATM options have the highest gamma, meaning price moving too far too fast can rapidly eat into the credit and even create maximum loss conditions. For this reason, institutional traders manage iron flies aggressively using time-based exits, gamma stops, and dynamic hedging using micro futures (MES, ES, or SPX futures). They often hedge intraday with small futures positions to flatten delta.
A well-built iron fly has wings positioned at 15–30 delta, balancing risk and credit. The payoff is largest when price finishes near the ATM strike. Closing early—especially when you’ve captured 40–70% of the total credit—is standard practice. The trade is almost always exited before 2:00 PM ET to avoid the “gamma death zone,” where even minor price moves cause large swings.
Iron flies are best for traders with mechanical discipline, strong understanding of intraday volatility patterns, and the ability to manage delta quickly. When executed correctly in calm or mean-reverting markets, the iron fly is the most profitable theta-capture strategy in the entire 0-DTE universe.
Why it’s the best?
Highest theta concentration (ATM options decay the fastest).
Very tight structure → excellent gamma control.
Collects huge premium → offsets intraday noise.
You can define risk precisely.
When to use?
Low–moderate volatility mornings
Rangebound price action
Strong liquidity in SPX, narrow bid–ask
Typical setup:
Sell ATM call + ATM put
Buy wings ±15–30 points
Hold 1–2 hours, manage delta
Stats:
Win rate often 60–75%
Avg R:R 1:0.6 to 1:0.8
Excellent for consistency
✅ 2. 0-DTE Bull Put Spread (BPS)
The Bull Put Spread is the highest-probability and most stable 0-DTE income strategy used by SPX and XSP premium sellers. It involves selling a put that is out of the money and simultaneously buying another put further OTM to define risk. Its primary advantage lies in its exposure to positive theta, negative vega, and controlled gamma, making it ideal for days with orderly price action or bullish-to-neutral drift.
The core principle behind the bull put spread is simple: markets typically spend more time drifting upward or sideways than collapsing. 0-DTE options lose value extremely fast, particularly out-of-the-money options. By selling a 22–26 delta put and buying a 15–17 delta put, you position yourself in the zone where time decay works aggressively in your favor, and where IV crush after the open exponentially increases your probability of profit.
Professional traders rely on several metrics to select the correct strikes. First, the delta ratio between the short and long legs should be between 1.45–1.70. This ensures you're collecting enough premium for the risk while keeping gamma manageable. Next, the short-leg gamma must remain below threshold (0.045 for XSP, 0.015 for SPX), preventing sudden P&L swings late in the session. You also want net vega negative, so falling implied volatility benefits your trade, and net theta positive, so time decay improves your position.
Volume profile, expected move, skew, and opening volatility conditions guide entry timing. The best window tends to be 9:50–10:20 AM ET, after the initial volatility shock has normalized. Avoid entering during major macro events (CPI, FOMC, NFP), as volatility expansion can instantly destroy the probability structure.
You profit if price stays above your short put strike at expiration. Even if price moves downward slightly, the speed of decay can still allow you to win. Risk is strictly defined by the width of the spread, typically 3–5 points in XSP and 30–50 points in SPX. This creates a predictable maximum loss and controlled exposure.
Profit-taking is straightforward: close the spread when it's worth 5 cents or less, or when you’ve captured 70–90% of max profit. Stop out if the spread doubles in value relative to your credit (e.g., enter for $0.30, stop at $0.60). Always exit entirely by 3:32 PM ET to avoid gamma slingshot behavior.
Overall, the bull put spread is the most consistent 0-DTE strategy, with typical win rates between 75–90%, depending on strike selection. It is ideal for traders looking for systematic, repeatable edge without needing to predict market direction — only that markets won’t collapse that day.
Why it works?
Markets drift upward intraday statistically.
Keeps positive theta + directional bias.
When to use?
ES/NQ bullish open
SPX trending strong
VIX < 17
Breadth strong (AD line positive)
Typical setup:
Short put at 5–15 delta
Long put 20–30 points lower
Risk-defined, easy to automate
Stats:
Win rate 80–90% in bullish days
Low stress
Great for small accounts
✅ 3. 0-DTE Broken Wing Butterfly (BWB)
The Broken Wing Butterfly is the most advanced and nuanced 0-DTE strategy, offering asymmetric risk, low cost, and powerful edge during high-volatility or directional days. A BWB is essentially a skewed iron fly or skewed butterfly where one wing is placed further away, creating a structure with higher reward than risk or even a no-debit or credit-based butterfly.
A typical bullish BWB sells two ATM or slightly OTM puts, buys a closer lower put, and buys a further lower put several strikes away. This creates a payoff profile where the middle strike yields the highest profit, but losing scenarios are heavily controlled. The beauty of the BWB is that you can collect credit while still having a buffer zone and minimizing tail risk.
Unlike the bull put spread or iron fly, the broken wing butterfly shines in volatile markets. It's designed to handle one-directional moves, strong intraday drops, or large opens. When skew is elevated — especially put skew — the far-out wing becomes cheap, allowing you to build the structure for little or no cost. This skew is what gives BWBs institutional appeal: they exploit uneven pricing in the options chain created by market fear.
Key features include moderate gamma, moderate theta, and mildly negative vega. Although not as theta-rich as iron flies or as high-probability as bull put spreads, BWBs offer something neither of those provide: asymmetric opportunity. You risk less than you can make, while still benefiting from IV crush and directional drift.
Professionals place BWBs based on expected move, skew, and opening momentum. A bullish BWB is ideal when price is expected to drift upward or when volatility is high enough that selling ATM premium is too dangerous. It provides better tail risk management than credit spreads and avoids the unlimited risk of naked options.
Management rules revolve around maintaining delta, controlling gamma, and monitoring whether price migrates toward the tent peak. Traders often take profits early if price stalls near the short strike or begins to threaten the near wing. If price collapses rapidly, a BWB tends to hold up far better than a credit spread, because the long wing absorbs much of the gamma and Vega shock.
The BWB becomes exceptionally powerful when structured for zero debit, creating a free “lottery ticket” with hedged downside. Many traders use multiples—layering BWBs at different levels—to build a volatility-weighted directional profile.
In high volatility, trending, or one-directional markets, the broken wing butterfly is the best risk-adjusted strategy, offering safety, optionality, and strong skew exploitation.
Why this is sleeper-OP?
Collects more credit than risk (asymmetry).
Handles violent intraday moves better than iron fly.
Still benefits from fast theta burn.
When to use?
VIX severe > 20
ES/NQ whipsaw
FOMC days, CPI, NFP
Big macro catalyst days
Typical setup:
Sell ATM short strikes
One wing close
One wing far out
Net credit > max loss
Stats:
Win rate 50–70%
Best for tail-risk adjusted returns.
⭐ Which one is best overall?
If you want consistency:
→ 0-DTE Iron Fly
If you want safest risk-defined trending play:
→ 0-DTE Bull Put Spread
If you want best payout on volatile days:
→ 0-DTE Broken Wing Butterfly
QuantSignals V3: SPY 0DTE Capitalize on Afternoon Reversal!SPY QuantSignals V3 0DTE 2025-11-17
Market Structure:
SPY is trading below VWAP (-0.38%) and showing a controlled downtrend through the morning session. Price is respecting lower highs and holding below intraday resistance at $676.26, signaling clear bearish structure despite mixed macro conditions.
Momentum Outlook:
Katy 1M predicts a bullish push into 2:22 PM (target ~$677.97) before a sharp reversal into close, aligning with typical 0DTE “late-day fade” patterns. Multi-timeframe technicals remain 100% bearish, and trend strength is elevated at 77.7%, increasing conviction in afternoon downside.
Order Flow Insight:
PCR at 0.83 shows light put preference, but max pain at $678 adds downward pressure by expiration. Gamma risk is low, meaning cleaner directional movement and less likelihood of pinning.
Key Levels:
Resistance: $676.26 → $677.90 (Katy peak zone)
Support: $669.48 (session low) → $667.80
Reversal Trigger Zone: $676.80–$678.00 (after 2:00 PM)
Timing Vision:
The highest-probability entry occurs AFTER the predicted 2:22 PM peak, targeting the expected decline into close. Afternoon volatility + 0DTE decay amplifies the move.
Vision Summary:
SPY is primed for a late-day reversal: morning weakness, midday relief rally, then clean afternoon fade. Best setup is a tight PUT entry at the peak zone ($676–678) with targets aligned to Katy’s projected closing drop.
Time to pause and ThinkNothing definitive, but we got to the 18 weekly ma and the daily BB and horizontal support. A relief rally is likely, but it could be short lived if they want to quickly break down to 6200. Vix is at resistance. Gold, probably a move up from here. BTC could drop a bit more but it's in a support zone. Oil may drop to test it's lows.
Good luck!
