Morning Market UpdateTest of the highs/breaking the highs is still possible today on SPX but a breakdown under the previous channel would be bearish. Gold could rally a bit more but I think it would start dropping after. Oil bias is now up and probably consolidates a bit here. BTC looks like it will drop.
Trade ideas

I see 2 pathsSPY bounced from it's previous channel - still a chance we'll see a spike up. A gap down below the channel tomorrow is a short. Gold looks good for a larger bounce. Oil looks bullish. Vix could go either way here.

Spike and DropA spike up on the SP is likely to take out stops. Target 6800+ Gold still can bounce here at support. OIL looks good, but may fall a bit before a bigger move up (if it's coming). BTC can get to 116k still

Update on the marketsSPX is close to all time highs. A break above and reversal would be bearish. Gold and Silver probably bounces hard from here. BTC lower but could again rally. USOIL probably lower but could find a bottom soon.

SPY FREE SIGNAL|SHORT|
✅SPY is reacting from the all-time-high zone where institutional orders previously accumulated. A short-term retracement is likely as price sweeps liquidity above premium highs before rebalancing to the nearest fair-value gap. Time Frame 2H.
SHORT🔥
✅Like and subscribe to never miss a new idea!✅

SPY – Key Reversal or Relief Bounce? Oct. 21-25SPY – Key Reversal or Relief Bounce? GEX Shows Tight Battle Ahead ⚔️
📆 Daily Timeframe – Macro Trend Holding by a Thread
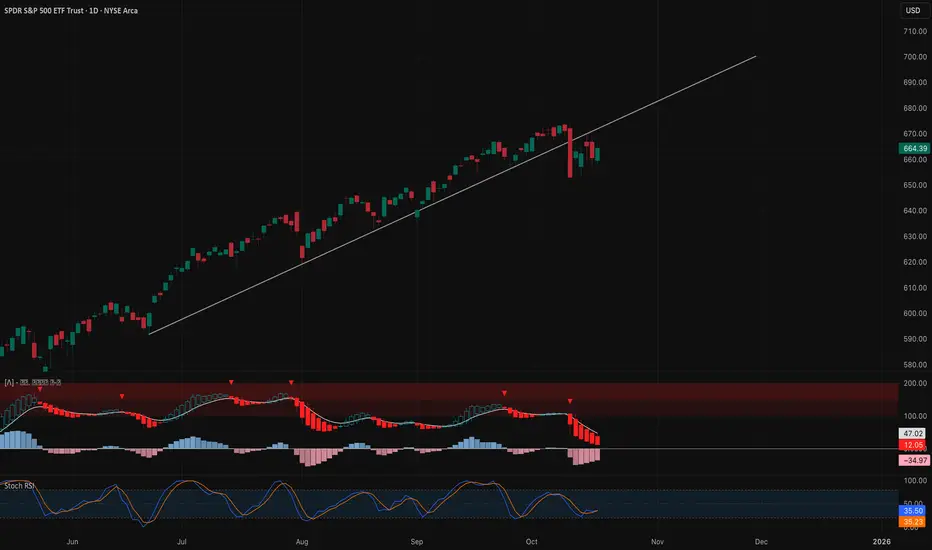
SPY remains in a broad uptrend channel but is now testing the rising trendline from June’s base.
The recent pullback from the all-time high at $688 → $660 was sharp but controlled — a healthy correction unless we break decisively below $653–$650.
* MACD continues to bleed lower with bearish momentum but histogram bars are flattening — early signs of loss in selling strength.
* Stoch RSI sits mid-zone near 35–55, suggesting a possible reset before next leg.
* As long as SPY holds above $653, the macro trend remains bullish, but a daily close under that opens room toward $632 (channel base).
Upside: reclaiming $671–$675 would re-ignite momentum toward $690–$700.
Downside: losing $653 confirms deeper correction phase.
⏱ 1-Hour Timeframe – Structure Reversal in Progress
SPY has printed a clear Change of Character (CHoCH) off the $652 demand zone, bouncing to retest its descending channel.
Price is currently pressing into the $665–$670 supply band.
* MACD flipped bullish and shows expanding positive histogram bars.
* Stoch RSI in overbought zone, signaling short-term exhaustion.
* Key levels:
* Support: $657 / $653
* Resistance: $670.2 / $672
A clean hourly close above $670.2 opens a potential breakout run toward $675–$678, but failure could trigger another pullback to $657–$660.
⚡️ 15-Minute Timeframe – Intraday Battle Between Bulls and Bears
The 15-minute chart shows a rising wedge inside a corrective phase.
Multiple BOS and CHoCH prints confirm a tug-of-war around the intraday midline ($665).
* MACD is curling down from high zone, suggesting short-term consolidation or a micro-pullback before the next leg.
* Stoch RSI crossing below 50 — intraday momentum fading.
Scalp Scenarios:
* Bullish: reclaim above $668.7 → target $671–$673, stop below $662.
* Bearish: break below $661 → target $656–$653, stop above $665.5.
Expect choppy reactions around $665 due to overlapping liquidity clusters.
📊 Options & GEX Sentiment View – Institutional Positioning Insight
Gamma Exposure (GEX) data shows a balanced battlefield with slightly bullish bias.
* Highest Call Wall / Gamma Resistance: $675
* Major Call Walls: $670 / $672.5
* Heavy Put Support: $658 / $653 / $647
* HVL (High Volatility Line): $660 for 10/20 expiry
Net Positioning:
* Call dominance near $665–$672, suggesting dealers will hedge upward if SPY continues climbing.
* Puts remain concentrated below $653, acting as magnetic support should volatility spike.
* IVR 28.1, IVx Avg 19.6, and Put$ 100.6% dominance reflect a hedged but not panic-driven market.
If SPY sustains above $665, gamma flips positive — encouraging smoother upward grind into $670–$675.
Below $660, delta hedging may amplify drops into $653–$647.
🎯 Outlook for Monday–Tuesday
Expect SPY to oscillate between $660–$672 early week.
Macro uptrend remains intact but fragile — a decisive break above $675 could invite strong momentum buying, while a close under $653 may confirm deeper correction.
Traders should stay patient and fade extremes within that range until gamma or volume breakout confirms direction.
Disclaimer:
This analysis is for educational purposes only and does not constitute financial advice. Always do your own research and trade responsibly.
Sone ideas on SPX Gold Silver BTC and OilSome ideas presented. SPX still looks like a short as of now. Gold, may bounce but I think it will continue to drop. USOIL at strong support. BTC may fall but be wary of one more move up. Gold/Silver ratio at support with weekly rsi turning up.

$SPY Tomorrow’s Trading Range 10.21.25
Alway’s know where your 35EMA is.
It is underneath the implied move right now, which means tomorrow has a high probability of being flat or down. ATH’s are in tomorrow’s range above us, and 35EMA underneath us with that 30min 200 and also the bull gap from open as well… let’s go…

Yield Curve: The Calm Before the Storm?Over the past 30 years, every time the yield curve (10Y–1Y) inverted and then turned back to positive territory, a recession and a major equity drawdown followed shortly after.
🔹 Inversion phase:
When short-term yields exceed long-term yields, the market is signaling that the Fed has tightened too much and that growth will slow down.
🔹 Normalization phase (back to positive):
This is where things usually break. The Fed starts cutting rates, the curve steepens again — not because growth is rebounding, but because the economy is already weakening.
Historically, the real pain for equities (SPY) has come after the curve “un-inverts”, not when it first inverts.
📉 2000 — Dotcom bust
📉 2008 — GFC
📉 2020 — Pandemic shock
❓ 2025 — Same pattern repeating?
🧭 Takeaway:
The inversion warns you; the re-steepening confirms it.

Double Top and Dump simulation (Bearish With Time) Here's a double top scenario slight run to 680. forecasted CMF, MACD, and price action. fits within retracement and time for your Fibonacci nerd.
~$630 11/20/25
~$680 12/30/25
1. Santa rally
2. Gov Shutdown over probably at the 11/20 mark
3. Taco Rally on 11/20 as well
~$650 1/7/25
~$675 2/25/26
~$620 4/16/26
~$600 7/6/26
~$630 7/30/26
~$600 8/21/26
~$550 10/16/26
Just an alternative theory to my blow off top idea.
SP:SPX AMEX:SPY

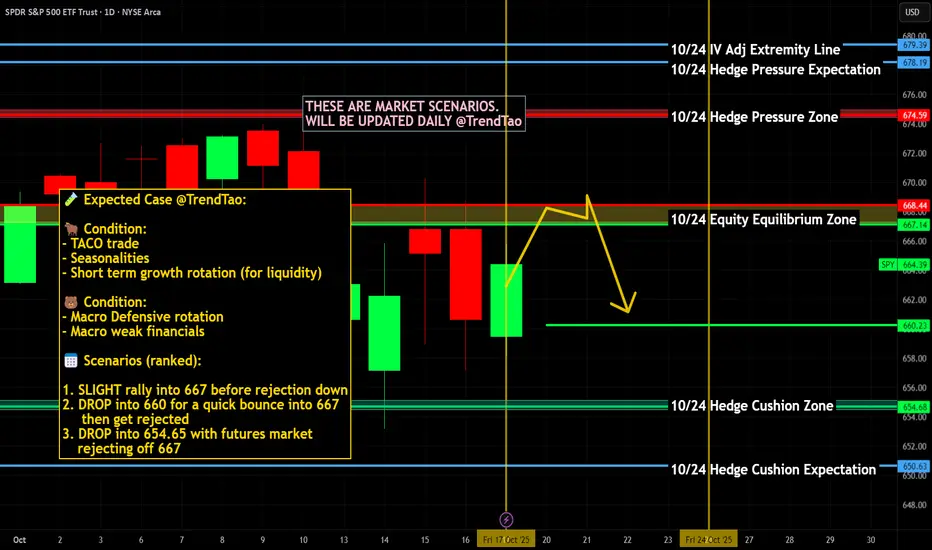
$SPY / $SPX Scenarios — Week of Oct 20 → Oct 24, 2025🔮 AMEX:SPY / SP:SPX Scenarios — Week of Oct 20 → Oct 24, 2025 🔮
🌍 Market-Moving Headlines
🚩 Inflation week: The delayed CPI release on Friday could be the first key data drop since the shutdown began — all eyes on price momentum and Fed expectations.
📉 Jobless Claims live feed: The only consistent macro signal right now — still reporting despite shutdown; any uptick could rattle yields and growth sentiment.
💬 Fed tone matters more: Policymakers continue to speak through the data void; expect market sensitivity to even minor policy hints.
💻 Earnings peak week: Roughly 80+ S&P 500 names report, including several mega-caps — likely to set the tone for AMEX:SPY and $QQQ.
📊 Key Data & Events (ET)
Mon 10/20
⏰ No major scheduled data
Tue 10/21
⏰ No major scheduled data
Wed 10/22
⏰ No major scheduled data
Thu 10/23
⏰ 🚩 8:30 AM — Initial Jobless Claims (Oct 18) — only active weekly macro indicator
⏰ 10:00 AM — Existing Home Sales (Sept) (may be delayed due to shutdown)
Fri 10/24
⏰ 🚩 8:30 AM — Consumer Price Index (CPI & Core CPI, Sept) (delayed release expected)
⚠️ Note:
With most official data frozen, Jobless Claims and CPI carry extra weight. Expect sharp intraday swings on any surprise readings or leaks.
⚠️ Disclaimer: Educational / informational only — not financial advice.
📌 #trading #stockmarket #SPY #SPX #CPI #JoblessClaims #Fed #inflation #bonds #yields #shutdown #earnings #economy #megacaps #datawatch
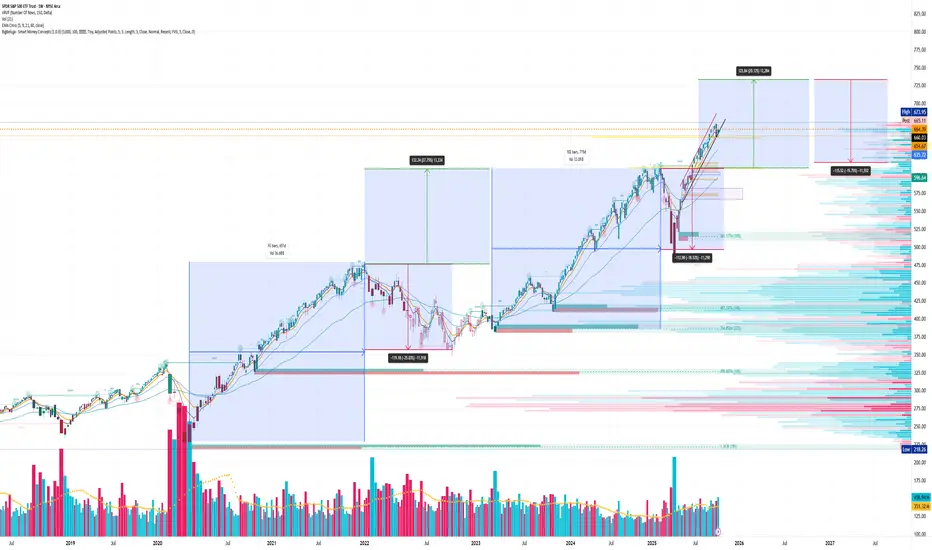
Blow Off Top Simulation SPY (Bearish with Hedges)We now have our first 1Week chart with a red candle since April which is a big deal and will probably lead to a regime change.
I wanted to see what the worst case scenario would look like blow off top. totally possible i used the price action since April to mirror the same pattern.
The reason why i think a blowoff top is that we broke the trend line we've been in for a few years so the structure is off and we'll need to find a new trend, this give price action the excuse to continue especially with all this liquidity. ultimately i think the liquidity isn't rally cash but exit liquidity and a window for the institutions to hand out bags.
we also need to keep in mind there will be tax loss harvesting coming up some are already in that mode.

HOW-TO: Trade-o-Scope Plot Custom Data v2This is a short HOW-TO on using the Trade-o-Scope "Plot Custom Data v2" indicator

$SPY chart patternsTake a good look at this fellow traders. I didn't put a lot of time into this, so excuse my lack of numbers. You could call me a visual learner to simplify what already feels like a complicated day if you know what i mean.
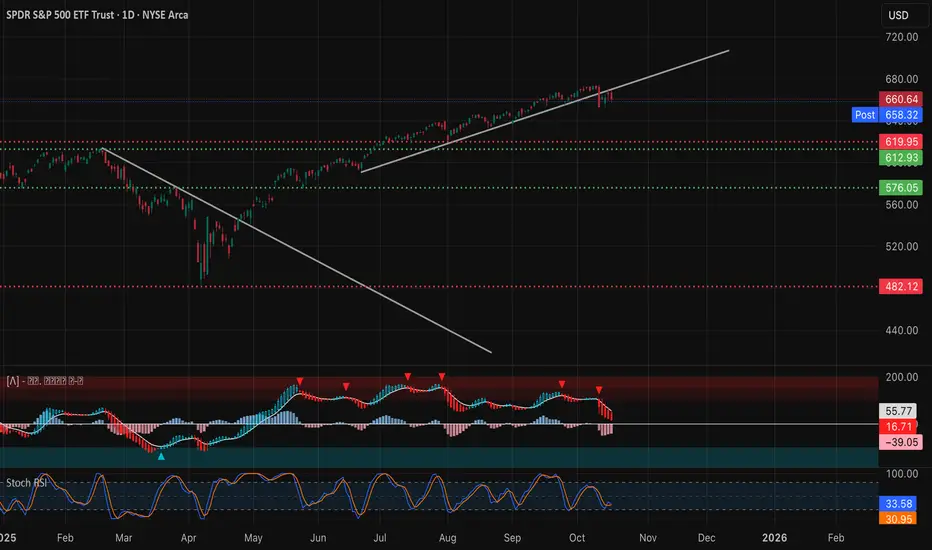
October 17th 2025 - All time high res on S&P 500 SPY held ...S&P 500 SPY put in all time high at 673.95 on October 9th 2025. Now watching 673.95 resistance and support at around 652.84. Expecting some consolidation now ....

Signs and SignalsSP500 bounced from overnight lows. Do we get a ramp up to all time highs? It's hard to tell. A little more squeezing of late shorts may be all that is needed for the bigger players to step in and sell it. Watch 6550, if it breaks we likely breakdown. Over the 18ma at 6677 and we are likely rallying into next week at the least.

Position Sizing and Risk ManagementThere are multiple ways to approach position sizing. The most suitable method depends on the trader’s objectives, timeframe, and account structure. For example, a long-term investor managing a portfolio will operate differently than a short-term trader running a high-frequency system. This chapter will not attempt to cover all possible methods, but will focus on the framework most relevant to the active trader.
Equalized Risk
The most practical method for position sizing is known as equalized risk per trade. This model ensures that each trade risks the same monetary amount, regardless of the stop loss distance. The position size will be calculated based on the distance between the entry price and the stop loss, which means a closer stop equals more size, where a wider stop equals less size. This allows for a more structured and consistent risk control across various events.
Position Size = Dollar Risk / (Entry Price − Stop Price)
Position Size = Dollar Risk / (Entry Price × Stop in %)
For example, an account size of $100,000 and risk amount of 1% will be equivalent to $1,000. In the scenario of a $100 stock price, the table below provides a visual representation of how the position size adapts to different stop loss placements, to maintain an equalized risk per trade. This process can be integrated into order execution on some trading platforms.
The amount risked per trade should be based on a fixed percentage of the current account size. As the account grows, the dollar amount risked increases, allowing for compounding. If the account shrinks, the dollar risk decreases, which helps reduce the impact of continued losses. This approach smooths out the effect of random sequences. A percentage-based model limits downside exposure while preserving upside potential.
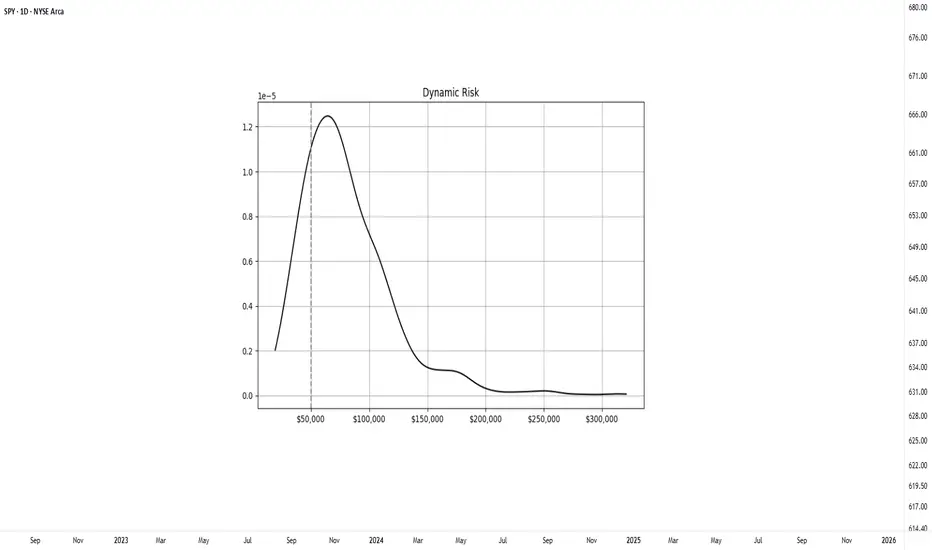
To better illustrate how position sizing affects long-term outcomes, a controlled simulation was conducted. The experiment modeled a system with a 50% win rate and a 1.1 to 1 average reward-to-risk ratio. Starting with a $50,000 account, the system executed 500 trades across 1000 separate runs. Two position sizing methods were compared: a fixed dollar risk of $1000 per trade and a dynamic model risking 2% of the current account balance.
Fixed-Risk Model
In the fixed-risk model, position size remained constant throughout the simulation. The final outcomes formed a relatively tight, symmetrical distribution centered around the expected value, which corresponds to consistent variance.
Dynamic-Risk Model
The dynamic-risk model produced a wider and more skewed distribution. Profitable runs experienced accelerated increase through compounding, while losing runs saw smaller drawdowns due to self-limiting trade size. Although dynamic risk introduces greater dispersion in final outcomes, it allows scalable growth over time. This compounding effect is what makes a dynamic model effective for achieving exponential returns.
A common question is what percentage to use. A range between 1–3% of the account is generally considered reasonable. Too much risk per trade can quickly become destructive, consider that even profitable systems may experience a streak of losses. For instance, a series of five consecutive losses at 10% risk per trade would cut the account by roughly 41%, requiring over a 70% return to recover. In case catastrophic events occur; large position sizing makes them irreversible. However, keeping position size and risk too small can make the entire effort unproductive. There is no such thing as a free trade, meaningful reward requires exposure to risk.
Risk Definition and Stop Placement
Risk in trading represents uncertainty in both the direction and magnitude of outcomes. It can be thought of as the potential result of an event, multiplied by the likelihood of that event occurring. This concept can be formulated as:
Risk = Outcome × Probability of Outcome
This challenges a common assumption that using a closer stop placement equals reduced risk. This is a common misconception. A tighter stop increases the chance of being triggered by normal price fluctuations, which can result in a higher frequency of losses even when the trade idea is valid.
Wide stop placements reduce the likelihood of premature exit, but they also require price to travel further to reach the target, which can slow down the trade and distort the reward-to-risk profile. An effective stop should reflect the volatility of the instrument while remaining consistent with the structure of the setup. A practical guideline is to place stops within 1–3 times the ATR, which allows room for price movement without compromising the reward-risk profile.
When a stop is defined, the distance from entry to stop becomes the risk unit, commonly referred to as R. A target placed at the same distance above the entry is considered 1R, while a target twice as far is 2R, and so on. Thinking in terms of R-multiples standardizes evaluation across different instruments and account sizes. It also helps track expectancy, maintain consistency, and compare trading performance.
In summary, risk is best understood as uncertainty, where the outcome is shaped by both the possible result and the probability of it occurring. The preferred approach for the active trader is equalized risk per trade, where a consistent percentage of the account, typically 1–3%, is risked on each position regardless of the stop distance. This allows the account to develop through compounding. It also reinforces the importance of thinking in terms of sample size. Individual trades are random, but consistent risk control allows statistical edge to develop over time.
Practical Application
To simplify this process, the Risk Module has been developed. The indicator provides a visual reference for position sizing, stop placement, and target definition directly on the chart. It calculates equalized risk per trade and helps maintain consistent exposure.
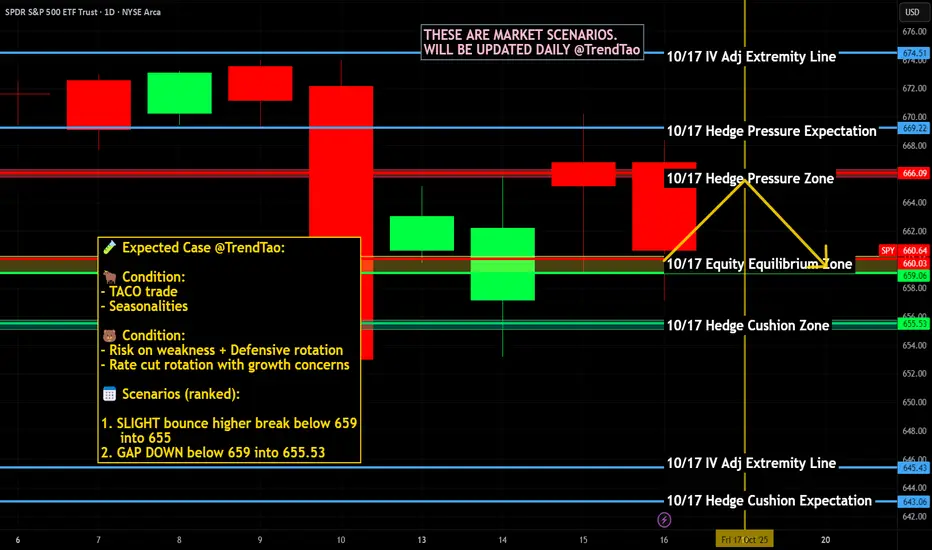
$SPY / $SPX Scenarios — Friday, Oct 17, 2025🔮 AMEX:SPY / SP:SPX Scenarios — Friday, Oct 17, 2025 🔮
🌍 Market-Moving Headlines
🚩 Data blackout risk: Friday was set for key housing and production reports — but the ongoing shutdown means most prints (Housing Starts, Industrial Production, Import Prices) may not be released.
📉 Macro vacuum: With no confirmed data, traders lean on positioning and bond moves to gauge growth sentiment into the weekend.
💬 Earnings carry the weight: Corporate results take the spotlight as macro inputs dry up.
💻 Technical tone: AMEX:SPY and NASDAQ:QQQ watchlist rotation continues — watch volatility pockets if liquidity fades mid-session.
📊 Key Data & Events (ET)
⏰ 8:30 AM — Housing Starts & Building Permits (Sept) — scheduled but may not print
⏰ 8:30 AM — Import Price Index (Sept) — scheduled release
⏰ 9:15 AM — Industrial Production & Capacity Utilization (Sept) — scheduled but may not print
⚠️ Note: Friday wraps a quiet macro week dominated by missing data and Fed commentary. Expect a headline-driven close with limited participation ahead of weekend risk.
⚠️ Disclaimer: Educational / informational only — not financial advice.
📌 #trading #stockmarket #SPY #SPX #housing #IndustrialProduction #ImportPrices #Fed #bonds #economy #shutdown #yields #equities
SPY Friday Setup – Bears Take Control Below $662. Oct. 17SPY Friday Setup – Bears Take Control Below $662 as Gamma Turns Negative ⚠️”
📊 Multi-Timeframe Breakdown
🕒 1. Daily Chart – Macro Structure (“The Why”)
SPY continues to lose grip at the upper trend channel, printing its third consecutive red daily candle and officially breaking below the short-term rising trendline that’s guided price since April.
The breakdown below $662–$665 confirms a near-term shift in momentum from bullish to neutral-bearish.
MACD shows a clear bearish crossover, with histogram momentum building to the downside. Stoch RSI sits near the lower band, but not yet oversold — implying more room for a grind-down before a proper bounce.
Macro Bias: Momentum fading; corrective wave likely unfolding toward key supports at $650 → $620 unless bulls reclaim $665.
Key Levels:
* Resistance: $662 → $670 → $682
* Support: $658 → $650 → $620
⏰ 2. 1-Hour Chart – Active Market Structure (“The Setup”)
The 1H structure highlights a CHoCH confirmation near $662, with a decisive BOS to the downside that opened a new lower-low pattern.
Price retested the underside of the broken channel around $662–$664, rejected cleanly, and now trades below the intraday trendline — a bearish continuation setup.
MACD remains deep in negative territory, while Stoch RSI has reset near zero, suggesting sellers still control short-term momentum.
A recovery into $662–$664 may offer a fade setup if buyers fail to break above that zone with volume.
Key Levels:
* Resistance: $662 → $665 → $670
* Support: $655 → $650 → $645
💹 3. 15-Minute Chart – Intraday Execution (“The How”)
On the 15-minute timeframe, SPY shows a tight descending channel with multiple CHoCH → BOS prints confirming lower-high structure.
The MACD histogram has slightly flattened near zero, indicating short-term indecision after extended downside. Meanwhile, Stoch RSI is curling upward from oversold — suggesting a brief relief bounce before sellers step in again.
If price holds below $662, every rally into $660–$663 remains a short opportunity zone.
Scalp Plan:
* Bearish Scenario: Enter below $658, target $654 → $650, stop above $662.5
* Bullish Scenario: Flip long only on confirmed reclaim above $665, target $670, stop below $661
Volume spikes show heavy positioning around $660 — a battle zone likely to dictate the next leg.
📈 4. GEX (Gamma Exposure) Chart – Dealer Positioning (“The Fuel”)
Gamma flow data shows a bearish dealer setup, with highest negative NETGEX and PUT support now anchored near $660.
Dealers are short gamma — meaning volatility expansion can accelerate in either direction, but the bias is currently to the downside.
* Gamma Flip Zone: $662
* Highest Negative GEX / Put Wall: $660 (active support magnet)
* Second Put Wall: $656 → $654
* Call Resistance: $662 → $665
* IVR: 36.3 | IVx avg: 24.3 | Put flow: 145.1% dominant
The gamma structure implies dealers are hedging aggressively below $660, which can amplify intraday drops if $658 fails.
Until SPY reclaims $662+, market makers’ hedging flows remain bearish.
🎯 Final Outlook
SPY’s technical structure and gamma setup both favor a bearish-to-neutral bias heading into Friday.
The key battleground sits between $658–$662 — a zone where intraday liquidity repeatedly flips.
If $662 holds as resistance, expect continued downside toward $654–$650, where gamma exposure may stabilize.
A sharp reclaim of $665 would invalidate the short setup and shift sentiment back toward range recovery.
Watch for a fake breakout above $662 early Friday followed by rejection — a classic “trap and drop” scenario that aligns with the current gamma map.
Disclaimer:
This analysis is for educational purposes only and not financial advice. Always do your own research and manage your risk carefully.
$SPY / $SPX Scenarios — Thursday, Oct 16, 2025🔮 AMEX:SPY / SP:SPX Scenarios — Thursday, Oct 16, 2025 🔮
🌍 Market-Moving Headlines
🚩 Big macro day — if it happens: Retail Sales & PPI headline the morning, but both reports may be delayed under the ongoing shutdown. Markets will trade on expectation and reaction instead of prints.
📈 Consumer + price pulse: These two data points were expected to test the “soft-landing” narrative — inflation vs. spending resilience.
💬 Fed-speak heavy: Barkin, Waller, Bowman, and Miran dominate the lineup; tone on inflation stickiness may shape yields.
🏠 Housing check: Homebuilder Confidence offers a softer read on the real-economy drag from higher mortgage rates.
📊 Key Data & Events (ET)
⏰ 8:00 AM — Tom Barkin (Richmond Fed) remarks
⏰ 8:30 AM — Retail Sales (Sept) & PPI (Sept) — scheduled but may not print
⏰ 8:30 AM — Initial Jobless Claims (Oct 11) — scheduled release
⏰ 9:00 AM — Stephen Miran & Christopher Waller (Fed Govs) speeches
⏰ 10:00 AM — Michelle Bowman (Fed Gov) remarks + Homebuilder Confidence (Oct)
⏰ 12:45 PM / 4:30 PM — Tom Barkin (Richmond Fed) speeches
⚠️ Disclaimer: Educational / informational only — not financial advice.
📌 #trading #stockmarket #SPY #SPX #RetailSales #PPI #Fed #Barkin #Waller #Bowman #Miran #inflation #bonds #shutdown #economy #yields #housing

The Magic Show continuesMore tricks and traps tomorrow are possible.
The rsi and price action is concerning to me, and it tells me to stay cautious. We may see another fast move up to take out stops above the all time high, even if there is a sell off first with the numbers tomorrow at 8:30. Vix may have a similar "false breakout" and reversal back to it's breakout zone. Be very careful if there are fast moves down which seem to be bearish.

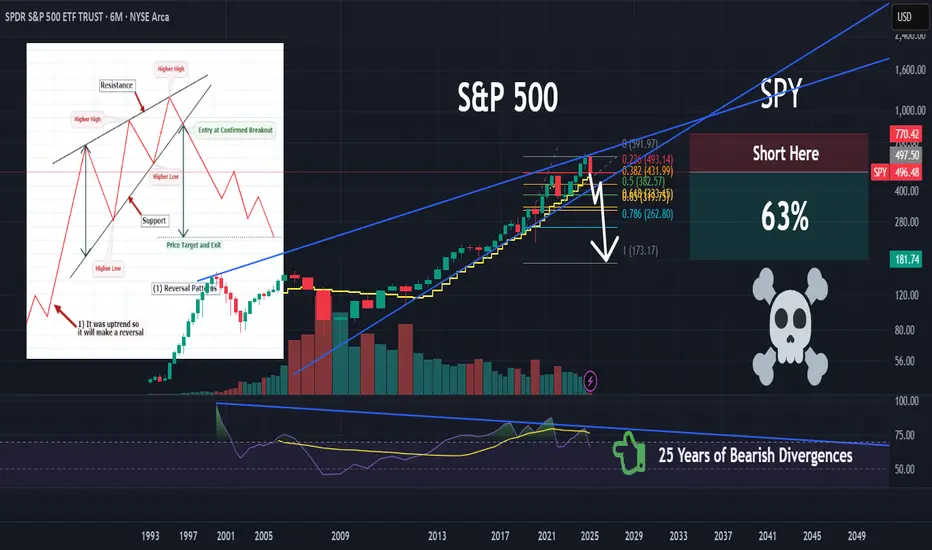
SPY | Things Could Get Ugly | ShortSPDR S&P 500 ETF Trust seeks to provide investment results that, before expenses, correspond generally to the price and yield performance of the S&P 500 Index. The Trust seeks to achieve its investment objective by holding a portfolio of the common stocks that are included in the index (the "Portfolio"), with the weight of each stock in the Portfolio substantially corresponding to the weight of such stock in the index.
Objective short on SPYAt resistance, slightly over the 18ma. Stops probably taken out but structure looks like it could drop from here. Also covering gold, bitcoin and the vix
