Waiting for the Stock Market to FallI’m expecting a decline in the stock market. Long positions are relevant only in the commodity sector — no stock longs!
At the moment, I’m not entering any positions. I’m watching the market, monitoring major players (who, by the way, are closing their positions and moving into cash), and keeping an eye on the news flow.
I believe that later this year or early next year, an opportunity to open a short position will appear. For now, I’m just observing. There have already been a few attempts to enter the market, but stop-losses got triggered. Thanks to stop-losses for existing — they prevent blowing up the account.
Right now, there’s no rush. It’s all about waiting for the right trade. Meanwhile, I’m staying long in metals.
Trade ideas
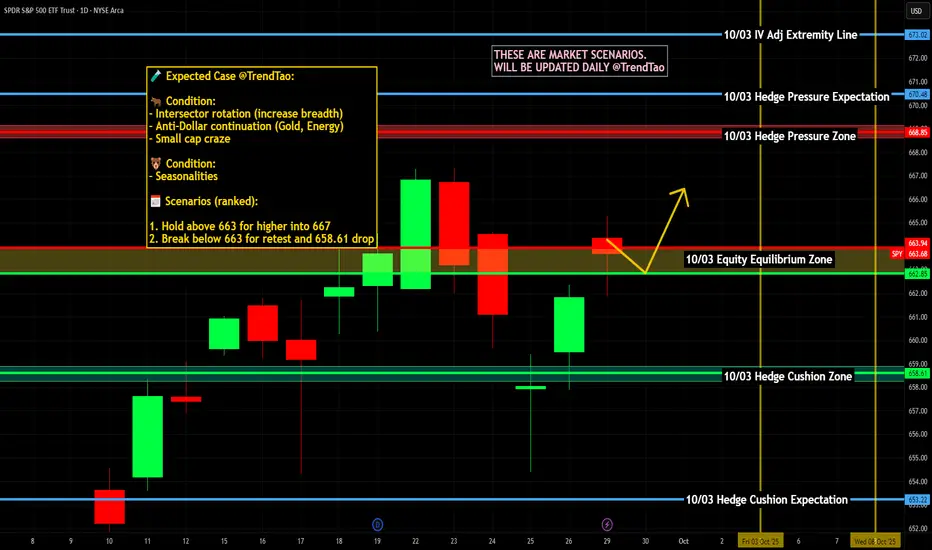
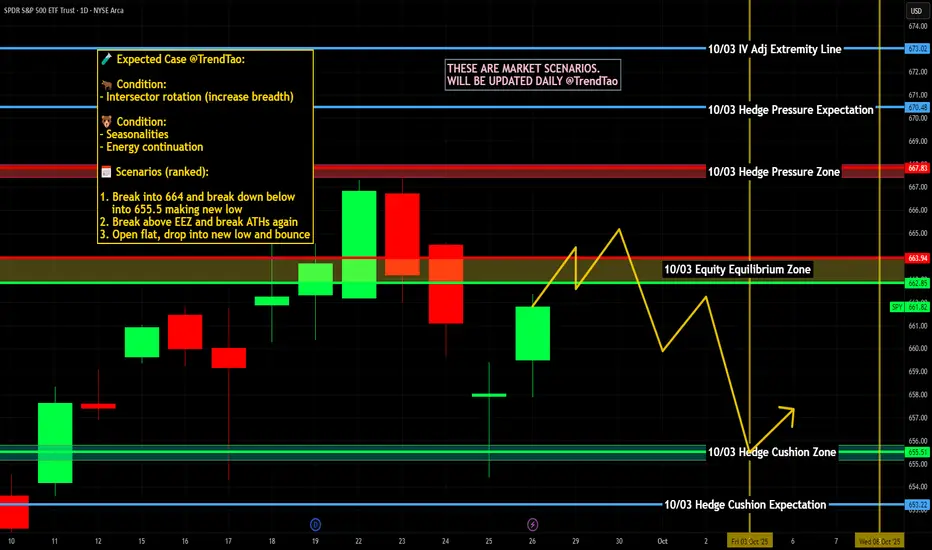
$SPY / $SPX Scenarios — Tuesday, Sept 30, 2025🔮 AMEX:SPY / SP:SPX Scenarios — Tuesday, Sept 30, 2025 🔮
🌍 Market-Moving Headlines
📉 Q3 closeout: Last trading day of September = quarter-end rebalancing flows in equities and bonds.
💵 Fed watch: Multiple Fed speakers across the day keep policy tone in focus.
💻 Mega-cap drift: NASDAQ:AAPL , NASDAQ:MSFT , NASDAQ:NVDA leadership remains sensitive to yields + growth data.
📊 Key Data & Events (ET)
⏰ 🚩 9:00 AM — S&P Case-Shiller Home Price Index (Jul, 20-city)
⏰ 🚩 10:00 AM — JOLTS Job Openings (Aug)
⏰ 🚩 10:00 AM — Consumer Confidence (Sep, Conf. Board)
⏰ 9:45 AM — Chicago PMI (Sep)
🗣️ Fed Speakers:
• 6:00 AM — Philip Jefferson (Fed Vice Chair)
• 9:00 AM — Susan Collins (Boston Fed)
• 1:30 PM — Austan Goolsbee (Chicago Fed)
• 3:30 PM — Austan Goolsbee (Chicago Fed, TV appearance)
⚠️ Disclaimer: Educational/informational only — not financial advice.
📌 #trading #stockmarket #SPY #SPX #Fed #Powell #JOLTS #ConsumerConfidence #CaseShiller #PMI #Dollar #bonds #megacaps
SPYBASED ON OUR AI FEDRATE MODEL HIGHER LONG TERM PROJECTIONS HAVE BEEN POSTED ON THE CHART.
THERE IS $7.7 TRILLIONS parked in #MONEY market funds. The #FED is going to cut rates next month. THIS COULD BE THE SOURCE OF 🚀 TO PUSH #SPY #SPX much higher.

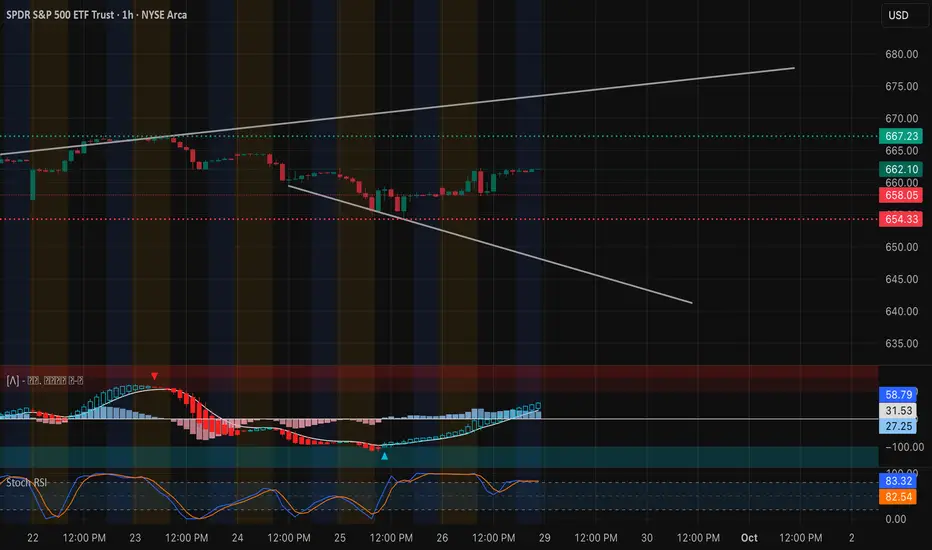
SPY – Bulls Regain Control as Gamma Frame the Next Move. Sep 291-Hour Technical Outlook
SPY has rebounded sharply off the $654–$655 demand zone, reclaiming $662 and now grinding toward the top of its rising wedge. The hourly MACD shows strong positive momentum and the Stoch RSI is elevated near overbought, suggesting bulls are in short-term control but may need a healthy pullback or consolidation to reset.
Key resistance lies at $664–$667, with a larger breakout level at $668. Support to monitor sits at $660, then $657, the key inflection area that triggered Friday’s bounce.
Gamma Exposure (GEX) Confirmation
The options market echoes the chart setup:
* Highest positive GEX / Call Resistance sits at $664–$667, with the strongest wall near $668, matching the upside breakout zone.
* Heavy Put Support rests at $657, with secondary layers around $655, forming a robust floor.
* Dealers are currently net short gamma, which can add fuel to intraday moves as price approaches these extremes.
A decisive hourly close above $667 could create a gamma squeeze toward $668+, while a drop under $657 would likely trigger defensive selling toward $655.
Trade Ideas & Option Plays for This Week
* Bullish Setup: Long on a clean break above $664–$667, targeting $668. Option setups: 0DTE or 2DTE 665/670 call spreads to manage risk and cost.
* Bearish Setup: Short if SPY fails at $664 and closes back below $657, targeting $655 or even $650. Consider 660/655 put spreads or short-dated puts.
* IVR around 14.5 and IVx ~13 mean option premiums are relatively low—good for debit strategies.
My Take
SPY is attempting a trend resumption after last week’s pullback. The gamma map lines up perfectly with the technical picture: $657 is the line in the sand for bulls to defend, while $667–$668 is the breakout trigger. Expect increased volatility once price decisively moves beyond either side.
Disclaimer: This analysis is for educational purposes only and does not constitute financial advice. Always do your own research and manage risk before trading.
$SPY / $SPX Scenarios — Week of Sept 29 → Oct 3, 2025🔮 AMEX:SPY / SP:SPX Scenarios — Week of Sept 29 → Oct 3, 2025 🔮
🌍 Market-Moving Headlines
📉 Month/Q3 closeout: Quarter-end rebalancing + fund flows set tone early in the week.
🚩 Jobs Week: ADP (Wed) + NFP (Fri) will dominate macro narrative and Fed expectations.
💻 Mega-cap rotation: NASDAQ:AAPL , NASDAQ:NVDA , NASDAQ:MSFT drive tech leadership amid yield volatility.
🌐 Housing + confidence: Home sales + Case-Shiller + sentiment test consumer resilience.
💵 Rates & Fed tone: Packed Fed speaker slate keeps policy path in play alongside data.
📊 Key Data & Events (ET)
Mon 9/29
⏰ 10:00 AM — Pending Home Sales (Aug)
Tue 9/30
⏰ 🚩 9:00 AM — S&P Case-Shiller Home Price Index (Jul)
⏰ 🚩 10:00 AM — JOLTS Job Openings (Aug)
⏰ 🚩 10:00 AM — Consumer Confidence (Sep)
⏰ 9:45 AM — Chicago PMI (Sep)
Wed 10/1
⏰ 🚩 8:15 AM — ADP Employment (Sep)
⏰ 🚩 10:00 AM — ISM Manufacturing (Sep)
⏰ 10:00 AM — Construction Spending (Aug)
⏰ TBA — Auto Sales (Sep)
Thu 10/2
⏰ 🚩 8:30 AM — Initial Jobless Claims (weekly)
⏰ 10:00 AM — Factory Orders (Aug)
Fri 10/3
⏰ 🚩 8:30 AM — Nonfarm Payrolls (Sep)
⏰ 🚩 8:30 AM — Unemployment Rate (Sep)
⏰ 🚩 8:30 AM — Average Hourly Earnings (Sep)
⏰ 10:00 AM — ISM Services (Sep)
⚠️ Disclaimer: Educational/informational only — not financial advice.
📌 #trading #stockmarket #SPY #SPX #NFP #ADP #Fed #Powell #jobs #unemployment #wages #housing #consumerconfidence #PMI #bonds #Dollar #megacaps
SPY trend Broken? Use this Long / Short StrategyLast week was a choppy sell off in the markets.
We did see the bulls defend price later into the week by bouncing the main indices very nicely.
We discuss the simple support / resistance where you should be watching.
Using the daily 7MA as resistance can be shorted however if we recapture and close above, then the markets remain a long to new highs.
The trend of higher lows is still in tact signaling bullish strength... can we search for a new higher high?

SPY pull back before rip!my theory from what it looks like we're in wave 2 getting ready for a wave 3 i anticipate a pull back to 657 possibly even testing my green trend line i have marked i will try longs around that area aiming for minimum 687

SpyNext week marks end of the quarter and the week after is a black out week with no earnings. Any pullback or major correction has that 2week window. Once new earning season kicks off you usually don't see a significant correction before tech earnings.
Here's the indexes and where we stand
Most indexes are at the top of that trendline resistance from 2010.
Here's TVC:DJI dow jones
Weekly
Daily
Rising wedge near the top here at 46,700
I don't think this breaks over 46,700 but it's only bearish back below 45,000!
AMEX:IWM
Weekly top near 247-250. Tagged it early last week
Daily
Still inside its summer uptrend.
235 support and 247 resistance.. I don't think this breaks back over 245 this week. I think channel support will get tag
. Below 233 and 225 comes
NASDAQ:QQQ
Market runs on tech
Weekly
Top of trend similar to Iwm
Daily
Price action up here at Weekly trend looks eerily similar to last year
AMEX:SPY
Weekly is a mirror to Iwm and Qqq
Daily
Wedged here at the top
I don't think Spy will Crack above 670 here...
May tag 666 again but it will all depend on Qqq.
Example, if Qqq pushes above 598 then it's most likely going back to 602 and with that move Spy will likely tag 666 again.
But if Qqq can't Crack back above 598 then flush we will for the next week or 2.
End of month and quarter rebalancing will give some selling but the bigger pullback will come with either government shutdown or monthly jobs report due out friday.
As you can see we are at long term resistance here on the indexes , the long is wrong here with out a 5-7% pullback.
Looking for a move to 630-640 in the next 2 weeks

Are We About To See A HUGE Change In The Market...Stock Market Forecast | QQQ SPY CME_MINI:NQ1! CME_MINI:ES1! SP:SPX NASDAQ:NDX
Mag 7 | TSLA NVDA AAPL AMZN META MSFT GOOGL

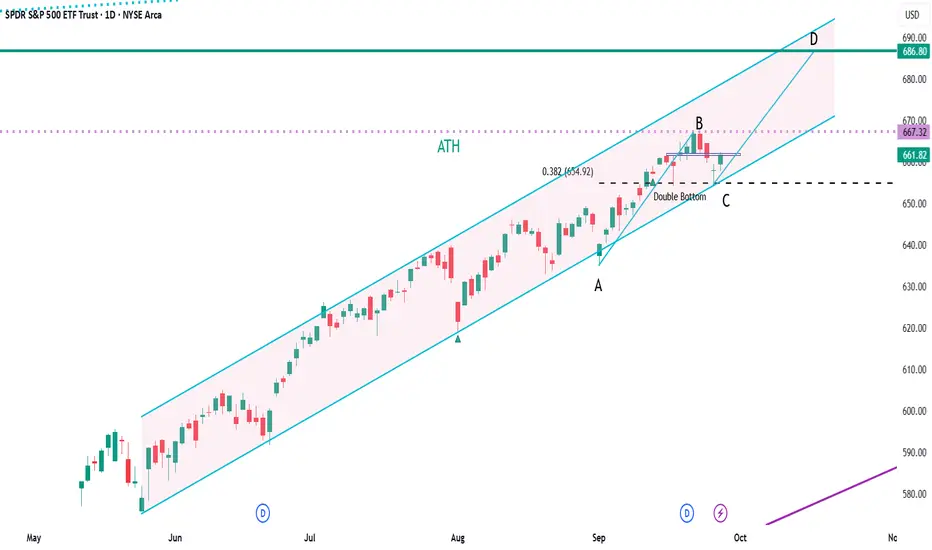
SPY Daily OutlookThe index continues to trade inside a well-defined rising channel. After setting a new ATH at point B, price retraced into a double bottom at C near the 654 support zone — aligning with the 0.328 retracement/last week's low. The rebound from that level keeps the bullish structure intact.
⚡ Key Levels to Watch:
Support: 654 (double bottom / fib confluence)
Resistance: 667–670 (prior high & channel midline)
Upside target: 685-690 (channel top / point D projection)
As long as 654 holds, the path of least resistance favors a move toward 690. A decisive break below 654, however, would signal weakness and open the door to deeper downside.
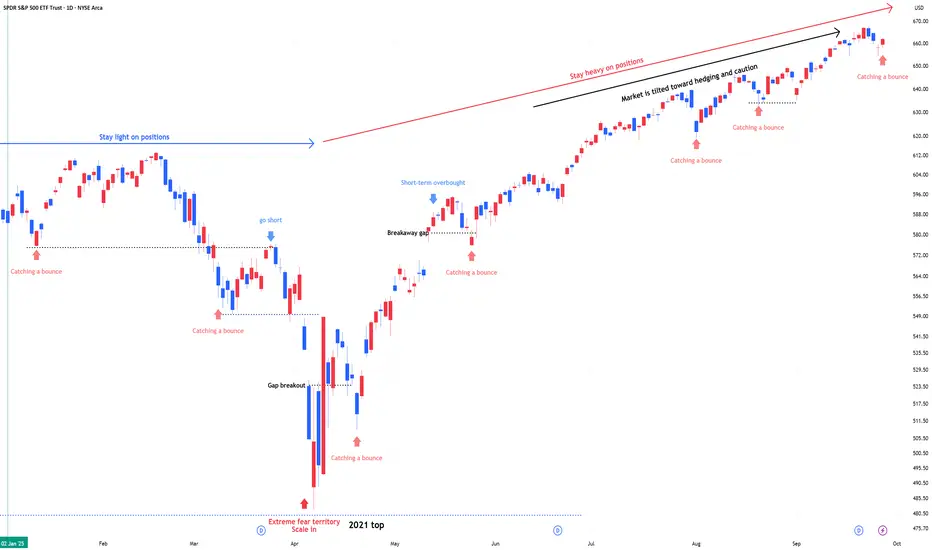
SPY : Stay heavy on positionsSPY : Stay heavy on positions (2x leverage)
Entering a risk-on, high-volatility zone.
A signal for catching a bounce has emerged.
In stay light on positions zones, I hold SPY(+QQQ) and reduce exposure.
In stay heavy on positions zones, I increase allocation using a mix of SSO(+QLD) and TQQQ.
** This analysis is based solely on the quantification of crowd psychology.
It does not incorporate price action, trading volume, or macroeconomic indicators.
SPY WEEKLY 26 SEP 2025 This is the price action analysis for SPY . I have clearly discussed the levels and have touched on psychology side as well. If you have any doubts, feel free to leave a message.
NOTE: DONT TRADE AS OPTIONS AS MARKET IS ALL TIME HIGH

SPY and VIX - what I'm watching forA break below yesterday's low is a likely sell on SPY. VIX also in heavy consolodation but has not broken out yet.

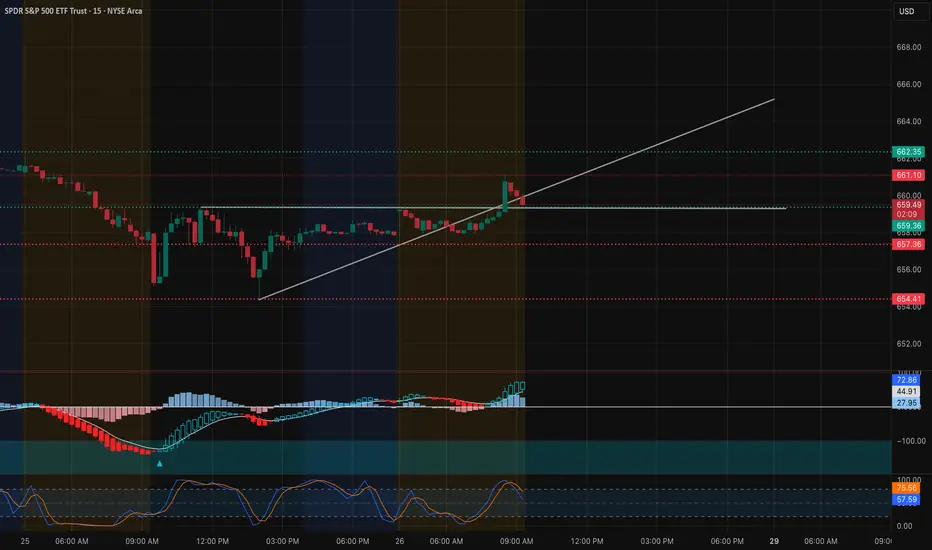
SPY Technical Analysis – Sep 26 Morning SetupSPY is opening the session with early upward pressure but still sitting in a bigger, mixed range. Here’s a structured read based on the two 15-minute charts you shared.
1. Price Action & Market Structure
* Trend bias: Pre-market push lifted price from ~657 to 662.3, breaking the overnight range and creating a small bullish structure break (CHoCH).
* Immediate reaction: After tagging ~662.3 the candle pulled back toward 659–660, so the move is being tested rather than cleanly extending.
* Key intraday pivot: 659.5–660 zone now acts as first key support. Holding here keeps the morning bullish idea alive; losing it invites a retest of the lower demand pocket at 656.5–657.
2. Supply & Demand / Order Flow
* Demand: 657–656.5 (HVL base and yesterday’s lower support).
* Supply: 661–662.3 (today’s pre-market high and first call resistance). Above that, next notable supply is near 664–665 where bigger call walls cluster.
3. Indicator Check
* 9 EMA / 21 EMA: Price is still above both, showing near-term momentum, but the recent red candle is testing the 9 EMA.
* MACD: Positive histogram and lines still crossed bullish, supporting continuation if support holds.
* Stochastic: Entering overbought territory; a short-term pause or retest is normal.
4. Options & GEX Context
* Call Walls / GEX:
* 1st call resistance: 661 (56% concentration)
* 2nd: 664 (36%)
* 3rd: 665 (49%)
* Put Walls / Support:
* 1st put wall: 656.5 (highest negative NET GEX)
* 2nd: 654 (stronger downside magnet if 656.5 breaks)
* Put/Call ratio: Puts ~62% vs Calls ~38%, still tilted bearish on a larger frame.
Interpretation: Near-term intraday gamma pressure favors a chop between ~657 and ~662 until one side gives way. A decisive 15-minute close over 662.3 could squeeze to 664-665.
5. Trading Scenarios
Bullish Path
* Entry idea: Bounce from 659.5–660 with volume reclaim.
* Targets: 662.3 then 664–665.
* Stop: Below 657.
Bearish Path
* Entry idea: Clean 15-min close under 659 with selling volume.
* Targets: 656.5 first, then 654.
* Stop: Above 661.
Scalpers can watch 1-minute retests at these pivots for confirmation.
6. Quick Take
SPY is trying to build a morning reversal off the 657 base, but gamma positioning and overnight resistance at 662.3 keep the upside capped until proven otherwise. Early risk-reward favors patience: wait for either a strong 15-minute close above 662.3 for a push toward 664-665, or a failure below 659 to ride a fade toward 656.5/654.
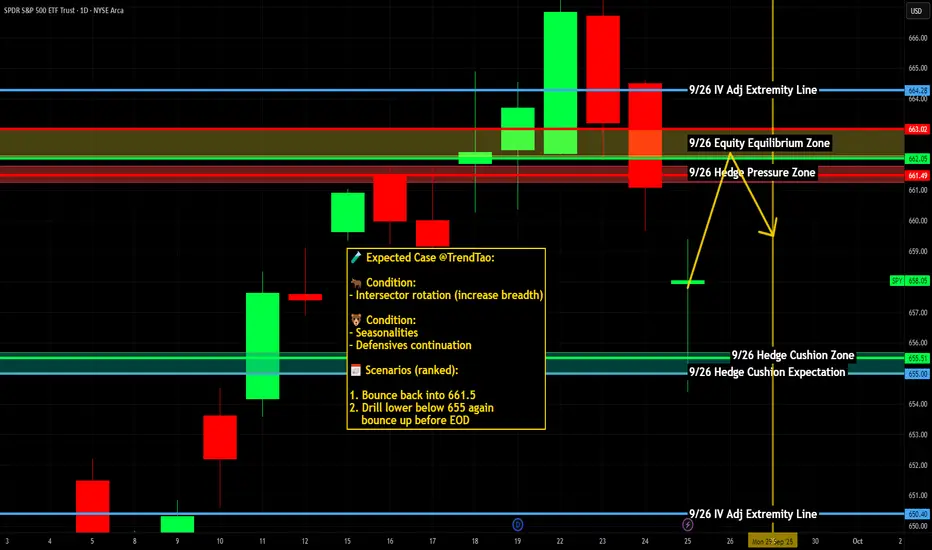
$SPY Tomorrow’s Trading Range 9.26.25
This is tomorrow’s trading range for SPY - Look at that Island gap in the upper part. What do you think? End of the rally?
Rates were cut, equities are overvalued and it’s time to reverse this beast. Just my opinion - trade the chart not my opinion.

Still AliveStill here, don't worry, will post an update soon on what I've been up to. But for now, we're at an inflection point, with ChatGPT saying we could see 655 and further 652 by Monday if markets react badly to PCE. Otherwise a nice healthy bounce to 662 and try for 667 -> 672 by next Friday. And we both peg Tuesday Sept 30th/Weds Oct 1st as up days, me with about 70% confidence.... ChatGPT with about 85%. *rolls eyes*

SPY SEP 25,2025 READ NOTESSpy can still hit $676 but as a trader my job is to understand the risk then put Stop loss & then trade.
So, I am long with stocks only:
SL @$653 with a target of $676.
The level is pretty average & most of the traders who learnt price action from me won't even call this a level. If you don't understand a level, then don't trade it(simple).
I initiated the long trade when I posted the chart in the morning.
If it hits my SL then il accept and move on. I am waiting for this week to close &will publish the video analysis tomorrow after market close.
NOTE: DO NOT TRADE OPTIONS

$SPY / $SPX Scenarios — Friday, Sept 26, 2025🔮 AMEX:SPY / SP:SPX Scenarios — Friday, Sept 26, 2025 🔮
🌍 Market-Moving Headlines
📉 Month-end flows: Positioning shuffle as traders square books into Q3-end.
💵 Fed lens: Multiple Fed appearances keep policy tone in focus post-SEP.
💻 Tech + growth watch: AMEX:XLK flows remain sensitive to yields + inflation gauges.
🛢️ Commodities check: Oil and dollar volatility continue to set cross-asset tone.
📊 Key Data & Events (ET)
⏰ 🚩 8:30 AM — Personal Income & Spending (Aug)
⏰ 🚩 8:30 AM — PCE Price Index (Aug) + Core PCE (YoY & MoM)
⏰ 10:00 AM — Consumer Sentiment (Final, Sep)
🗣️ Fed Speakers:
• 7:30 AM — Tom Barkin (Richmond Fed, TV appearance)
• 9:00 AM — Tom Barkin (speech)
• 1:00 PM — Michelle Bowman (Fed Vice Chair for Supervision)
⚠️ Disclaimer: Educational/informational only — not financial advice.
📌 #trading #stockmarket #SPY #SPX #PCE #inflation #Fed #Powell #joblessclaims #consumer #Dollar #bonds #megacaps
$SPY - Important Point To Watch Watching the S&P here closely. Catalyst-heavy window ahead with two more FOMC decisions (Oct 28–29 and Dec 9–10) sandwich Q3 earnings (banks kick off mid-Oct mega-cap tech late Oct/early Nov). These can drive volatility and directional breaks.

SPY - The Sell Signal that is ALWAYS a BuyOnce again, the Parabolic indicator triggers sell. Probably the most useless indicator on the planet for the S&P. ANy little dip is quickly bought up. Why is now any different?
SPY Pre-Market Trade Plan (Bearish Bias) 9/25Been receiving lots of positive feedback on pre-market trade plans so here is another one for 9/25. Trade Idea with a bearish central thesis. Invalidates if we break and close above to purple box (stop).

SPY CORRECTION SOON?Technical Outlook:
- Head and Shoulders (forming)
- Overbought RSI (above 70)
- Signaling Bearish Divergence
Fundamental Outlook:
Economic weakness looms as rising inflation meets sluggish growth, fueling stagflation fears. With markets on edge, a spooky September sell-off could be triggered by tightening conditions and fading investor confidence.

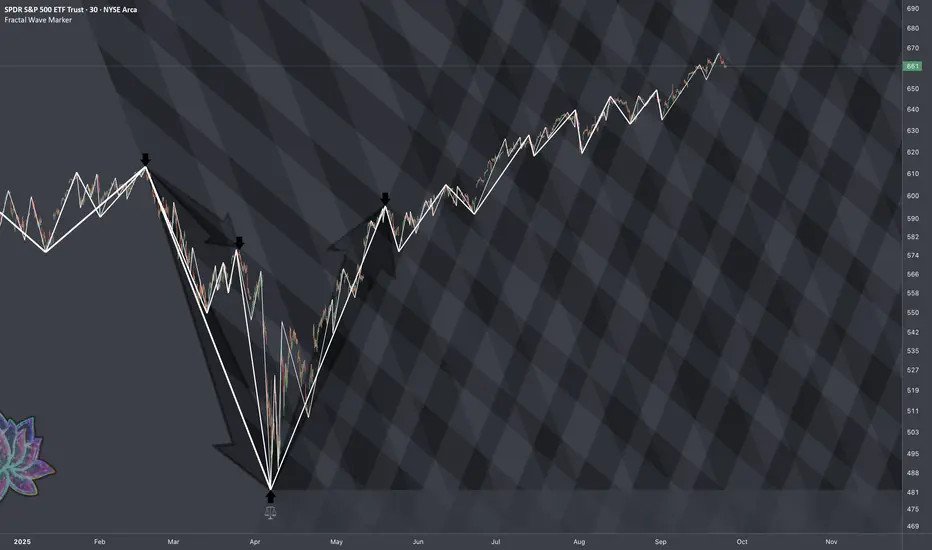
$SPY: Systematic Behavior 3 Frames of Reference:
An angle from the top (beginning of decline) to a point of resistance where the price got further dumped to form a bottom. This emphasizes some boundary that needs to be broken in order to proceed to transition phase.
Also would be nice to have the angle of entire tariff crash so the fib spacings could reflect the shockwaves of that event.
For the 3rd ( as 3rd axis in geodesics ), we would cover what immediately grew after crash establishing a common angle.
In cases 2 and 3, the common criterion for choosing the angle was that in both cases the nested cycles on smaller scale were completed confirming the measured angle. Watching for consistency in shapes is essential for capturing the interplay of multiple forces.