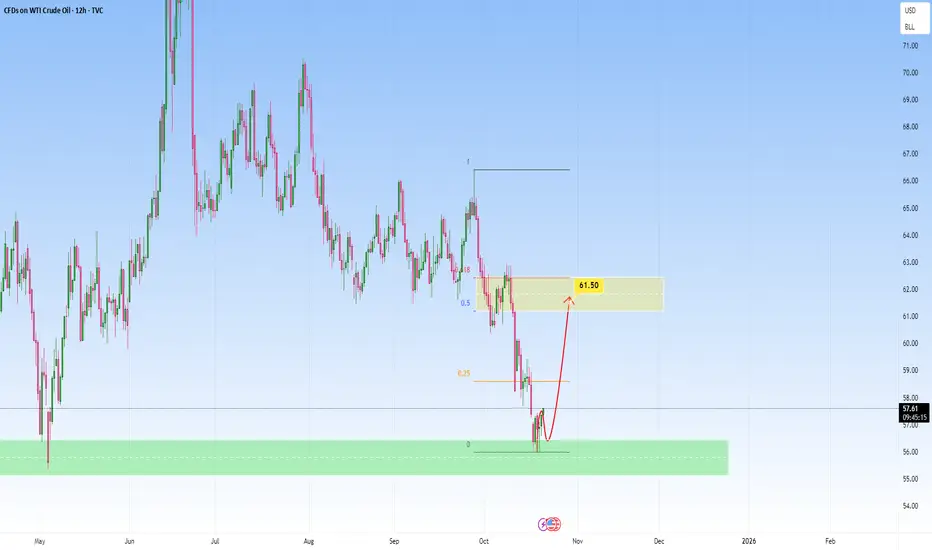
Oil: Key Fibonacci Zone to watch forPrice has been in a clear downtrend, with sellers firmly in control, driving a series of lower lows and lower highs. However, after a strong bearish leg, momentum began to slow, candles started showing long wicks and smaller bodies, signaling that selling pressure might be fading.
If price continue
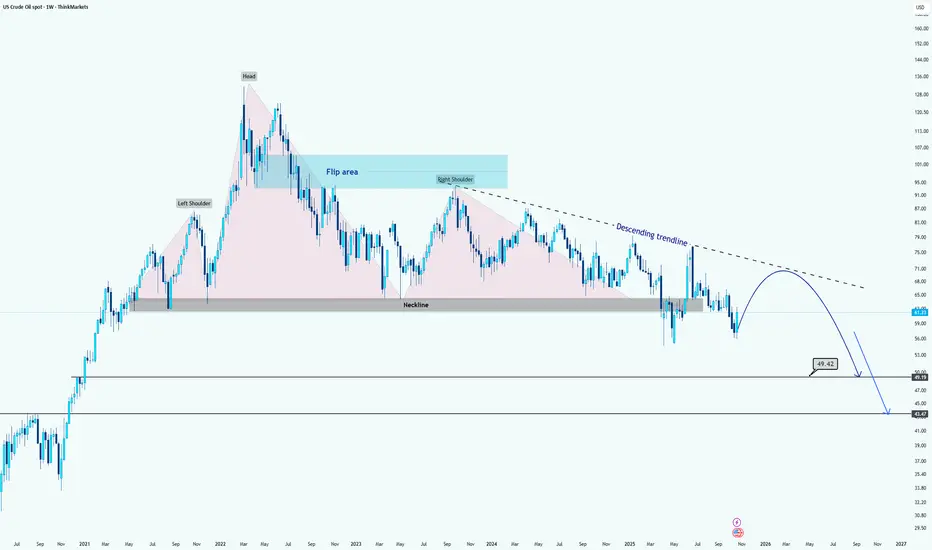
WTI Crude Oil Forms Major Head and Shoulders BreakdownHi guys.
WTI has formed a massive Head and Shoulders pattern on the weekly timeframe, signaling a potential long-term bearish reversal structure.
After the right shoulder completed, price decisively broke below the neckline around the $67–$70 range, confirming the pattern breakdown. This neckline
Hellena | Oil (4H): SHORT to support area of 54.00.As I continued to watch oil I realized that the structure I built in the last forecast is still in place. I think we should expect a correction in wave “4” to the 59.3 area, then a continuation of the downward movement at least to the 54.00 support area. This will be the completion of the downward i

Can WTI’s 8% Rally Hold After Trump-Putin Summit Collapse?WTI just staged its biggest two-day rally since June, as hopes for a Trump-Putin summit were dashed, leading to new US sanctions on Russian oil exports.
Here’s what’s fuelling the move and what traders should watch next:
- US sanctions on Russia’s top oil producers after failed Budapest summit tr

WTI OIL Strong long-term rebound incoming.Over a month ago (September 17, see chart below), we gave a strong Sell Signal on WTI Oil (USOIL) as the price was again rejected on its 1W MA50 (blue trend-line) and was headed towards the inner Higher Lows trend-line, easily hitting our $59.50 Target in the process:
Yet again we consult the m

Bearish reversal off major resistance?WTI Oil (XTI/USD) is rising towards the pivot, which is an overlap resistance and could reverse to the 1st support.
Pivot: 62.10
1st Support: 58.37
1st Resistance: 64.66
Disclaimer:
The above opinions given constitute general market commentary, and do not constitute the opinion or advice of IC M

USOIL: Bears Are Winning! Short!
My dear friends,
Today we will analyse USOIL together☺️
The in-trend continuation seems likely as the current long-term trend appears to be strong, and price is holding below a key level of 61.394 So a bearish continuation seems plausible, targeting the next low. We should enter on confirmati

USOIL Crudeoil bullish forecast down trend breakdout🚨 USOIL (Crude Oil) Technical Update 🚨
🕒 Timeframe: 1H
📉 After a clear downtrend breakout, price has shown a strong bullish consolidation breakout from the key support zone at $60.700.
🔥 Momentum is shifting bullish, signaling potential continuation to the upside.
🎯 Technical Targets:
$61.300

USOIL Can Rise Higher (Swing Trade Opportunity)USOIL Can Rise Higher (Swing Trade Opportunity): OIL has been falling hard in the recent weeks. One of the reasons was the sub sector rotation. Most funds were being routed from energy to precious metals. Now OIL has completed and M pattern, which means that it can start to rise. So far this has sho

Today's crude oil trading strategyDon't be intimidated by "mid-term supply pressure", as the risks are manageable when going long.
1. Geopolitical Conflicts "Keep Adding Fuel" – Supply Worries Persist
The U.S. has just escalated sanctions on Russia and imposed restrictions on Venezuela’s crude oil exports, which directly cuts off

See all ideas
Displays a symbol's price movements over previous years to identify recurring trends.