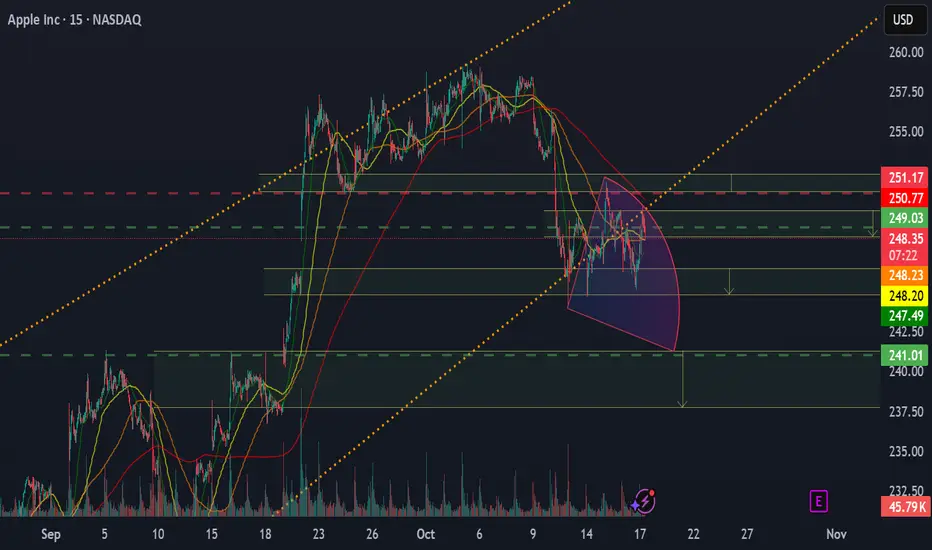
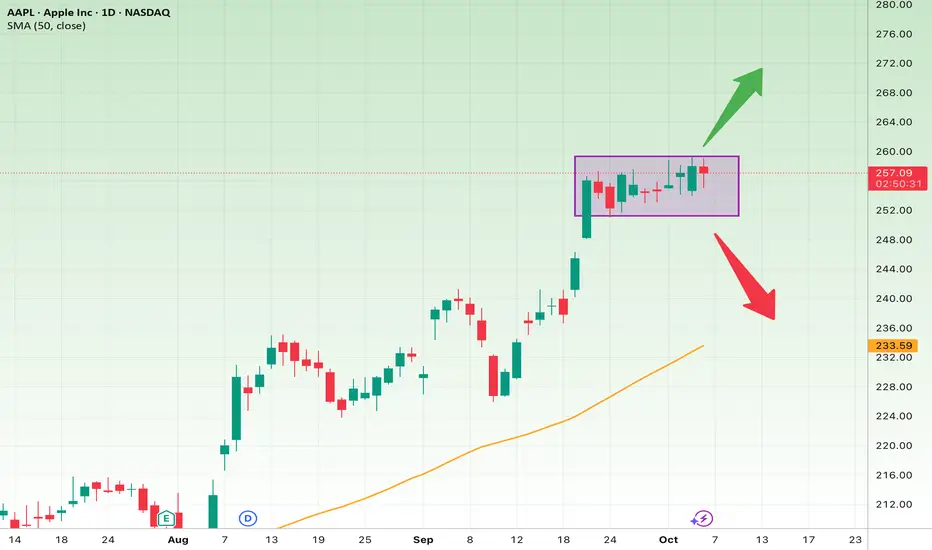
Apple short ideaApple looks overextended after the recent rally, showing signs of exhaustion near resistance. Price momentum is slowing, and volume confirms reduced buying pressure. I expect a short term correction as the market takes profits and sentiment cools down.
I am opening a short position with a target at 241. After that, I’ll review the situation and reassess the direction, but it’s very likely that we’ll correct deeper.
A break below the recent local lows could accelerate the move toward that level.
⚠️ Not financial advice.
Trade ideas
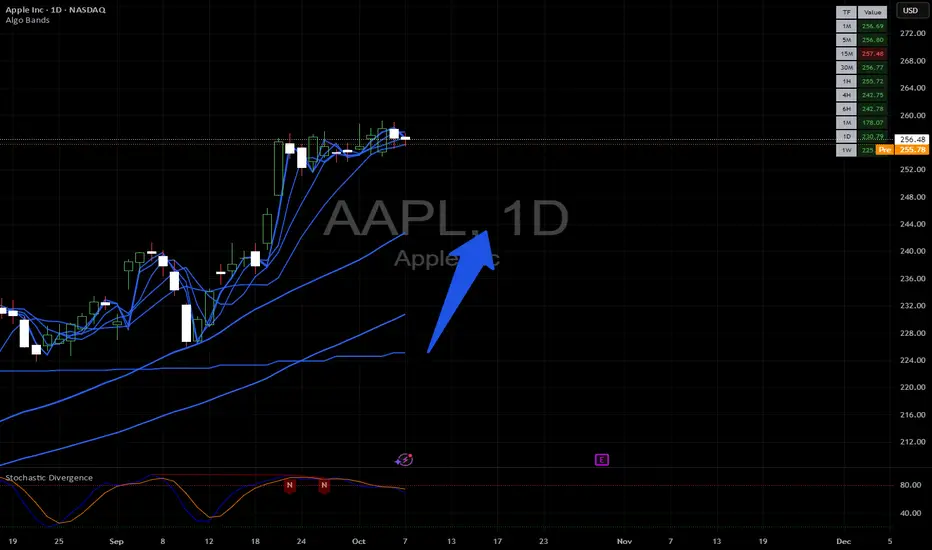
$AAPL Buy levelUnlike NASDAQ:META , NASDAQ:AAPL is strong. If, however, NASDAQ:AAPL starts to come down, $225 offer a good level to go long off. $225 is also a level to sell puts against.
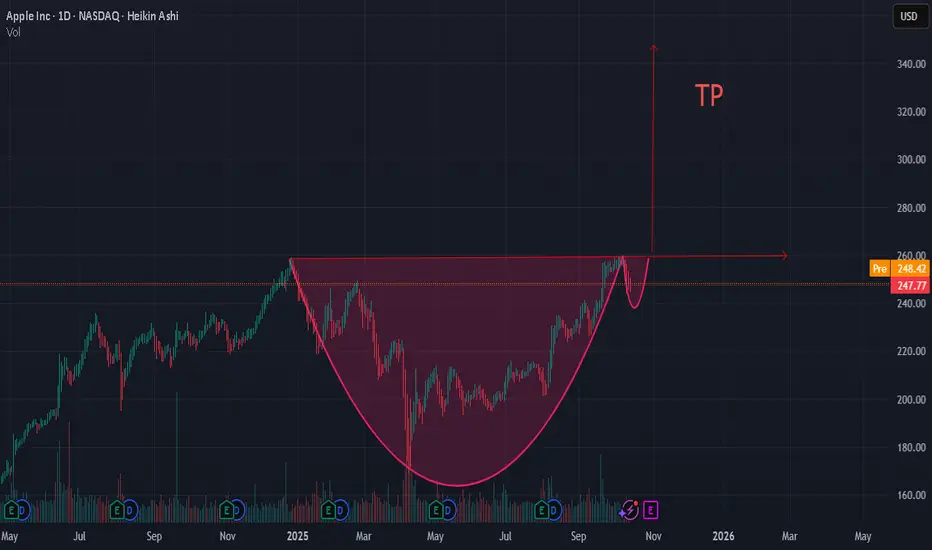
CUP AND HANDLE ON AAPL TP 340 LONGApple moves in a 10-15% range for years!
With lowering interest rates, and with quite low P/E ratio (32), compared to other companies in this industry, a new wave can begin!
AAPL (Apple Inc.) on a 4-hour timeframe.AAPL (Apple Inc.) on a 4-hour timeframe.
Here’s what the chart shows:
The current price is around $247.80.
There is an uptrend line supporting the price.
Two target levels are marked on the chart with arrows pointing upward.
The Ichimoku cloud shows bullish momentum (price above the cloud).
📈 Marked Target Levels on Chart:
1. First Target: Around $256
2. Second Target: Around $268
📝 Analysis Context (from the chart)
The trend is bullish, supported by higher highs and higher lows.
Price is riding the trendline, and the cloud provides support.
First target seems to be a short-term breakout level, second is more medium-term.
⚠ Important Note:
These are technical analysis targets, not guaranteed future prices. Real market movement can differ due to macroeconomic news, earnings, or broader market sentiment.

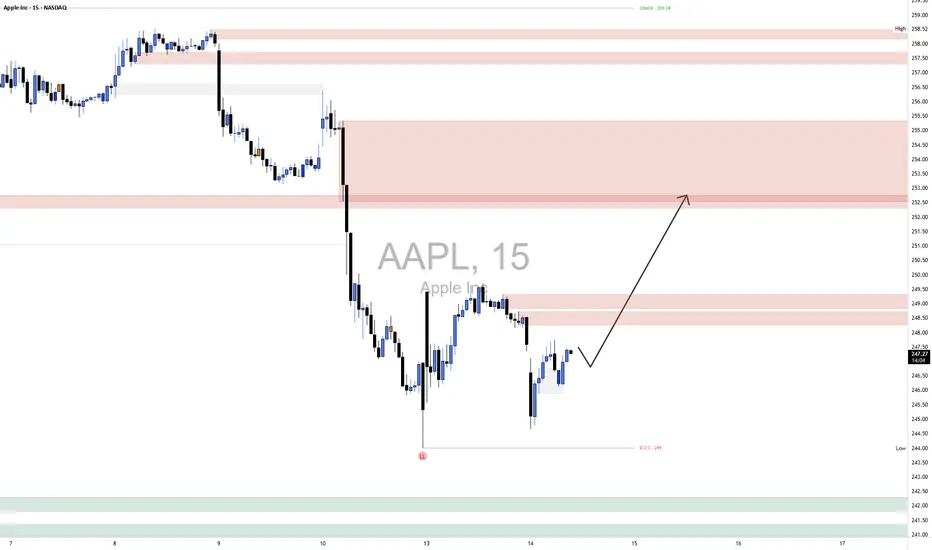
AAPL LongMarket Structure:
Apple remains in a short-term downtrend, following a clear Break of Structure (BOS) to the downside around $244, confirming bearish continuation from the prior lower high near $254. However, the recent candle formation suggests a possible Change of Character (CHoCH) as price begins to stall and form higher lows around the $246–$247 area, indicating early signs of accumulation.
Supply & Demand Zones:
The demand zone between $244 and $246 has shown a decent reaction—buyers stepped in with strength after a deep sweep of lows, suggesting that liquidity has likely been collected from resting stops below $245. The nearest supply zone lies between $248.5 and $249.5, where price previously dropped sharply, confirming the presence of aggressive sellers. The larger, more significant supply region sits higher between $252.5 and $254, the origin of the recent impulsive drop, making it a strong area for potential short setups if price reaches it.
Current Price Action:
Price is consolidating just above local demand, with small-bodied candles showing indecision but higher lows forming. The market appears to be preparing for a retracement move back into the $248–$253 range. The arrow path on your chart suggests a likely bullish correction toward the upper supply before sellers potentially re-enter.
Bias & Outlook:
The short-term bias is bullish, expecting a retracement toward $252–$253 before potential rejection. The key invalidation level for this scenario is below $244—a clean break beneath that would confirm bearish continuation and invalidate the recovery structure.
Momentum & Candle Behavior:
Momentum is neutral-to-slightly bullish, with shorter wicks on the downside and volume compressing near demand, indicating seller exhaustion. A bullish engulfing or strong breakout candle above $248 would confirm short-term momentum shift.
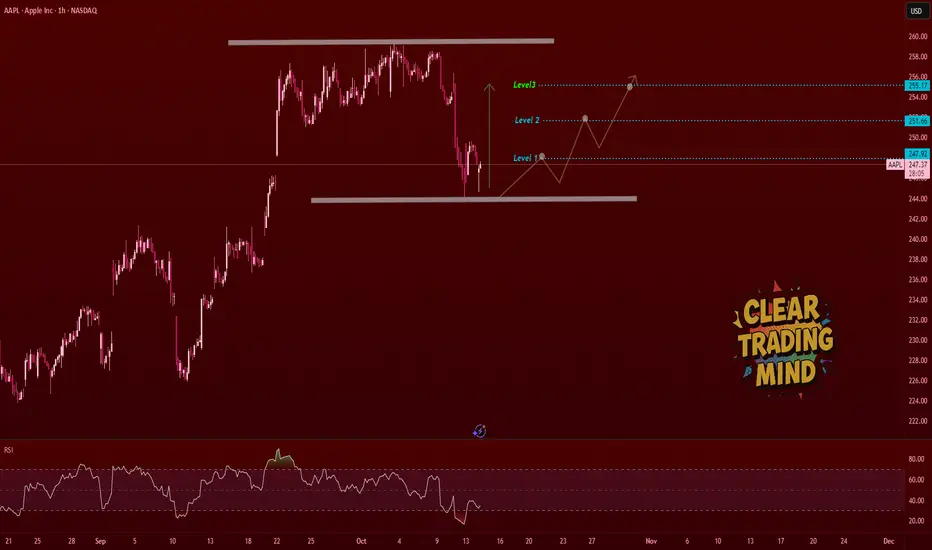
AAPL Bullish Outlook – Level-by-Level Breakout PlayApple is showing a potential bottom structure after rejecting the demand zone at the lower range.
Price bounced from the base and looks ready for a step-by-step move upward.
🔍 My Bullish Plan (1H Chart):
- As long as price holds the bottom range, I expect a recovery move.
- Watching price break each resistance step clearly:
🟢 Level 1 → 247.92
🟢 Level 2 → 251.66
🟢 Level 3 → 255.17
Once Level 1 breaks with strong momentum, I will look for intraday HL (higher low) or consolidation for continuation.
This zone looks good for scaling into bullish structure .
💡 Support Zone:
Marked demand base around 244.50 – strong previous reaction area.
⚠️ Invalidation:
If price fails to hold the demand zone and closes below the base, I’ll cancel the bullish bias.
🧠 Outlook Summary:
- RSI showing slight divergence hinting reversal strength
- Price at range low
- Multiple clean upside levels to work with
- Patience for breakout confirmation = key
Mean Reversion Setup: AAPL1. RSI in oversold region
2. Price likely to rebound back the the mean
Trade Rules:
Entry Trigger - RSI has cross below oversold region, enter limit buy at close price
Exit Trigger - Close at market when close price cross above exit trigger (Red Line)

AAPL Gap FillLooks like they got their gap fill after all... could push through ath now.
Also someone just bought $334.5 million in shares today
Will Apple’s Q4 Growth Send Shares Above $260? Current Price: $245.27
Direction: LONG
Targets:
- T1 = $252.00
- T2 = $260.00
Stop Levels:
- S1 = $240.00
- S2 = $235.00
**Wisdom of Professional Traders:**
This analysis synthesizes insights from countless professional traders and market experts, leveraging collective intelligence to identify high-probability trade setups for Apple. The wisdom of crowds suggests that aggregated perspectives from seasoned investors tend to yield more accurate predictions by reducing cognitive biases and uncovering consensus opportunities. Apple remains a favored investment among traders, with its strong fundamentals, consistent performance, and robust demand for its hardware ecosystem and services driving positive sentiment.
**Key Insights:**
Apple has consistently demonstrated remarkable revenue performance, even amid global challenges such as inflationary pressures and muted consumer sentiment. The company’s diversified product mix, including iPhones, Macs, wearables, and services, shields it from reliance on a single growth stream. The upcoming holiday season is likely to boost iPhone sales, particularly the higher-margin Pro and Max models introduced during the September 2025 event. Additionally, Apple’s services revenue, which encompasses subscription-based offerings like Apple Music, iCloud, and Apple TV+, continues to grow at an impressive pace, contributing significantly to profitability.
The company’s strong brand loyalty and pricing power uniquely position it as a premium player in the consumer electronics market. Moreover, signs of expanding gross margins in Q3 2025, driven by efficiencies in supply chain management and product mix optimization, enhance its outlook heading into Q4. With Apple thriving in the premium consumer segment globally, traders are eyeing further upside in its stock, fueled by strong fundamentals and seasonal tailwinds.
**Recent Performance:**
Apple’s share price has climbed steadily from the $230 mark in early September 2025, propelled by optimism surrounding its latest iPhone lineup and services growth. October has seen subdued volatility yet consistent buying pressure, lifting the stock to $245.27. Analysts have noted Apple’s resilience, as the broader market grapples with inflation concerns and interest rate hikes. With the company delivering a solid Q3 2025 earnings beat, traders have been increasingly confident about its prospects during the last quarter of the fiscal year.
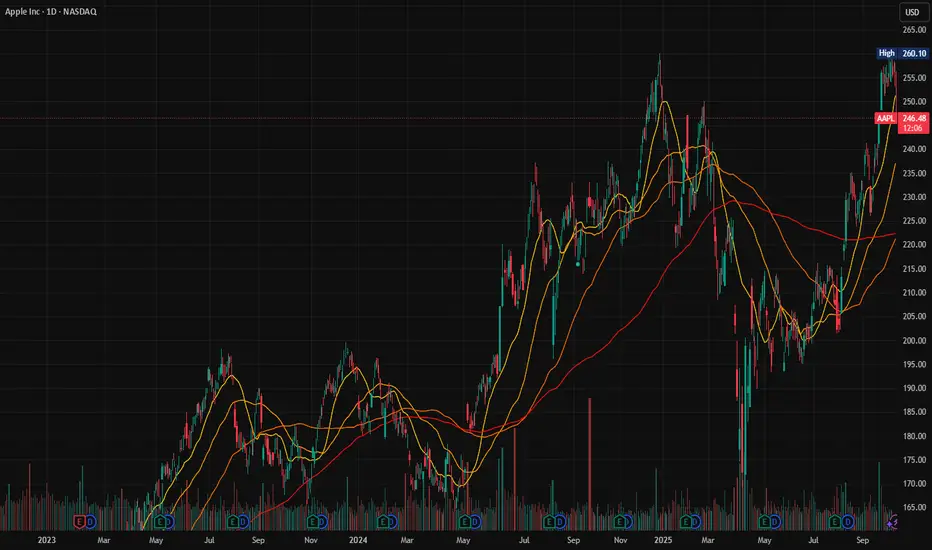
**Expert Analysis:**
Technical indicators reveal bullish momentum for Apple. The stock is trading above its 50-day and 200-day moving averages, signaling strong upward momentum. Furthermore, a Golden Cross pattern emerged recently, confirming the positive trajectory. The Relative Strength Index (RSI) suggests the stock is not yet overbought, leaving room for further gains. Volume trends indicate a growing interest from institutional investors, while option activity shows bullish positioning heading into Q4 2025.
Fundamentally, Apple benefits from an expanding margin profile and record-breaking iPhone pre-orders, particularly for premium models. Experts believe macro conditions, like stabilizing interest rates, may boost consumer activity during the holiday season, aiding Apple's Q4 sales. Several analysts have reaffirmed their price targets, ranging between $260 and $280, citing continued strength across both hardware and services divisions.
**News Impact:**
Recent headlines surrounding Apple have been predominantly positive, focusing on strong demand for its newest iPhone lineup and expanding its ecosystem through innovative features like satellite connectivity and AI-enhanced camera technology. Additionally, Apple’s performance in the services business remains a key growth driver, with reports showing an uptick in paid subscriptions across multiple platforms. Q3 earnings revealed both gross and net margin expansion, signaling efficiency gains. The company’s ability to deliver consistent growth, even in challenging economic conditions, reinforces bullish sentiment heading into 2025’s final quarter.
**Trading Recommendation:**
Take a long position on Apple, targeting upside moves to $252 and $260 over the upcoming weeks. Seasonal demand trends coupled with bullish technical indicators provide a foundation for continued gains. Apple’s strong fundamentals and brand resilience make it a solid investment as the holiday spending season ramps up and the company further capitalizes on its services revenue growth. Protect downside risk with stops at $240 and $235, ensuring prudent risk management.
Do you want to save hours every week? Register for the free weekly update in your language!

A New iPhone Is Coming. Should You Upgrade or Just Fix Your Old This year, your best iPhone upgrade might be a fresh battery, a clean screen and some new software tricks. Plus, the extra cash you get to keep in your pocket.
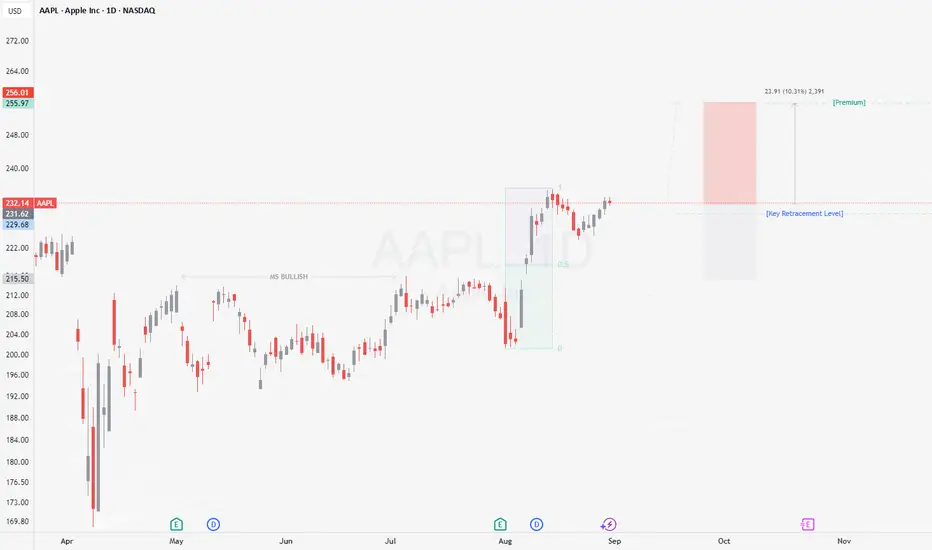
Is Apple still a buy?If we take a closer look, we can see that we could still enter around the $240–245 range and take profits at around $260. From a fundamental perspective, the numbers also look solid for the coming quarters. Although the fair value is estimated to be around $230 per share, we have to keep in mind that we’re talking about Apple — a company with high liquidity and strong cash flow.
Therefore, a difference of around +$15 (at $245) is not a major concern. The recent drop was mainly caused by the announcement of new tariffs, which pushed the price down artificially. We expect the stock to reach around $260 within the next two weeks. There is also strong support in the lower box area.

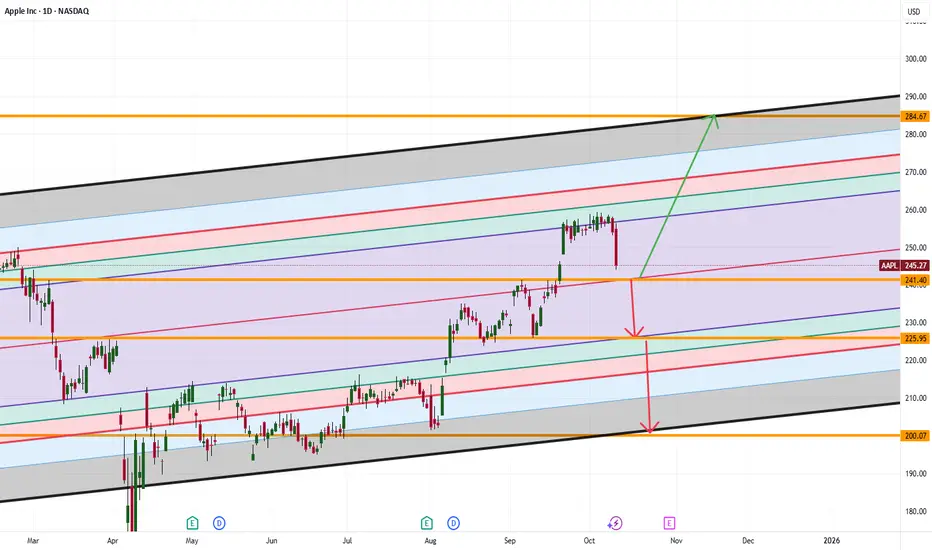
Apple’s $241 Bounce or Breakdown: Is This the Next Big Move?Apple’s stock price is moving down toward $241. This is an important zone. If Apple can stay above $241, it could jump up to $284. But if it falls below $241, the price might drop even more; maybe to $225 or even $200.
What do you think will happen next? Would you buy Apple if it drops to $241, or would you wait for a bigger move?
If you’re not sure what to do or have questions, ask me! Sometimes asking the right question gives you the answer you need to trade smarter. What’s your question about Apple right now?
Mindbloome Exchange
Trade Smarter Live Better
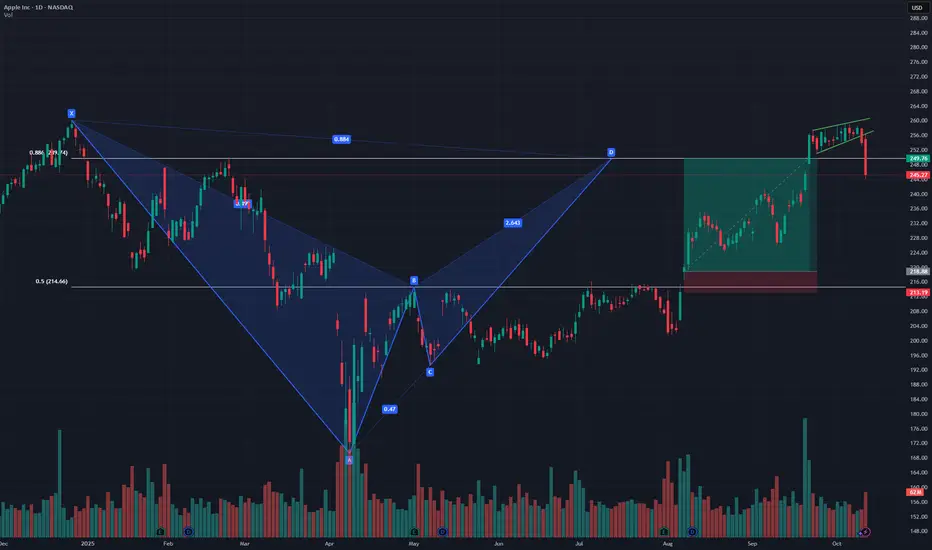
$AAPL bearish crabNASDAQ:AAPL reached target (0.886 Fib level) consolidated near all time highs then broke down. will wait for further discount.
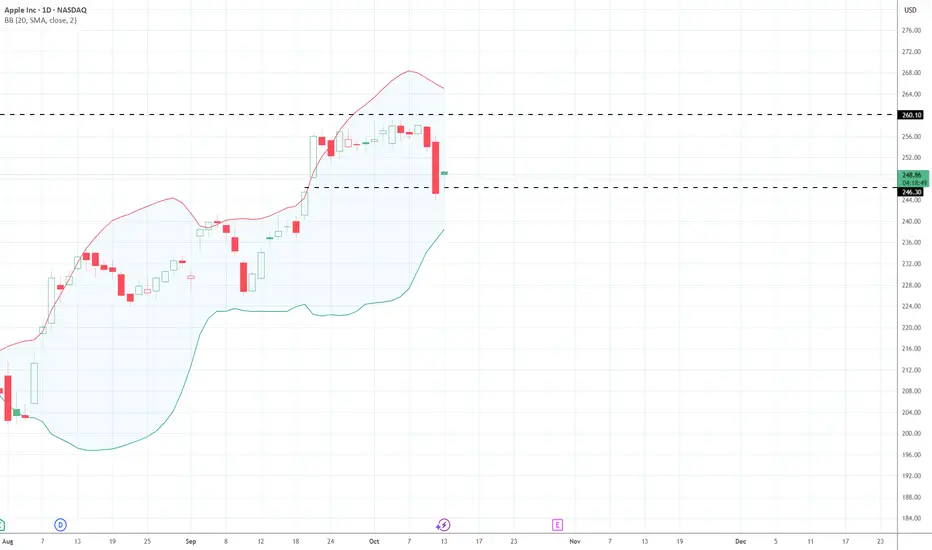
Daily BB reached, expect some flagging A quick one before the close. The Daily BB has been reached, so I expect a pause here. If we do drop over the weekend, this area should get tested before we drop further.
AAPL is hinting at a possible ABC on the weekly chart.

$AAPL Call Alert – Oct 31 ’25 $250 Calls | 119% ROI PotentialEnter: NASDAQ:AAPL OCT 31 2025 $250 CALLS
Buy in Price: $6.27 - $6.35
Take Profit: $13.73
Stop Bleeding: $5.52
ROI Potential: 119%
Exit Within: 354 Minutes
Hello trader, for tomorrow, AAPL: 254.04 10/10/25One thing we should keep in mind is the stock's location. We could have a quick first bullish entry above 254.00/252.00 up to 258.00. It depends on where it is in the pre-market. If it is near the 258.00 pre-market zone, it could encounter rejection. We only enter bullish above 260.00/262.00.
Our bearish entry should be below 250.00/248.00. Stops should be above the VWAP if it is bearish, or below it if it is bullish.

Apple $AAPL - SELL | Orbis InvestmentApple NASDAQ:AAPL - SELL | Orbis Investment
Entry: 258.21
TP: 227.11
SL: 267.22
RR: 3.45
#Apple #AAPL #NASDAQ #Stocks #Equities #TradingView #AnálisisTécnico #StockMarket #Investments #Trading #OrbisInvestment

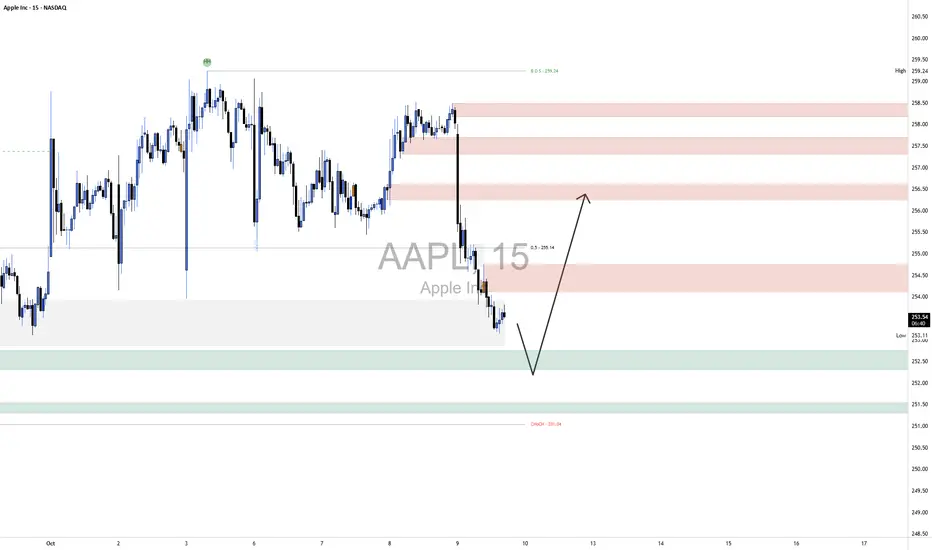
AAPL LongThe broader market structure shows that AAPL recently transitioned from a bullish leg to a clear short-term bearish phase after a strong Break of Structure (BOS) at 259.24, which confirmed a shift in control from buyers to sellers. Price failed to make a new high after the last rally, and the subsequent drop formed a decisive lower low, reinforcing bearish intent. The Change of Character (CHoCH) sits lower at 251.04, and if price were to breach that level, it would signal deeper downside continuation and confirm that higher-timeframe buyers have lost momentum.
The supply zones between 254.5–258.5 show layered resistance, where price previously dropped sharply, suggesting aggressive selling pressure from institutional participants. These zones remain strong as price has not yet retested them after the initial rejection. The demand area around 252–251 is the most immediate zone of interest, as it was the origin of the last bullish impulse that temporarily interrupted the down move—buyers stepped in with some strength there, though the overall context still favors sellers. A deeper secondary demand around 250–249 aligns with the CHoCH, representing the last structural defense before a full breakdown.
Currently, price action within the marked region shows a corrective pullback after a strong impulsive decline. Price is hovering just above the 252 demand zone, and momentum is beginning to slow—suggesting short-term exhaustion from sellers. The most probable scenario is a small sweep into the 251.5–252 range to tap liquidity before a relief rally back toward 255–256, where the first supply zone awaits. If that rally occurs and fails to reclaim above 256.5, sellers are likely to re-enter and drive price back toward 251.
The trade bias for now is short-term bullish (counter-trend), expecting a corrective move upward, but within a larger bearish structure. The key invalidation for any bullish scenario would be a clean break below 250.90, which would confirm continuation to the downside.
Momentum currently favors sellers overall, but short-term candles are showing smaller bodies and lower wicks—signs of absorption from buyers around demand.
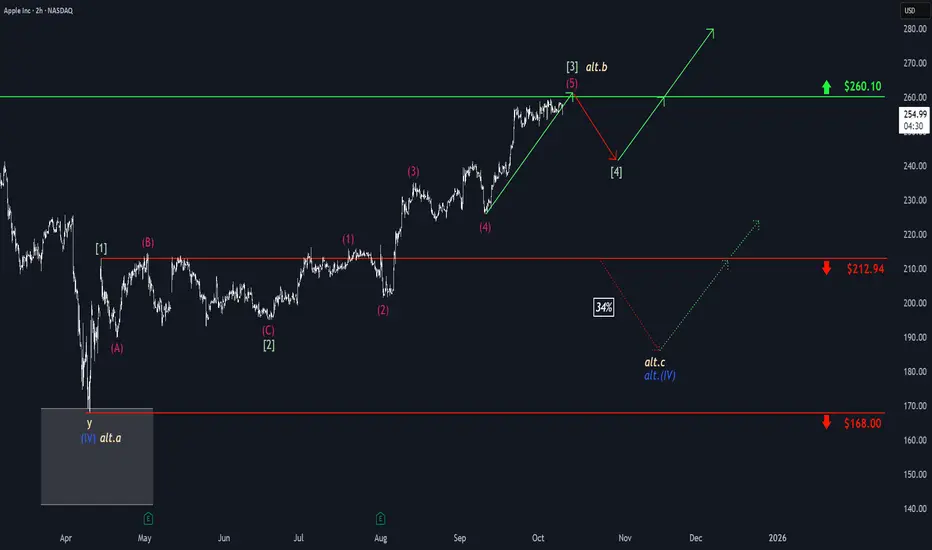
Apple: Rally Has a Bit More Room to RunApple’s upward momentum has clearly slowed at the $260.10 resistance level, though the stock has already come very close to this mark. As a result, we’re allowing for a bit more room for green wave to run in the near term, with the possibility that AAPL could slightly surpass the $260.10 level. However, a sustained breakout above this resistance is likely only after a pullback in wave . At the same time, there remains a 34% probability that the next peak will mark the end (or has already marked the end) of the corrective upward move in the beige wave alt.b . In this case, we would expect significant sell-offs, with a new corrective low for blue wave alt.(IV) forming between the two support levels at $212.94 and $168.
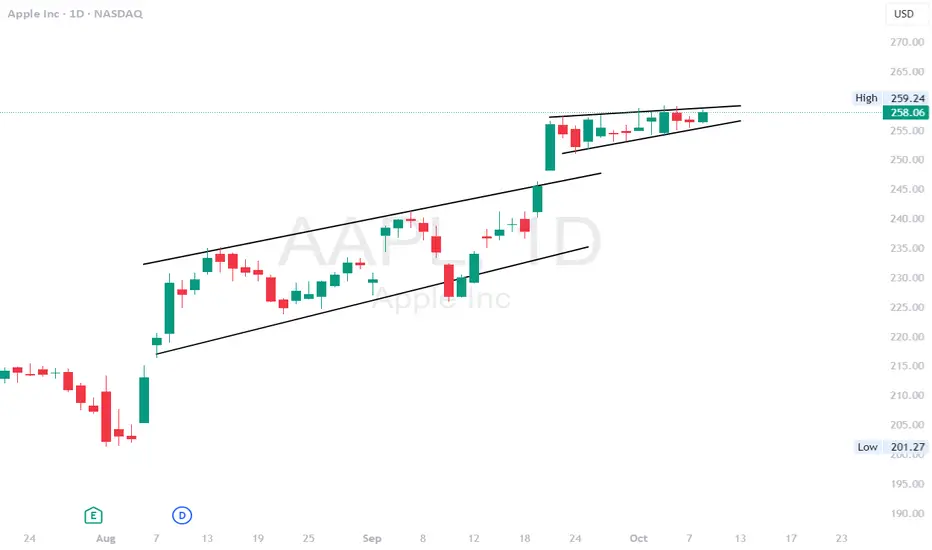
$AAPL - getting tighter in channel. Breakout incomingAAPL - Stock getting tighter here in the channel. possible breakout coming in soon. high watch here. Calls above $260 looking good for a breakout. above $260 we can see $275 and higher. Stock is decent at the indicator level.
How Shipping, Freight, and Logistics Power Global Market Trading🌍 Introduction: The Invisible Engine Behind Global Trade
Every product that moves across borders — from a smartphone in New York to coffee beans in Paris — owes its journey to the vast and intricate world of shipping, freight, and logistics. These three elements form the invisible yet powerful engine that keeps the global market trading ecosystem running.
Behind every trade agreement, export figure, and import bill, lies a network of ships, trucks, planes, and warehouses. Without this system, the flow of goods would come to a standstill, crippling international economies. As globalization deepens, logistics isn’t just about moving products — it’s about synchronizing global supply chains, optimizing cost efficiency, and maintaining the balance of trade across continents.
In today’s dynamic market, logistics has evolved into a strategic weapon. Countries with superior shipping infrastructure and efficient freight management command a strong position in global trade. Let’s explore how these sectors intertwine to shape the global market’s future.
⚙️ 1. Understanding the Triad: Shipping, Freight, and Logistics
Before diving deeper, it’s essential to distinguish between these three interconnected terms:
Shipping: Refers to the actual physical transportation of goods from one location to another — typically over sea or air.
Freight: Represents the cargo itself or the cost of transporting it. Freight can move via air, land, or sea.
Logistics: A broader term encompassing the entire process — from procurement and storage to shipment, tracking, and delivery.
Together, they form a supply chain ecosystem that connects producers, suppliers, distributors, and consumers across continents.
🚢 2. The Backbone of Global Trade: Maritime Shipping
The shipping industry handles over 80% of global trade by volume. Massive container ships, each capable of carrying over 20,000 TEUs (Twenty-foot Equivalent Units), connect major trade hubs like Shanghai, Rotterdam, Dubai, and Los Angeles.
Why Shipping Dominates:
Cost Efficiency: Sea transport remains the most economical for bulk goods.
Scalability: Ships can carry massive loads, making them ideal for global trade.
Connectivity: Ports link multiple continents through trade routes like the Suez Canal, Panama Canal, and the Strait of Malacca.
Key Global Shipping Hubs:
Singapore: Known for its ultra-modern port infrastructure and strategic location.
China (Shanghai & Ningbo): The heart of global manufacturing and export.
Rotterdam (Netherlands): Europe’s largest port and logistics gateway.
Dubai (Jebel Ali): The Middle East’s most significant trade link.
Challenges in Modern Shipping:
Port Congestion: Especially during global disruptions like COVID-19.
Rising Fuel Costs: Impacting freight rates worldwide.
Environmental Regulations: The shift toward green shipping (LNG, electric, hydrogen-powered vessels).
✈️ 3. Freight Networks: The Arteries of the Global Market
Freight is the lifeblood of commerce. It moves raw materials to factories, finished products to retailers, and food to consumers. The freight sector spans multiple modes:
a) Sea Freight
Still the most widely used due to lower costs. However, it’s slower, making it less suitable for time-sensitive cargo.
b) Air Freight
Used for high-value, urgent, or perishable goods — electronics, pharmaceuticals, and luxury items.
Example: A smartphone assembled in China reaches the U.S. in under 48 hours via air freight.
c) Land Freight (Trucking & Rail)
Essential for last-mile connectivity and regional trade.
Rail Freight: Gaining importance through transcontinental networks like China-Europe Railway Express.
Truck Freight: Vital for connecting ports, airports, and inland destinations.
Freight Pricing Dynamics
Freight rates are influenced by:
Fuel prices (bunker fuel, aviation fuel)
Port handling charges
Supply-demand imbalances
Geopolitical tensions (e.g., Red Sea or Black Sea blockages)
Global crises (pandemics, wars, etc.)
For instance, during the 2021–22 period, container freight rates between Asia and the U.S. soared by over 300%, revealing how fragile and demand-sensitive freight economics are.
🏗️ 4. Logistics: The Brain of the Operation
If shipping is the muscle and freight is the blood, logistics is the brain coordinating every movement.
Modern logistics involves:
Supply chain planning
Inventory management
Warehousing and distribution
Real-time tracking systems
Customs and documentation handling
The Digital Transformation of Logistics
The logistics industry is undergoing a technological revolution:
IoT sensors track container temperature and location.
AI algorithms optimize routes and predict disruptions.
Blockchain ensures transparency and authenticity in transactions.
Drones and robotics accelerate warehouse operations.
Major Global Logistics Players
DHL (Germany) – Known for integrated logistics and global air freight.
Maersk Logistics (Denmark) – Evolved from a shipping company to an end-to-end logistics leader.
FedEx and UPS (USA) – Masters of express logistics.
DB Schenker, Kuehne + Nagel – Giants in multimodal transport and supply chain management.
📈 5. How Logistics Shapes Global Market Trading
The performance of logistics directly impacts global market trading trends, particularly in:
a) Trade Competitiveness
Efficient logistics reduce costs and delivery time, giving countries an edge.
For example, Vietnam and Bangladesh have become major textile exporters due to improving port and logistics infrastructure.
b) Stock Market Sensitivity
Shipping and logistics stocks often act as economic barometers.
When freight demand rises, it signals stronger global trade — often boosting related equities like Maersk, Cosco, or FedEx.
c) Commodity Flow and Pricing
Delays or disruptions in shipping (like the 2021 Suez Canal blockage) can skyrocket oil and commodity prices, shaking markets worldwide.
d) Currency and Inflation Effects
Rising freight costs translate into import inflation, affecting consumer prices and currency values.
🌐 6. The Emerging Trends Transforming the Industry
The next decade of shipping and logistics will be defined by technology, sustainability, and geopolitical realignment.
a) Green Shipping Revolution
To meet carbon-neutral goals, companies are investing in:
Biofuel and hydrogen vessels
Electric trucks and hybrid cargo ships
Port electrification and automation
b) Digital Freight Platforms
Startups and major logistics firms are digitizing operations. Platforms like Flexport, Freightos, and Maersk Spot allow real-time booking, rate comparison, and shipment tracking.
c) Regionalization of Supply Chains
The pandemic taught companies not to depend on single regions (like China). “China +1” strategies are leading to diversification into India, Vietnam, and Mexico.
d) Autonomous Transport
Self-driving trucks are being tested for long-haul logistics.
AI-powered ships are navigating test routes autonomously.
e) Cold Chain Expansion
As pharmaceutical and perishable goods trading grows, demand for temperature-controlled logistics (cold chain) is booming globally.
💥 7. Challenges Facing the Global Shipping and Logistics Sector
Despite its importance, the industry faces intense challenges:
Geopolitical Tensions: Trade wars and conflicts disrupt established routes (e.g., Russia-Ukraine, Red Sea tensions).
Fuel and Energy Volatility: Shipping heavily depends on bunker fuel; any spike raises freight costs globally.
Environmental Regulations: IMO 2020 sulfur caps and net-zero emission goals are increasing operational costs.
Port Infrastructure Gaps: Developing nations face bottlenecks due to outdated facilities.
Digital Divide: Smaller logistics players struggle to adopt advanced tech systems.
Labor Shortages: Shortage of truck drivers, dock workers, and technical staff affects global efficiency.
🧭 8. Future Outlook: The Next Wave of Global Logistics
By 2030, the logistics landscape will look very different:
Smart Ports: Automated cranes, AI scheduling, and blockchain customs.
Hyperloop & Drone Delivery: Faster, cleaner alternatives for intercity and last-mile logistics.
Decentralized Trade Routes: Africa and South America emerging as new freight corridors.
Resilient Supply Chains: Diversification and AI forecasting will reduce dependency on any single geography.
The integration of AI and blockchain will bring transparency and traceability to global supply chains, reducing fraud and inefficiencies. Meanwhile, green logistics will become a major investment theme, attracting ESG-focused capital.
💡 9. Investment & Trading Opportunities in the Sector
For traders and investors, shipping and logistics offer exciting opportunities:
Publicly Listed Giants: Maersk, Hapag-Lloyd, Evergreen Marine, FedEx, and UPS often move in sync with trade growth cycles.
Port Operators: DP World, Adani Ports, and Hutchison are key beneficiaries of rising trade volumes.
Logistics Tech Startups: AI-driven freight management firms are disrupting traditional models.
ETF Exposure: Funds like the Global X Shipping ETF allow investors to ride global logistics growth.
As e-commerce and manufacturing expand globally, logistics stocks could become the backbone of long-term investment portfolios.
🏁 Conclusion: The Flow That Never Stops
Global market trading is like a living organism — and shipping, freight, and logistics are its vital organs. Every container that moves, every parcel delivered, and every port expansion project fuels the heartbeat of the world economy.
As the 21st century progresses, this industry is not just about transportation anymore. It’s about technology, sustainability, and strategy. Those who master logistics control the rhythm of world trade.
From AI-managed ports to zero-emission ships, the next decade promises a revolution in how goods move across the planet — faster, cleaner, and smarter. In the grand theater of global markets, logistics remains the silent powerhouse that keeps the world connected and commerce alive.

AAPL at the Tipping Point
🧩 Overall Technical Analysis
Timeframe: Daily (1D)
Current Situation: Price is consolidating in a narrow sideways range between $252 and $259, after a strong bullish rally — a typical bullish continuation pattern.
50-day SMA: Around $233.6, acting as a strong dynamic support.
Medium-term Trend: Uptrend (higher highs and higher lows since mid-September).
Pattern: Rectangular consolidation after a sharp move up — potential bullish flag formation.
⚡ Short-Term Outlook (1–2 Weeks)
The price is compressing between $252–$259, like a spring ready to break.
Bullish Scenario (Higher Probability)
Confirmation: Break and close above $260
Target 1: $268
Target 2: $275
Stop Loss: Daily close below $252
Bearish Scenario (Lower Probability)
Confirmation: Break and close below $252
Target 1: $243
Target 2: Around the 50-day SMA (~$233–$234)
Stop Loss: Daily close back above $258
📈 Short-term Summary:
As long as price stays above $252, the short-term bias remains bullish.
🏆 Long-Term Outlook (1–3 Months)
Primary Trend: Still bullish, supported by the 50-day SMA.
Market Structure: Higher highs and higher lows — classic uptrend continuation.
Potential next leg up if the price breaks convincingly above $260.
Long-Term Targets:
Target 1: $280 (psychological resistance & previous high zone)
Target 2: $295 (Fibonacci 1.272 extension from recent swing)
Long-Term Stop Loss:
Below $233 (loss of the 50-day SMA and break of bullish structure)
💡 Key Insights:
Watch for increasing volume and RSI momentum for confirmation of a breakout.
Keep an eye on upcoming earnings and product news — Apple’s sentiment can shift quickly.
A high-volume breakout above $260 would provide a stronger confirmation for continuation.
AAPL Holding Firm Below Resistance. Watch $259 Breakout. Oct. 6Market Overview (15-Min Chart)
AAPL spent Friday consolidating after an early rebound from the $253.20 support zone. Price action has since formed a rising wedge structure — typically a signal of waning momentum — as the stock approaches the $259–$260 resistance zone.
The MACD histogram shows weakening bullish momentum, with histogram bars fading toward zero, suggesting buyers may be losing strength. However, the Stoch RSI is curling upward from the lower band, which can hint at a short-term continuation push if price holds the trendline above $256.50.
The structure implies equilibrium — bulls maintaining control above the intraday trendline, but bears waiting near resistance. The battle line for the next directional move is clearly set around $259.
GEX Confirmation (1H Chart Insight)
On the 1-hour Gamma Exposure (GEX) chart, the highest positive NET GEX / Call Resistance aligns right at $259–$260, confirming this as the critical level institutions are defending. If AAPL manages to break and sustain above this zone, gamma pressure could unwind, potentially sending price toward $263–$265, where the next Call Wall sits.
On the downside, Put Walls and support clusters are visible at $252–$247.50, marking the range where dealers are likely to absorb downside momentum. The IVR (19.1) and IVX avg (26.2) indicate compressed volatility, suggesting that once a breakout occurs, it could expand sharply.
Trade Scenarios for the Week (Oct. 6–11)
Bullish Case:
If AAPL reclaims $259 with strength, momentum could carry it toward $263.75 (measured move target) or $265, aligning with upper gamma resistance.
* Entry: Above 259 confirmation
* Target 1: 263.75
* Target 2: 265
* Stop-Loss: Below 256
Bearish Case:
If AAPL fails to hold $256 and breaks below the rising trendline, expect sellers to retest $253.20 and possibly $250, where the 2nd Call Wall transitions into a neutral gamma zone.
* Entry: Below 256
* Target 1: 253.2
* Target 2: 250
* Stop-Loss: Above 259
Option Insights
The current GEX landscape indicates a tight battle between gamma compression and breakout potential. With only 2.8% Call participation, there’s low bullish overextension — which can fuel a strong move once breakout volume enters.
For options traders, calls near 260–265 could be positioned for breakout confirmation, while puts near 255–250 can capture a wedge breakdown. The low IVR supports directional debit strategies early in the week.
My Thoughts
AAPL looks balanced but loaded — buyers defending the short-term uptrend, while major resistance aligns perfectly with gamma ceilings at $259–$260. This convergence of structure and sentiment often precedes a defining move.
A sustained breakout above $259 could quickly attract momentum traders and dealer hedging flows, pushing toward $263+. If price rejects again and slips below $256, the wedge breakdown may trigger a healthy pullback to reset momentum.
This is a pivotal setup — patient traders will wait for confirmation, not prediction.
Disclaimer:
This analysis is for educational purposes only and does not constitute financial advice. Always perform your own due diligence and manage risk responsibly before trading.
