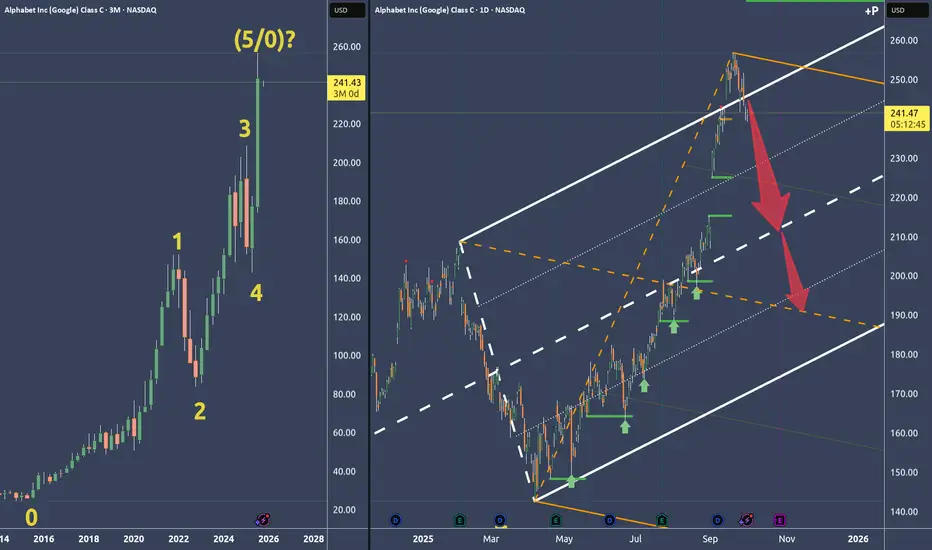
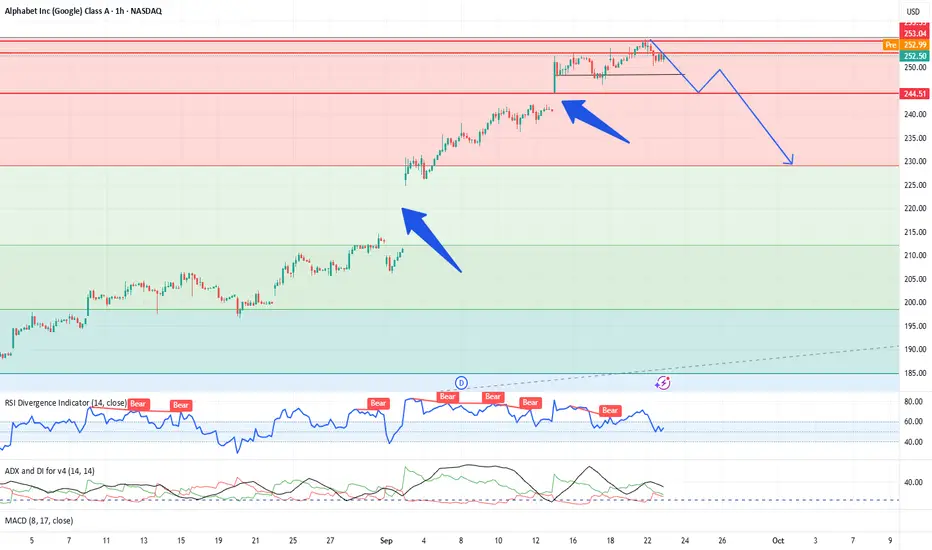
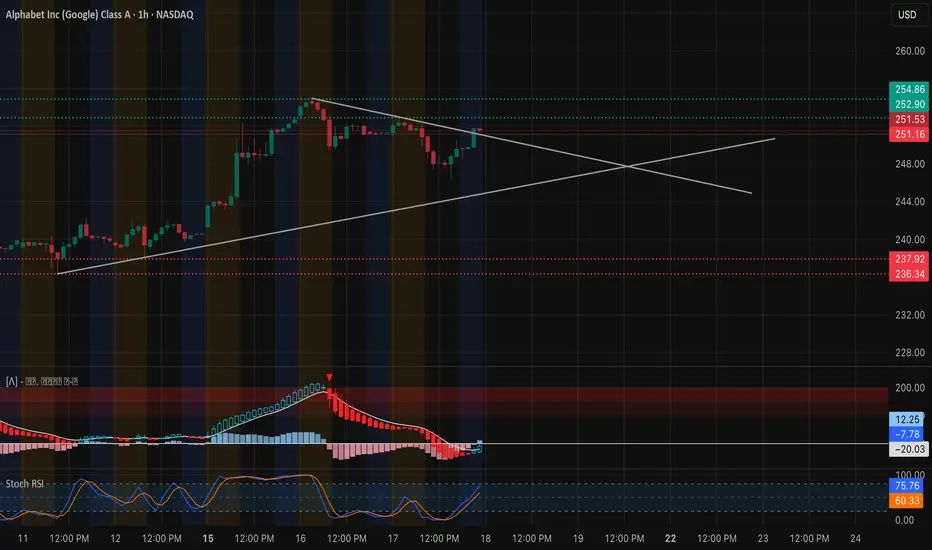
Google Alphabet: Why I think it's time to short🔱 Simple decision because of the Fork framework 🔱
Left Chart:
Zero-to-five count with a potential P5 and a turn.
Why P5?...
Right Chart:
...because price broke out of the U-MLH, then fell back into the fork. As a filter I like it when price is opening and closing inside the fork again. All in all it's a new and weak behaviour.
Or in short: That’s a pretty darn strong short signal to me.
Following the rules, taking acceptable risks, and hunting a fat profit.
👉 PTG1: The white centerline
👉 PTG2: The orange centerline
🛷 Happy Sleigh Ride 🎄
4GOOG trade ideas
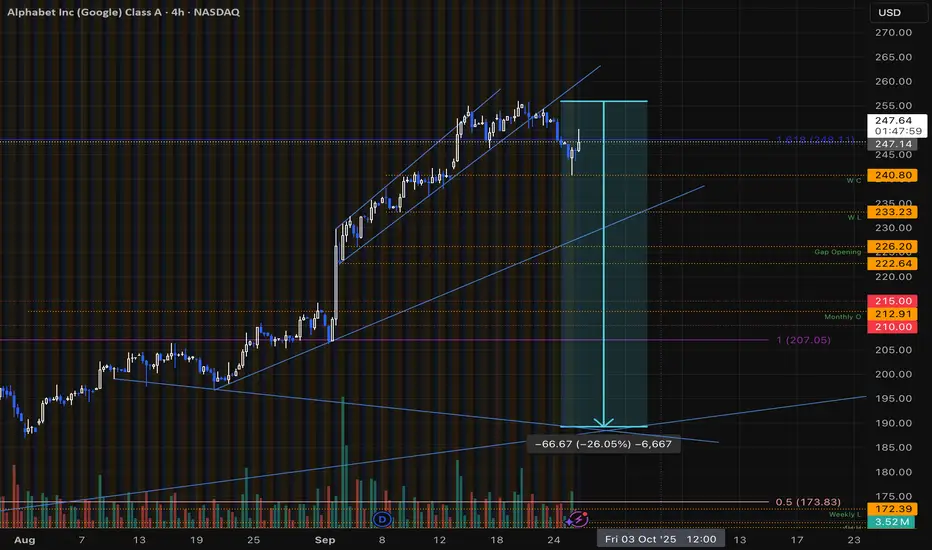
Google to $185 by EO next WeekAfter touching the 1.618 fib level, the extension of this rally is completed.
Technical Reasons to be (aggressively) short
- Rejection at 1.618 fib level
- breaking upward channel with retest
- breaking the previous Week Low
Fundamental reasons
- Multiple cases across the world
- $3 Billion fine from EU just for one Case, 2nd fine looms ahead
- It seems like the DOJ can't sleep until Google gets punch in the liver
- Uncertainty of the Economic landscape
Why $185?
alignment of the upward trend since April, and is a perfect entry point for a long position
This Scenario is invalidated if
- This week closes above 256
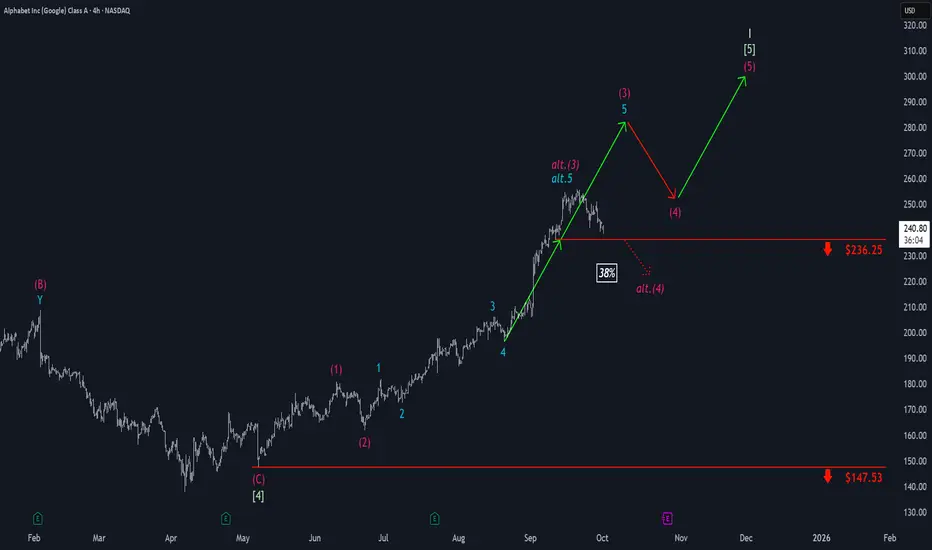
Google: Uptrend StallingFor Google, upward momentum has faded recently, with price edging closer to support at $236.25. If the stock drops below this level, we will need to consider magenta wave alt.(3) as already complete and anticipate an earlier—and lower—wave alt.(4) low (probability: 38%). However, our primary expectation remains for a higher high as the regular wave (3) progresses, with the wave (4) retracement holding above $236.25. With wave (5), waves in green and I in beige should ultimately conclude at new all-time highs.
GOOGL Tightening Before the Move — Watch This Level on Oct. 6GOOGL Tightening Before the Move — Watch This Level Closely on Oct. 6 🔍
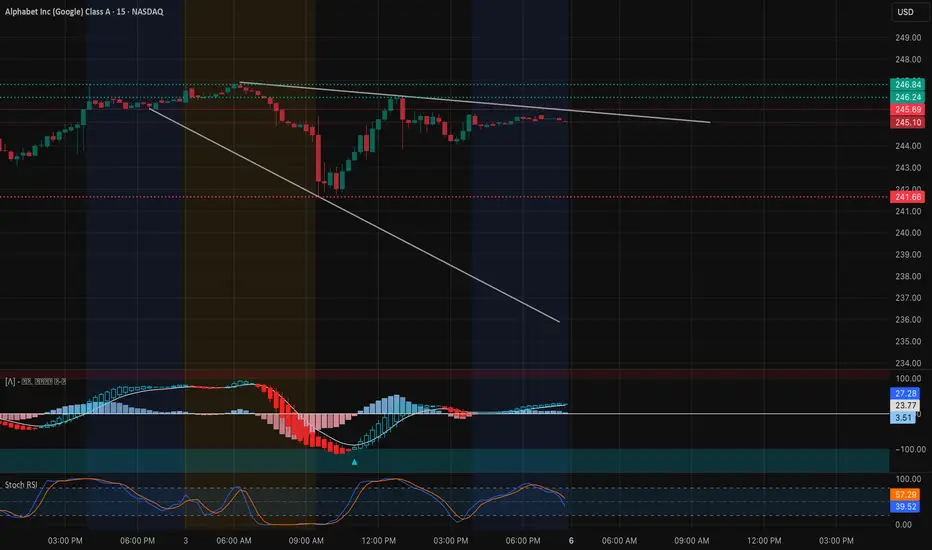
Market Overview (15-Min Chart)
GOOGL has been consolidating tightly under a descending trendline after Friday’s rebound from the $241.50–$242 zone, where buyers stepped in to defend short-term structure. Price remains trapped between $241.66 (support) and $246.80 (resistance), forming a coiling range inside a narrowing channel — a classic setup for an upcoming volatility breakout.
The MACD histogram is shifting from red to light blue, hinting at reduced bearish momentum. The Stoch RSI has also lifted from oversold levels, suggesting that buying pressure could reemerge if the price breaks above the descending trendline near $246–$247.
For intraday traders, the structure suggests accumulation below resistance, with momentum cues favoring a potential short-term breakout attempt early in the week.
GEX Confirmation (1H Chart Insight)
The 1-hour GEX data provides a clear institutional footprint for direction bias. The highest positive NET GEX / Call Resistance aligns around $250, which corresponds to the major CALL wall — the key zone where market makers may start to hedge aggressively if price expands upward.
Below, heavy PUT support sits at $240–$238, forming a sturdy demand shelf. This is where downside moves could exhaust due to gamma absorption, especially with GEX skewed toward neutral near current price.
The IVR (44.3) and IVX avg (38.5) show that volatility remains moderately elevated, while CALL participation (28.1%) suggests traders are cautiously positioned — not overleveraged on the bullish side yet.
Trade Scenarios for the Week (Oct. 6–11)
Bullish Case:
If GOOGL breaks and sustains above $246.80, it opens the door to $249.50–$250, aligning with the top GEX resistance zone.
* Entry: Above 247
* Target 1: 249.5
* Target 2: 250
* Stop-Loss: Below 244
Bearish Case:
Failure to clear $247 and a breakdown below $242 could bring a swift retest of $240 and potentially $238, where the next Put Wall awaits.
* Entry: Below 242
* Target 1: 240
* Target 2: 238
* Stop-Loss: Above 246
Option Insights
The current gamma setup suggests low directional bias but high potential energy. Once the $247 level breaks, gamma expansion could trigger a faster-than-expected move toward $250. Conversely, a rejection there may compress price action into the $240–$242 liquidity zone, favoring short-term put scalps.
Traders may consider call spreads (247–250) if momentum confirms upward, or put spreads (242–238) if breakdown triggers. Volatility expansion could reward early directional positioning.
My Thoughts
GOOGL is coiling tightly — a textbook sign of imminent range resolution. The descending channel is narrowing, and MACD + Stoch RSI are both hinting at early accumulation. Monday’s open should reveal whether bulls have enough strength to break through $247 resistance.
If that breakout occurs, expect a swift gamma-led move into $250+. If it fails, bears will likely regain control, dragging price back toward the $240 pivot. This is a “watch and react” setup — traders should be ready for volatility expansion either way.
Disclaimer:
This analysis is for educational purposes only and does not constitute financial advice. Always perform your own due diligence and manage risk responsibly before trading.
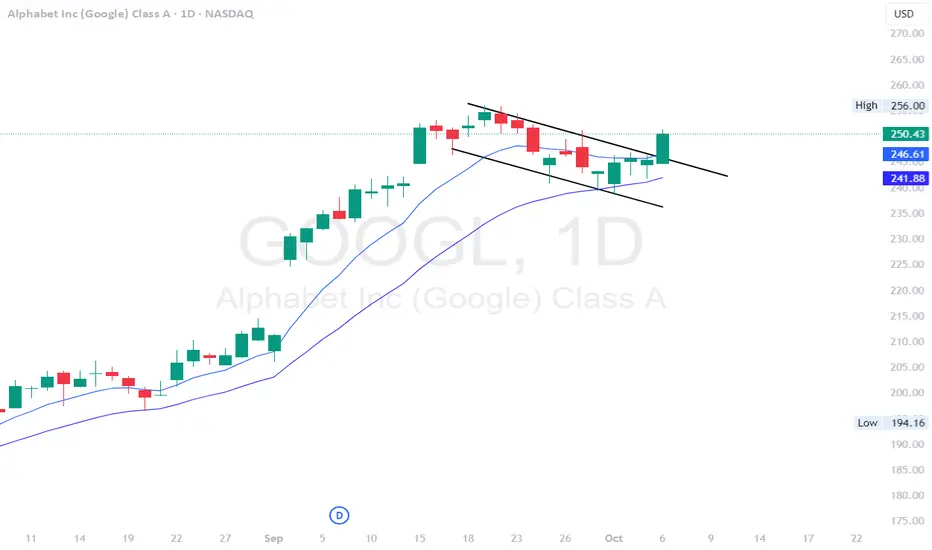
GOOGL - Flag break out on the daily GOOGL - stock breaking out of the flag on the daily time frame breaking above $250 level. seeing multiple call flow coming in for $250 and $260 strike short dated. Looking for $260 plus as long as $250 holds. Stock is decent at indicator level.
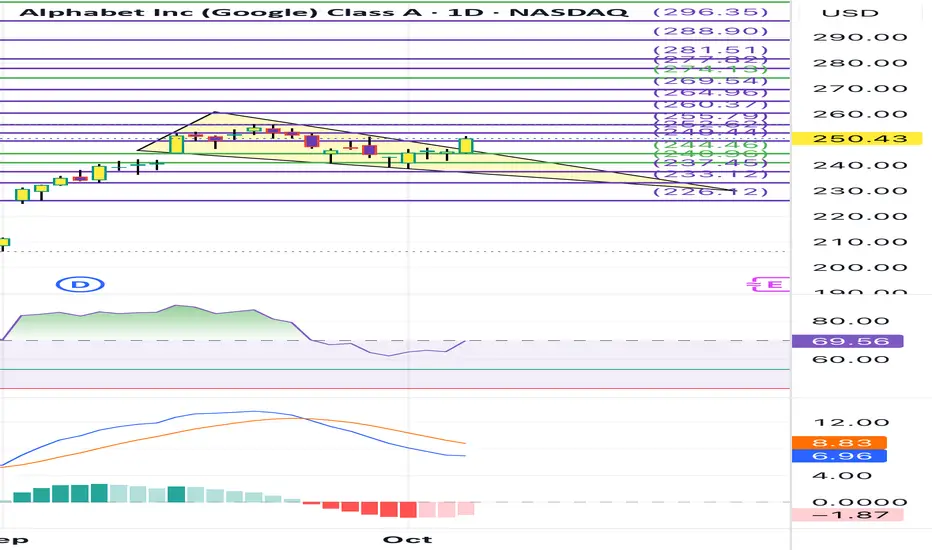
Potential falling wedge on GOOGLBullish potential falling wedge breakout on GOOGL. LT = 274, stop 245. Use levels.
GOOG Alphabet Options Ahead of EarningsIf you haven`t bought GOOG before the previous rally:
Now analyzing the options chain and the chart patterns of GOOG Alphabet prior to the earnings report this week,
I would consider purchasing the 170usd strike price Calls with
an expiration date of 2025-7-18,
for a premium of approximately $4.35.
If these options prove to be profitable prior to the earnings release, I would sell at least half of them.

GOOGL – TA for Sep 29GOOGL – Compression at Key Levels as Gamma Walls Define the Next Breakout 🚦
1-Hour Technical Outlook
Alphabet has been trapped in a descending triangle since last week, with lower highs pressing against a flat support base. Price is hovering around $246–$247, coiling just below the trendline resistance. The MACD has cooled after a bullish crossover but momentum is fading sideways, while the Stoch RSI sits near oversold, suggesting a possible bounce attempt.
Immediate resistance sits at $250.2, then the supply band at $255–$257.5. Support lies at $245.8, with critical downside levels at $242.5 and $240.7.
Gamma Exposure (GEX) Confirmation
Options positioning aligns tightly with the technicals:
* Max positive GEX / Call Resistance clusters at $250, acting as a magnetic pivot for hedging flows.
* Upside extension walls: $255 (~30%) and $257.5 (~33%). If $250 is reclaimed, a gamma-driven move toward these zones becomes possible.
* On the downside, strong put support sits at $242.5–$240.7, a critical floor where dealers may defend.
This gives us a clear risk map: breakout over $250 triggers hedging pressure higher, while failure below $245.8 could accelerate flows into the $242/$240 zone.
Trade Ideas & Option Plays for This Week
* Bullish Play: Long above $250.2 with targets at $255–$257.5. Option setup: 1-week 250 calls or 250/255 debit spreads to manage premium.
* Bearish Setup: Breakdown below $245.8 exposes $242–$240. Short-dated puts or 247.5/242.5 spreads can work as controlled-risk plays.
* With IVR near 33.7 and IVx avg ~34, volatility pricing is fair—spreads and defined-risk strategies fit well.
My Take:
GOOGL is sitting at a decision point. The coil under $250 suggests accumulation before a move, with gamma levels clearly marking the battlefield. Bulls need to flip $250 into support for a sustained breakout, while bears will press for a crack under $246. The tape is neutral but ready to expand—this week should deliver clarity.
Disclaimer: This analysis is for educational purposes only and does not constitute financial advice. Always do your own research and manage risk before trading.

Has Google formed the TOP?Google has created two big windows on its way up to forming the all-time high (ATH). Some initial signs of profit booking have been visible on the hourly time frame. Even in the daily time frame, the low of previous day candle has been broken. Once it goes below $250 levels, weakness will creep in, and it will do down to fill the gaps with interim targets of 240 and 230 in the short term. The position short targets are around 220 levels where the initial big window was created. (For educational purposes only)
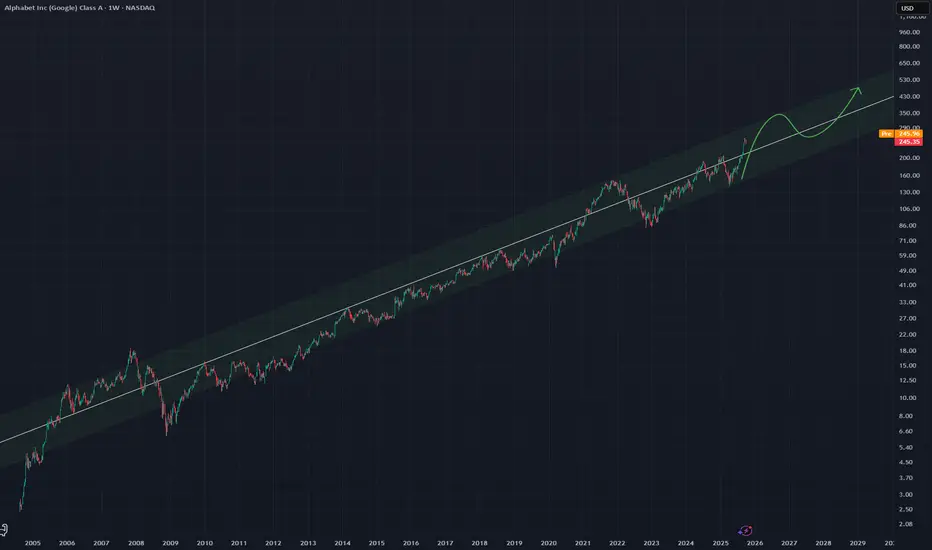
GOOGL - Long Term Channel Monthly Chart for GOOGL showing a very long term channel
Price will likely stay in this channel and push to the upper half of it during the rest of 2025 and early 2026.
Good long choice for stocks.
Google's Upside Driven by AI and Cloud Momentum
Current Price: $245.35
Direction: LONG
Targets:
- T1 = $260.00
- T2 = $275.00
Stop Levels:
- S1 = $240.00
- S2 = $235.00
**Wisdom of Professional Traders:**
This analysis synthesizes insights from thousands of professional traders and market experts, leveraging collective intelligence to identify high-probability trade setups. The wisdom of crowds principle suggests that aggregated market perspectives from experienced professionals often outperform individual forecasts, reducing cognitive biases and highlighting consensus opportunities in Google.
**Key Insights:**
Google (Alphabet Inc.) continues to position itself as a dominant leader in the tech space, driven by rapid advancements in artificial intelligence (AI) and robust growth in its cloud business segment. Traders and analysts widely cite the company's strategic investments in generative AI tools, such as Bard and its integration across Google’s ecosystem, as pivotal for maintaining user engagement and increasing monetization potential.
The expansion of Google Cloud has been particularly notable, achieving strong revenue growth alongside improving profitability. With enterprises increasingly relying on cloud computing services for AI workloads, Google is set to benefit from this secular trend. Moreover, recent updates to their ad products, including advanced AI-driven solutions to improve targeting efficiency and ROI for advertisers, continue to bolster Google's core digital ads business, which remains its revenue backbone.
**Recent Performance:**
Google's stock has rallied by approximately 15% through 2025, supported by two consecutive quarters of earnings beats, with Q2 2025 showing an impressive 10% year-over-year jump in revenue. Shares have shown resilience, managing a stable uptrend despite broader market volatility in the tech sector. The current price consolidates above the $240.00 support level, which traders view as a reliable base for bullish continuation.
**Expert Analysis:**
Technical indicators complement the optimistic outlook for Google, with its 50-day moving average steadily trending higher toward the 200-day moving average, signaling mid-term bullish confidence. The Relative Strength Index (RSI) remains in neutral-to-bullish territory, indicating room for further upward momentum. Many professional analysts adjust their price targets upward, projecting Google to exceed the $270.00 mark by year-end as revenue trends remain robust.
Fundamentally, Google’s cost optimization measures, including a reduction in operating expenses tied to legacy projects, amplify profitability. Combined with diverse product innovations, traders and analysts emphasize Alphabet’s prescient pivot toward AI dominance will likely sustain both top-line and bottom-line growth into 2025 and beyond.
**News Impact:**
Recent headlines reveal critical partnerships, including Google's accelerated collaborations with Fortune 500 companies to deploy generative AI solutions at scale. These developments have further cemented investors' confidence in Alphabet’s future trajectory. In addition, regulatory uncertainty surrounding global tech giants appears to have slightly diminished, reducing pressure on Alphabet's key markets in both North America and Europe.
**Trading Recommendation:**
Given Alphabet's compelling growth prospects in high-margin businesses like AI and cloud computing, combined with technical bullish signals, a LONG position is recommended. Strong quarterly results and resilient price action make Google an attractive asset poised for upside. With a clear path toward $260.00 and potentially $275.00 over the coming months, traders can leverage the ongoing momentum for portfolio gains while managing risk at stops of $240.00 and $235.00 to safeguard against volatility.
Do you want to save hours every week? Register for the free weekly update in your language!

Heres a GOOG Breakout SETUP!! (1HR)Still in a wedge, but my bias leans towards bullish. Watching for a clean breakout above 247.64 for confirmation.
My Targets are 247.64 → 251.65 → 254.77
⚠️ This is not financial advice just my personal analysis. Always do your own research before trading or investing.

GOOGL OCT 2025GOOGL (4H) — Price is rejecting the 250–255 supply band after notable sell programs (~$2.4B tagged near the ceiling). Buyers defended 240 on first test, but momentum remains capped below resistance.
Institutional read: distribution active into 250–255; absorption attempts around 240. A clean break of either level likely sets the next swing. The open gap at 225–210 remains a magnet if 240 fails.
Target to the upside:
Reclaim 250 and hold → 255 retest; extension only on sustained acceptance above 255 toward 260.
Target to the downside:
Lose 240 on volume → gap fill toward 225–210; continuation risk into 205–200.
#GOOGL #globaltrade #investment #investing #stockmarket #wealth #realestate #markets #economy #finance #money #forex #trading #price #business #currency #blockchain #crypto #cryptocurrency #airdrop #btc #ethereum #ico #altcoin #cryptonews #Bitcoin #ipo

Alphabet (GOOG): Fresh AI Catalysts Make This a Top Buy WatchAlphabet stock is surging on 14% revenue growth and a 32% jump in Google Cloud for Q2 2025. AI features like Gemini and AI Mode are driving millions of new users. With hefty AI investments and a record-breaking quarter, technical signals show strong momentum. Is this a buy opportunity, or is GOOG overextended? Here’s what to watch for the next move.

GOOGL Oct. 1 – Holding the Line at $242, Breakout or Breakdown AIntraday View (15-Min Chart)
GOOGL fought back from the morning drop but is stuck under a descending trendline, consolidating at $242–$243. Sellers are pressing overhead while momentum fades.
* Support Levels: $242.55, $240.00, $239.33
* Resistance Levels: $243.36, $244.05, $247.5
* Indicators: MACD rolling red, showing weakening momentum. Stoch RSI hovering low, suggesting potential bounce if support holds.
📌 Intraday Thought (Oct. 1): If $242 holds, GOOGL could bounce into $244–$247. A breakdown below $240 risks testing $238. Scalpers can play long near $242 with stops tight, or fade near $244 if price rejects.
Options & Swing View (1H + GEX)
Gamma positioning highlights the key battleground:
* Upside: Big call walls stacked at $247.5–$252.5, with extension toward $255–$260.
* Downside: Strong put support anchored at $240, with deeper protection at $237.5–$235.
This paints a box between $240–$247.5. A breakout over $247.5 could fuel momentum toward $252.5–$255, while losing $240 would expose $237.5.
* Bullish Play (Oct. 1): Calls or debit spreads targeting $250+ if $247.5 breaks on volume.
* Bearish Hedge: Puts targeting $240 → $237.5 if $242 support collapses.
* Neutral Play: Iron condor between $240–$247.5 while GOOGL chops in range.
My Thoughts (Oct. 1)
GOOGL is at a decision zone—$242 support vs. $247 resistance. The chart is leaning weak under the descending trendline, but $240–$242 remains a key defense zone. If bulls can reclaim $247.5, momentum opens for a push to $252+. If not, expect more chop or breakdown back into $238. Flexibility is crucial here.
Disclaimer: This analysis is for educational purposes only and does not constitute financial advice. Always do your own research and manage risk before trading.

$GOOG Momentum is slowing and the indicators presenting some overheated price action. positions may be held but better not to open new position here.

GOOGL Sep 23 – Watching 255 Break for Fresh Upside Price Action & Setup (1-Hour Chart)
Alphabet is carving a rising wedge pattern and just bounced from the lower trendline near 250. Price is hovering around 253 and testing the mid-zone. A decisive hourly close above 255 would put the upper wedge trendline and the 257.5–260 zone in play. Support sits at 250, then 247.5, where a hard drop could quickly bring 245 into focus.
Momentum Read
MACD is recovering from a pullback and approaching a fresh crossover—constructive if confirmed. Stoch RSI is moving out of mid-range, suggesting room for a push before overbought territory.
GEX (Options Flow) Confluence
Options positioning is leaning constructive:
* Highest positive GEX / Call resistance: near 255
* 2nd Call Wall: 257.5 with 89% call concentration
* 3rd Call Wall: 262.5
* Key Put Supports: 247.5 and 245
Holding over 253 and punching through 255 would force market makers to hedge higher, creating gamma fuel toward 257.5 and 262.5.
Trading Plan
* Bullish setup: Buy a confirmed 255 break with volume. Target 257.5–262.5. Stop around 252.
* Retest entry: Bounce from 250 support with confirmation can be a conservative add.
* Bearish setup: A break below 247.5 opens room for 245 and potentially 240.
Option Angle
Short-dated calls in the 255–260 range are interesting if the 255 level flips to support. Bears can consider puts near 245 if breakdown plays out.
Bottom Line
The 255 zone is the key pivot. A breakout there can spark momentum toward 257.5–262.5. Losing 247.5 would negate the bullish setup.
Disclaimer: This is for educational discussion only and not financial advice. Always do your own research and manage risk.
$GOOG is getting expensiveNASDAQ:GOOG is trading at high earnings multiple while technicals are extended, not a combination that is appealing for entering a new position for me.

Take a bullish position on Google as price action shows momentumCurrent Price: $254.72
Direction: LONG
Targets:
- T1 = $261.00
- T2 = $267.50
Stop Levels:
- S1 = $246.50
- S2 = $241.00
**Wisdom of Professional Traders:**
This analysis synthesizes insights from thousands of market experts and professional traders who have consistently relied on momentum indicators and critical support/resistance levels to predict price movements. Leveraging the collective intelligence of traders, Google's trading setup reflects a consensus bullish outlook due to favorable technical patterns and fundamental growth drivers. As Google continues to benefit from structural tailwinds like the rise of AI and cloud-based innovations, traders see opportunities to capture upside potential despite broader macroeconomic uncertainties.
**Key Insights:**
Google's share price currently reflects both strong market positioning and optimistic sentiment surrounding its strategic growth initiatives. Analysts have flagged its continuing dominance in digital advertising and search engine markets, paired with its expanding footprint in artificial intelligence applications like Bard and generative AI tools integrated across its platforms. Major institutional players are bullish on the long-term prospects of Google's innovation pipeline, citing its impressive balance sheet and significant investment in cloud infrastructure.
From a technical standpoint, Google's price is trending above its 50- and 200-day moving averages, signaling broader market confidence and underlying strength. RSI levels suggest the stock is approaching—but not yet in—overbought territory, indicating room for further gains rather than immediate profit-taking. Combined with recent breakout patterns, traders are viewing its current price as a launchpad for higher highs.
**Recent Performance:**
Google's recent share price momentum has recovered sharply following the release of Q2 2025 earnings that outperformed market expectations. The company recorded robust year-on-year revenue growth driven by heightened demand for its cloud services, digital ads during major global events, and ongoing user engagement across Google properties. Over the past 30 days, its stock has gained approximately 5%, supported by strong volume and improving macro conditions in the tech sector.
**Expert Analysis:**
Market experts remain optimistic about Google's trajectory for the remainder of 2025. Goldman Sachs' latest rating reiterated a "Buy" stance with an updated price target north of $270, citing strong cash flow generation and strategic acquisitions solidifying its AI portfolio. Moreover, technical analysts point to recent volume upticks and breakout confirmation above resistance at $250 as a precursor to sustained upside if market sentiment continues to align favorably. While short-term volatility may arise from external macro factors like rising interest rates, Google's fundamentals remain a compelling anchor for long-term investment.
**News Impact:**
Recent announcements regarding Google's continued advances in AI have significantly bolstered its stock sentiment. The unveiling of fresh AI-driven advertising tools to counterbalance competitive pressures from Amazon and Meta have demonstrated its leadership in innovation. Furthermore, positive regulatory developments in key markets, such as its approval to expand cloud operations in Southeast Asia, are setting the stage for increased revenue diversification and growth into 2026.
**Trading Recommendation:**
Google's robust fundamentals and technical breakout patterns make it an attractive long position at its current price of $254.72. With critical support levels in place and upside price targets aligning with consensus trader optimism, investors should consider taking advantage of this momentum-driven movement. A stop-loss strategy at $246.50 minimizes downside risk, while challenges from macro factors remain manageable given Google's sustained revenue diversification. Watch for further confirmation of strength near $261 prior to breaking toward higher resistance at $267.50.
Do you want to save hours every week? Register for the free weekly update in your language!

GOOGL Sep 22 TA – “Knocking on 256: Breakout or Fakeout?”1️⃣ Big Picture on the 1-Hour Chart
* Price action: Alphabet closed around 255.35, steadily grinding higher along a rising trendline. The stock is testing the upper end of its ascending channel and pressing against fresh resistance.
* Key levels:
* Resistance: 256–257.5 (current high and call wall)
* Support: 253.8 → 252 (recent breakout zone)
* Indicators:
* MACD is positive and still trending up, confirming steady bullish momentum.
* Stoch RSI is elevated near 90, which can hint at a short-term pullback or sideways action.
Trend remains bullish, but with momentum stretched, traders should watch for a brief cooling before another leg higher.
2️⃣ GEX / Options Flow
* Major call walls cluster at 257.5, 262, and 265, with strong gamma support near 253.8.
* Notable put support sits around 245–247.5, plus an HVL around 247.5 that could attract price if sellers take control.
* IVR is around 22, indicating moderate implied volatility and decent liquidity for options traders.
This options setup suggests market makers may try to keep GOOGL in the 252–257.5 range early in the week, with a break over 257.5 potentially unleashing momentum toward 260 and beyond.
3️⃣ Trading Thoughts & Suggestions
* Scalp / day trade: Look for a clean break and hold above 256–257.5 with strong volume. If confirmed, quick upside targets are 260 → 262.
* Support bounce: A pullback to 253.8–252 that holds can offer a low-risk entry for another run at 256+.
* Fade setup: A hard rejection at 257.5 could send price back toward 253.8 and possibly 252.
4️⃣ Bottom Line
GOOGL is pressing on major resistance with solid momentum. A decisive move above 257.5 opens the door to 260+, while failure there could lead to a healthy retest of the 253–252 area.
Disclaimer: This is just market opinion for educational discussion. It’s not financial advice. Always manage your own risk before trading.

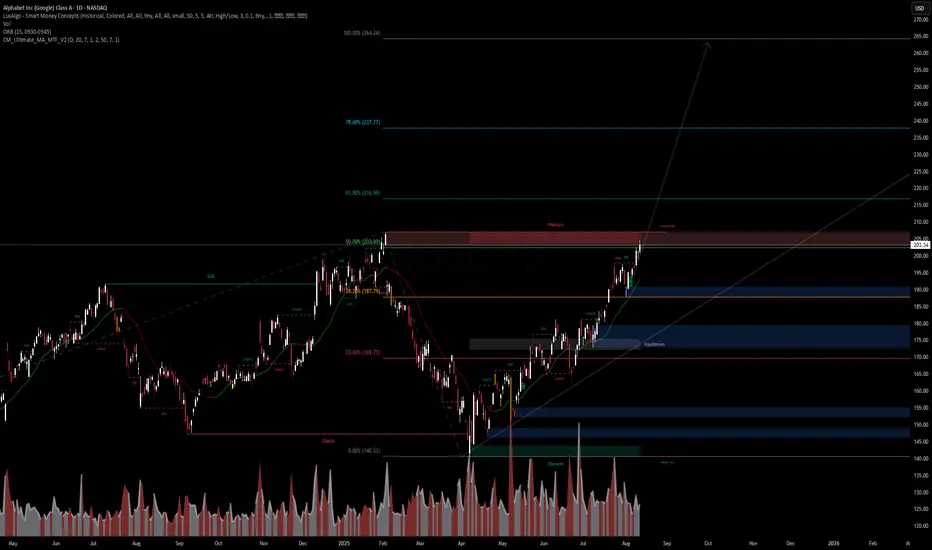
GOOGL – VolanX WatchlistPrice is pressing into a key resistance zone near the 50% retracement level, aligning with prior supply. If we see a decisive breakout and hold above this “strong map” zone, the setup starts to resemble a long-term double bottom structure—often a precursor to multi-quarter upside trends.
Volume is healthy, structure remains bullish, and the higher timeframe fib targets point toward 217, 237, and potentially 265 if momentum persists. Risk remains in the short-term if sellers defend the premium zone, but as of now, trend bias is still to the upside.
Key levels to watch:
Support: 187.7 / 175 (equilibrium)
Resistance: 206.3 (break & hold could trigger trend acceleration)
Fib extensions: 217, 237, 265
📊 VolanX Trend Rating: Bullish until proven otherwise
Disclaimer: This is not financial advice. Markets carry risk—manage accordingly.
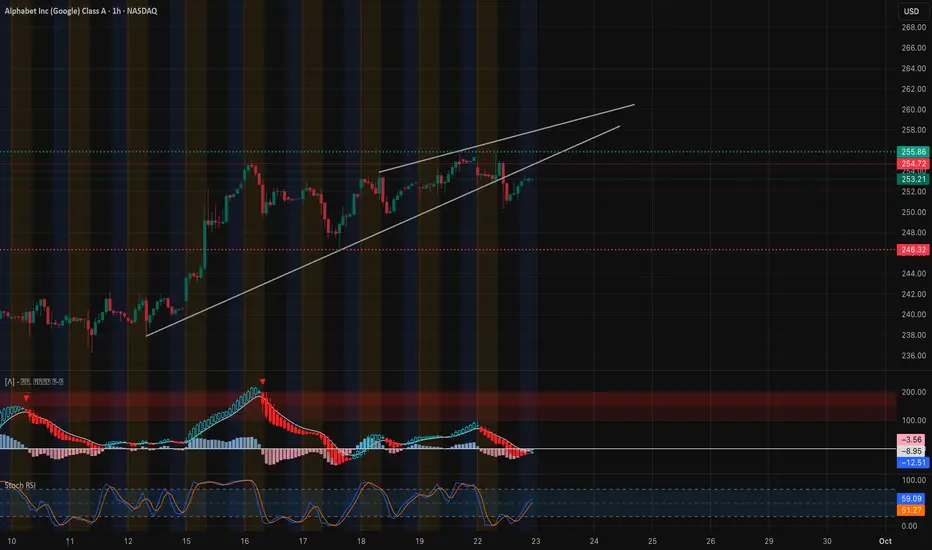
GOOGL Basing for Next Move – Sept 18 Trade Setup 🔍 Here’s my trader’s desk note for Alphabet (GOOGL) into Wednesday’s session, based on the 1-hour chart and GEX options data.
1️⃣ Price Action & Structure
* Tight coil: After last week’s rally to $257, GOOGL pulled back and is now pivoting near $251.5. The price is pressing against a short descending trendline—watch for a clean break.
* Upside trigger: A decisive hourly close over $252.9–254.8 sets up a retest of $257 and possibly $260.
* Support shelf: First line at $249–247, with stronger backing around $242–238.
2️⃣ GEX (Options Flow) Check
* Call magnets: Heavy gamma and call wall sit at $252.5 (≈86% call concentration), then $257.5 and $260. These can act as price magnets on strength.
* Put support: Major put zones rest at $242.5 and $237.5, keeping downside risk contained unless the market breaks lower.
* Flow profile: Calls account for about 35% of flow with IVR around 24.8, giving moderate premium costs.
3️⃣ Trading Thoughts
* Bullish scenario: Go long on an hourly close above $253. Targets $257–260, stop under $249.
* Bearish scenario: If price fails to break and slips under $247, expect a slide toward $242–238.
4️⃣ Option Angles
* Upside spread: 252.5/260 call spreads balance cost and upside potential.
* Neutral hedge: Selling puts at or below $240 is a way to collect premium if you trust the broader uptrend.
5️⃣ My View
GOOGL is quietly building energy after a strong run. A break over $253 with volume could invite a fast move to the upper-$250s. Until then, watch for a range between $247 and $253.
Disclaimer: This analysis is for educational discussion only and is not financial advice. Always do your own research and manage risk before trading.
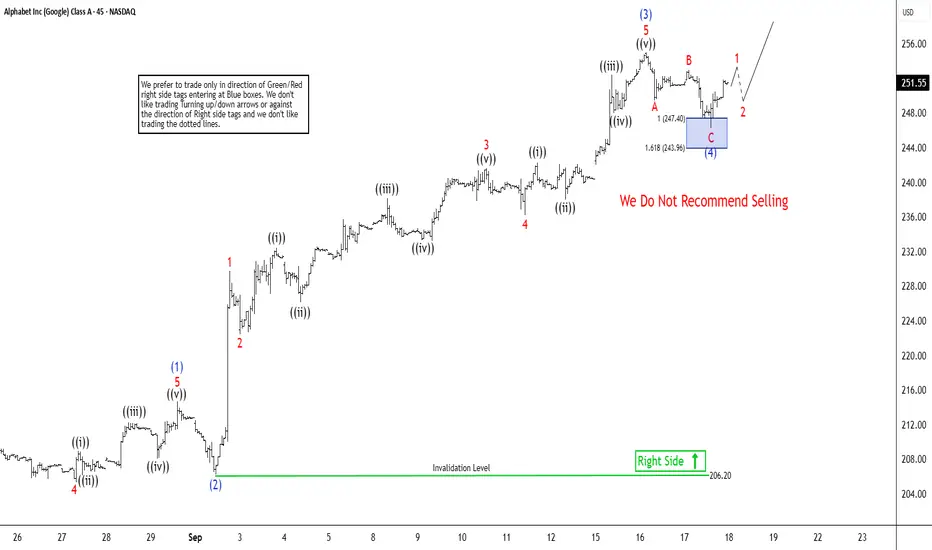
Elliott Wave Analysis: Google (GOOGL) Targets Wave (5) at $257The short-term Elliott Wave analysis for Alphabet Inc. (GOOGL) indicates that the cycle starting from the August 20, 2025 low is unfolding as a five-wave impulse. From that low, wave (1) concluded at $214.65, followed by a pullback in wave (2) that ended at $206.19. The subsequent wave (3) advanced in a five-wave impulse structure on a smaller scale. From wave (2), wave 1 peaked at $229.75, and wave 2 retraced to $222.44. The stock then surged in wave 3 to $241.66, with wave 4 correcting to $236.25.
The final leg, wave 5, reached $255, completing wave (3) on a higher degree. A pullback in wave (4) likely concluded at $246.28, structured as a zigzag. From wave (3), wave A declined to $249.47, wave B rallied to $253, and wave C fell to $246.28, finalizing wave (4). The stock has since resumed its upward trajectory in wave (5). However, it must break above the wave (3) high of $255 to eliminate the possibility of a double correction. In the near term, as long as the pivot at $206.19 holds, any pullback should find support in a 3, 7, or 11-swing sequence, setting the stage for further upside.