TSLA breaking out a rangeI think TSLA is moving up
The 1D timeframe show us how it was on a range and a few days ago started to go up
Next lvl should be 450, but also can go to 480
What do you think?
Bullish or bearish?
Do you see the bull flag?
Also the size and shape of candles remember me to a bullish movement.
When you see candlesticks all the day, everyday, you can see a pattern!
Lol
4TSLA trade ideas
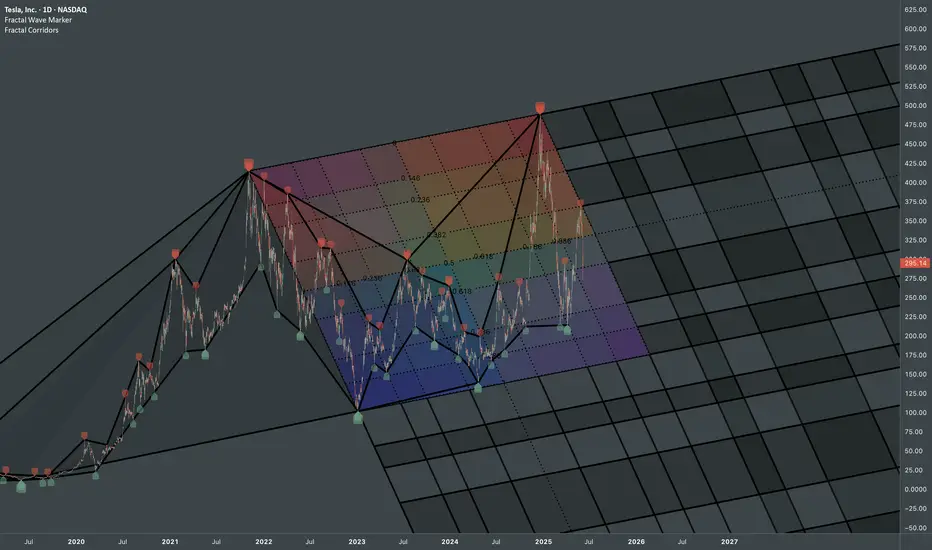
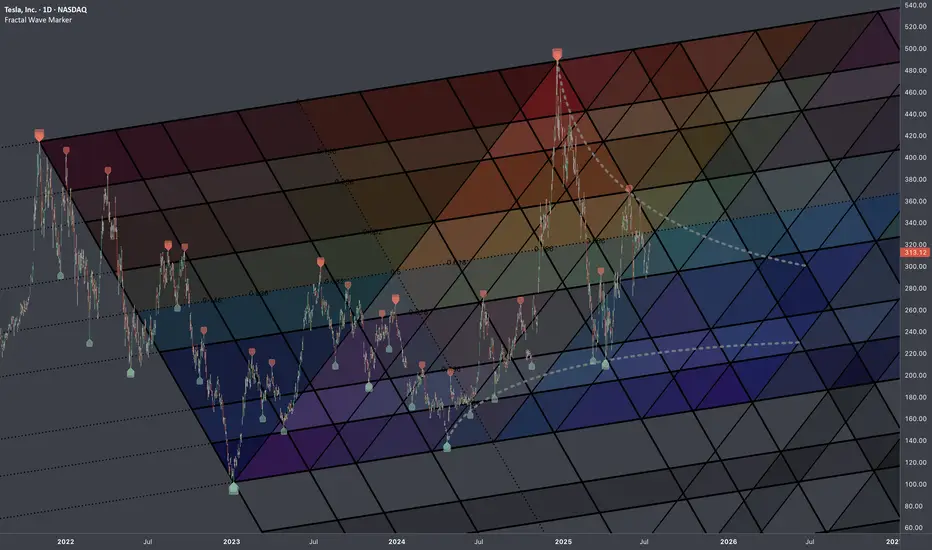
Tesla: Interconnected ATHsStructural update to:
Chronologically connecting pivots via fib channels creates a probabilistic map that captures the rhythm and scale relationships inherent in systematic price movements.
Fractal Wave Marker & Fractal Corridors were used to transform raw price data into a coherent, multiscale structure. Combo of those indicators makes you actually pay attention to ongoing patterns and get an idea how formations on smaller scale can be part of a bigger structural narrative.
Tesla: Robotaxi Hype and Breakout WatchNASDAQ:TSLA surged nearly +10% today, driven by growing anticipation around the upcoming robotaxi unveiling on August 8.
Investors are positioning early, speculating this innovation could open new revenue streams for Tesla and redefine mobility.
📊 Technical Setup:
• Price broke out of local resistance near $330
• Approaching major resistance at $370–371 (Bollinger Band + prior support)
• If $370 is broken and held, the stock could enter a new trading range: $370–$440
• RSI and Stochastic are heating up, but no signs of reversal yet
⚙️ Robotaxi Catalyst:
• Elon Musk confirmed the Robotaxi event set for August 8
• Analysts speculate this could boost valuation through AI and self-driving revenue potential
• Option volume and retail interest are rising fast
📌 Levels to watch:
• Breakout level: $370
• Target: $440
• Support zone: $330
• Invalidation: Close below $310
👀 Watch for pre-event momentum. A break above $370 could trigger a squeeze.

Tesla on Track – Golden Zone Respect Leading to $867 TargetAs we discussed in the earlier setup, Tesla retraced beautifully into the golden zone (62–79% retracement area) after sweeping sell-side liquidity. This zone aligned with a higher-timeframe order block, providing strong confluence for a bullish reaction.
The price has since respected that golden zone, confirming buyers stepped in aggressively and validating the bullish bias. From here, the market structure points toward continuation to the upside, with immediate targets at prior buy-side liquidity pools, eventually extending toward the $867 region, a level that aligns with the 100% Fibonacci projection and liquidity resting above previous highs.
This setup illustrates a textbook ICT/SMC play:
Liquidity Sweep ✅
Golden Zone Respect ✅
Strong Bullish Reaction ✅
Clear Buy-side Targets Ahead ✅
If momentum holds, Tesla remains positioned for a multi-month expansion leg toward the $867 target zone.
⚠️ DYOR: Not financial advice. Always confirm setups with your own framework and risk management.

$TSLA Approaching Noisy Area?Tesla has been on a tear the past 2 days. It's difficult to catch the top and I may be wrong, but we're approaching a noisy area when following the trend line in the daily & weekly chart. I think it will re-trace back downwards.

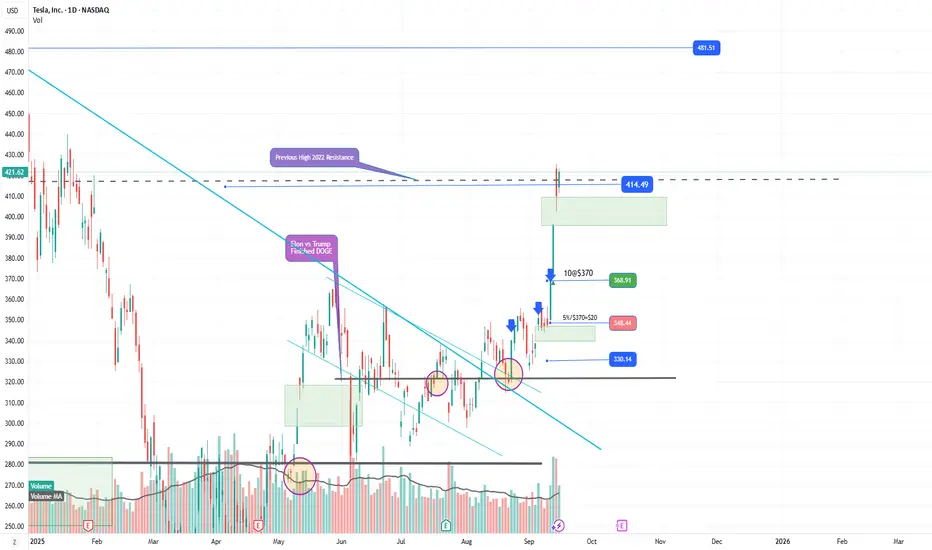
#TSLA Analysis, Elon breaks the Key level ^.^^Elon pours Big Money $$$ into TSLA stock recently causing Rally!
Price has gone up significantly, I don't think it will drop below $400 any time soon.
Strong Greenbar breaks out from the wedge with large volume increases.
Short sellers are getting squeeze out.
More investors are coming to catch smokey train.
Price Target next $480.
Come and join the Rally.
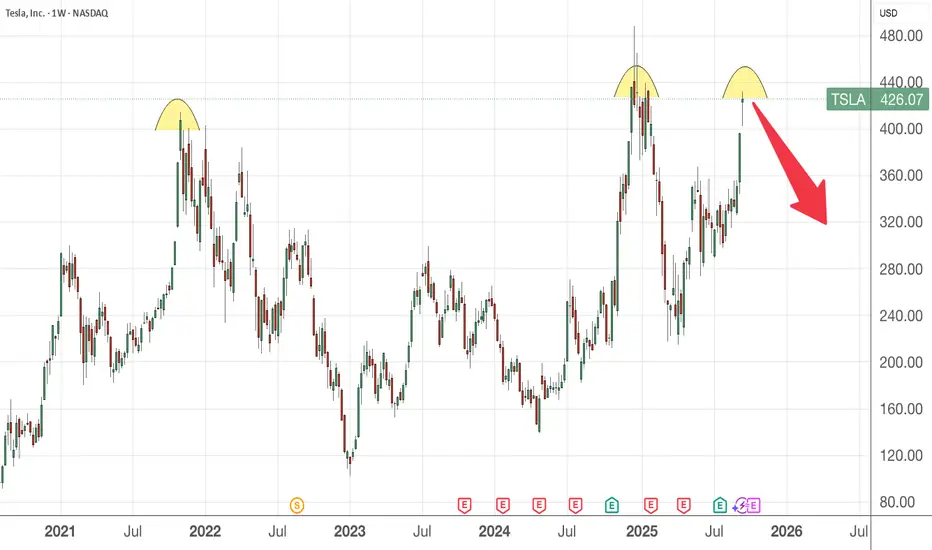
Is it time for TSLA to come down?First thing first, I do not own nor trade this stock. So do take it with a pinch of salt.
From the weekly chart, it seems to display a triple top formation which is bearish in nature. However, market is irrational and though it is highly overvalued, it could still continue to rally if the demand from buyers is there.
SL above 480 and aim for profit target at 299
Tesla: Bullish Momentum Points to $500 Breakout Current Price: $426.07
Direction: LONG
Targets:
- T1 = $450.00
- T2 = $500.00
Stop Levels:
- S1 = $410.00
- S2 = $395.00
**Wisdom of Professional Traders:**
This analysis synthesizes insights from thousands of professional traders and market experts, leveraging collective intelligence to identify Tesla's high-probability trade setups. The wisdom of crowds principle suggests that the aggregated views from professional traders often produce high-quality forecasts. Tesla’s position as one of the most active and closely monitored equities by institutional investors amplifies the importance of consensus-driven strategies in this stock.
**Key Insights:**
Tesla has benefited from its strong electric vehicle (EV) market leadership, underpinning its growth trajectory as the EV industry expands globally. Traders highlight Tesla's ability to maintain robust operational margins despite headwinds such as rising commodity and transportation costs. Tesla’s ambitious Full Self-Driving (FSD) vision and upcoming AI developments have sparked significant enthusiasm among tech-focused investors, bolstering its long-term growth outlook.
From a technical perspective, Tesla is trading above its 50-day and 200-day moving averages, signaling upward strength. Recent trading volumes show consistent institutional accumulation, and the Relative Strength Index (RSI) remains below overbought levels, confirming room for continued upside. Professional traders expect Tesla to test the $450 level in the coming sessions, with the $500 mark identified as the next major extension point.
**Recent Performance:**
Tesla has demonstrated impressive resilience in 2025, rallying over 30% year-to-date while outperforming many of its peers in both the automotive and technology sectors. This upward momentum has been fueled by strong quarterly revenue growth and better-than-expected production numbers, despite macroeconomic concerns like inflationary pressures and volatile supply chains. Tesla’s recent price movement shows a robust support zone around $400, with increasing buying pressure pushing the price toward new highs.
**Expert Analysis:**
Market experts are largely optimistic about Tesla's future prospects, emphasizing the rapidly unfolding EV growth story and Tesla’s early entry advantages. As governments worldwide implement tighter emissions regulations and incentivize clean-energy adoption, Tesla stands out with its scalable production capacity and differentiated market position. Analysts also highlight catalysts such as the Cybertruck launch scheduled for late 2025 and margin expansion driven by cost-saving measures at key Gigafactories.
Technically, experts highlight Tesla’s bullish setup, formed by a series of higher lows and higher highs. Fibonacci retracement analysis places the next major resistance at $450, with $500 highlighted as the psychological and technical breakout point for long-term investors. Tesla’s MACD indicator remains strong, supporting an extended bullish trend.
**News Impact:**
Recent news regarding Tesla's continued success in expanding its market share in Europe and Asia has positively influenced sentiment. Additionally, CEO Elon Musk's statement outlining new advancements in robotics and AI platforms has sparked excitement about non-automotive revenue streams. Tesla's upcoming Investor Day, scheduled for Q4 2025, is likely to introduce updates on strategic innovations, driving higher investor confidence.
**Trading Recommendation:**
Based on Tesla’s technical setup, strong fundamentals, and favorable news flow, a long position is recommended. Traders should consider targeting the $450 level as the first resistance, while $500 serves as the medium-term price objective. Stops should be placed at $410 and $395, reflecting prudent risk management. Tesla’s continued momentum in 2025 makes this trade a compelling opportunity for growth-focused investors.
Do you want to save hours every week? Register for the free weekly update in your language!

$TSLA: Breakout Wave Dimensions🏛️ Research Notes
Apart from known compression patterns for Tesla, there is another squeeze happening on smaller scale:
That area will be processed to derive the chart-based levels and see how market reacts to them.
Triangle
Breakout Expansion

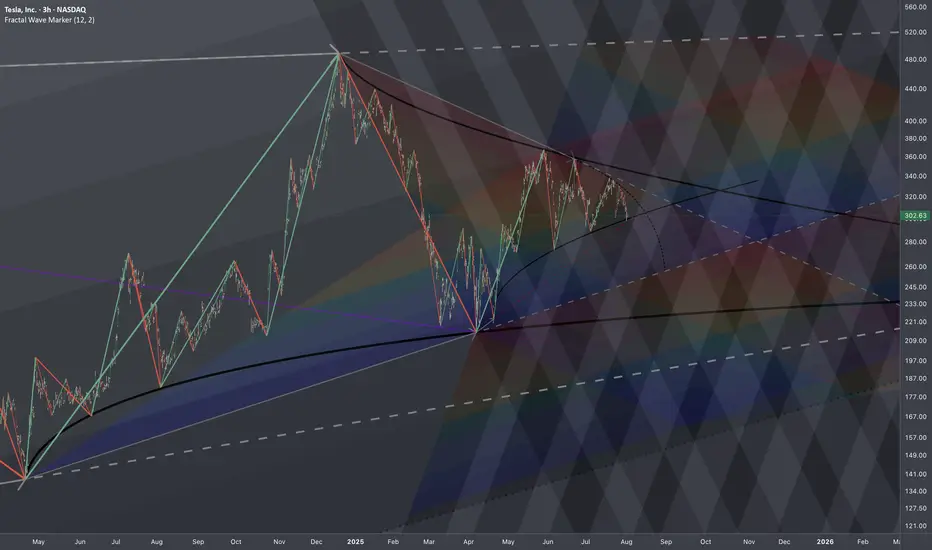
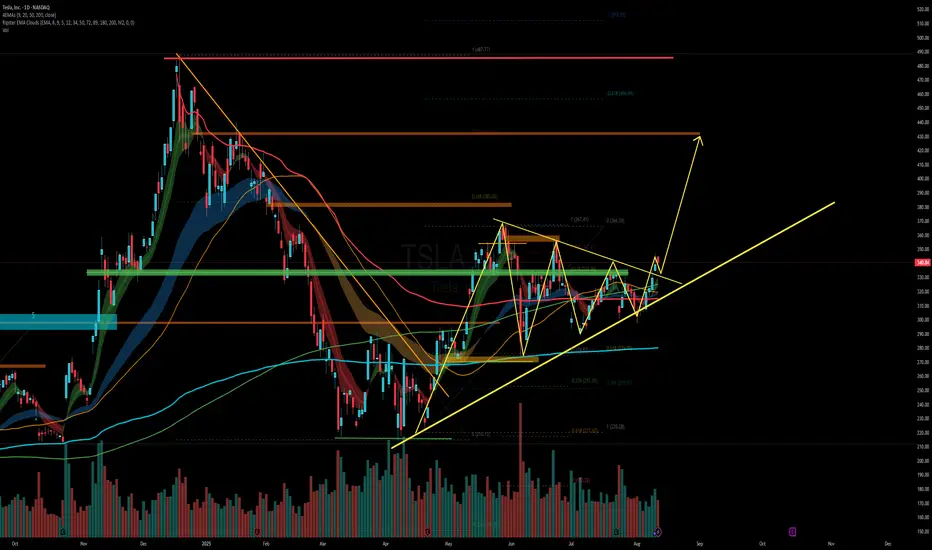
$TSLA: Branching Effect🏛️ Research Notes
Reaching branching effect through cross-cycle interconnection. Alongside I'll test some elements mentioned below.
Local Progressions
Rhyme and levels derived from apparent cycle compression.
Added channels with darkening gradient that cover bullrun from mid 2019, driven by angle of tops.
In the local scope, as price deepens into denser zone the probability of disproportional reaction gets higher. t would probably complete its intermediate and even longer-term cycles before escaping the boundary.
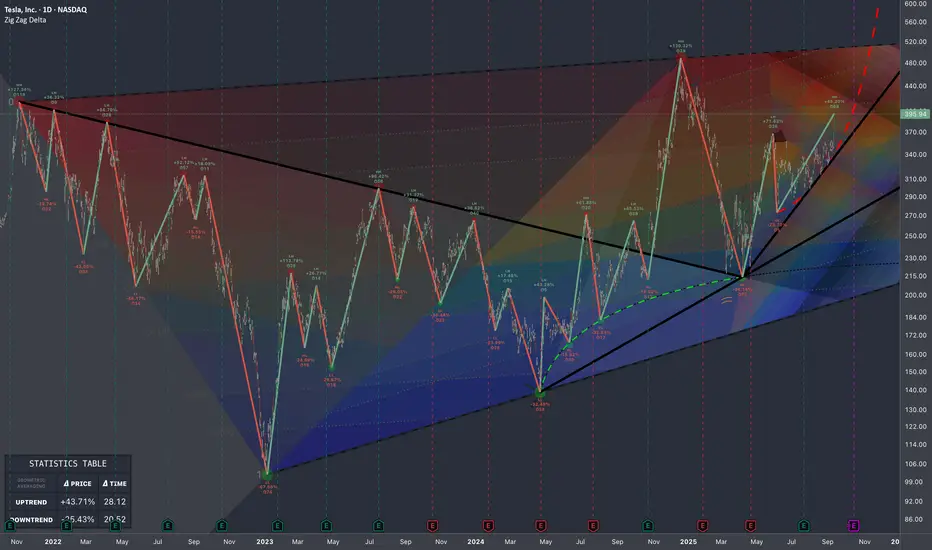
$TSLA: Fib InterconnectionsResearch Notes
Examining interconnection type with regressive angle:
Critical points:
Mapping with 3 fibonacci channels:
TSLA Breakout Above $360 Opens Swing Trade SetupTesla broke the $360 resistance four days ago, a level that had been holding price down for the last 120 days. Once broken, price surged quickly toward the $420 zone.
In my view, if we get a chance to buy again near the 370 green support zone, it would be a great swing trade opportunity — especially with the rising trendline still intact.
🔍 Technical Analysis
Current Price: 420.95
360 acted as resistance for months, now flipped to strong support.
Green zone (360–375) aligns with the uptrend, key area to watch for re-entry.
🛡️ Support & SL
🟢 370 zone | SL: 345
🧭 Outlook
Bullish Case: Hold above 370 → continuation toward 450–475.
Bearish Case: Break below 345 → deeper correction.
Bias: Bullish while above 370.
🌍 Fundamental Insight
Valuation: Tesla trades at a relatively high P/E ratio (60–70 range) compared to traditional automakers, reflecting growth expectations rather than current earnings.
Revenue Growth: While margins have compressed due to price cuts, top-line growth remains supported by strong EV demand and expansion in new markets.
Innovation & AI: Tesla’s positioning in AI, autonomous driving, and energy storage continues to attract investor optimism beyond just vehicle sales.
Risks: Competition from other EV makers and margin pressure are key risks investors are watching.
✅ Conclusion
Tesla’s breakout above 360 ended months of pressure. A pullback into the green support zone would be a strong swing entry with trendline confluence. While valuation is stretched versus peers, bullish momentum and growth expectations continue to support the stock.
⚠️ Disclaimer
This analysis is for educational purposes only and does not constitute financial, investment, or trading advice.

$TSLA Financials: Q2 vs Q1🏛️ Research Notes
A climb to even sub-ATH levels signals profound market irrationality, implying Tesla not only recovered its losses but has also reversed a widespread, likely permanent, client boycott across its key markets (US, EU, Canada). The closer examination of Q2 fundamentals ahead of the Q3 2025 release would be a great help.
⚖️ Q2 vs Q1
Revenue Decline : Revenue fell -12% YoY, automotive sales down -16% → confirms weakness in U.S., EU, and China.
Gross Margins : Erosion continued as price cuts + BYD competition intensified.
Operating Income : Dropped -42% YoY, reflecting higher expenses + lower leverage.
Net Income : Down -16% YoY → analysts’ earnings downgrades justified.
Cash Flow & Liquidity : Free cash flow fell, inventory buildup worsened liquidity strain.
Balance Sheet : Inventory levels rising as deliveries lag production.
Short-term : Bounce faces major resistance near supply zones — failure to break higher could trap late buyers.
Mid-term: With Q2 confirming Q1 risks, the bull case weakens unless Q3 shows clear recovery in demand and margins.
Long-term: Competitive pressures (BYD, Chinese EVs, European slump) + high CapEx needs keep pressure on liquidity and valuation.
🛟 What to Watch in Q3
Delivery Numbers : Any rebound in U.S., China, or Europe sales will be critical to reversing revenue decline.
Margin Stabilization : If Tesla can offset price cuts with cost savings or improvement in production efficiency
Cybertruck Performance : Demand recovery and reduced recall issues are needed to restore confidence in new models.
Inventory Levels : Watch if inventory growth slows - otherwise more discounting and margin erosion likely.
Cash Flow Trends : Improvement in operating cash flow would ease liquidity fears.
CapEx & R&D : How much Tesla spends on batteries, autonomy, and AI vs. how much cash it burns will be closely watched.
Institutional Sentiment : If big funds divest, rallies may keep fading at resistance.
Tesla’s bounce still looks more like a retail-driven relief rally than the start of a sustainable reversal. Q2 earnings show deterioration across key financial metrics. In Q3, watch whether Tesla can stabilize sales, margins, and cash flow failure to do so keeps the path of least resistance to the downside.
TSLA Sep 23 – Bulls Testing 440, Gamma Fuel Could Stretch This MPrice Action & Setup (1-Hour Chart)
TSLA pushed from the mid-420s and tagged 440 intraday before easing into a tight sideways drift around 436. Price is riding the lower rail of an ascending channel that started last week. Key intraday support is stacked near 433 and 426; a deeper flush could revisit 417.5. Holding above 433 keeps the short-term trend intact and gives bulls a clean springboard for the next leg.
Momentum Read
MACD on the 1-hour is still positive though histogram bars are tapering—classic sign of a healthy pause rather than a breakdown. Stoch RSI hovers near 80, so a quick reset or sideways chop would help build energy for another push.
GEX (Options Flow) Confluence
Options positioning leans bullish and matches the chart:
* Highest positive GEX / Call resistance: ~436
* 2nd Call Wall: ~450 (near 70% call concentration)
* 3rd Call Wall: ~457.5–460
* Main Put Defenses: 417.5, 410, 405 and a big floor at 400
If TSLA can stay north of 436, market makers may keep hedging upward, creating a gamma squeeze potential into 450 and beyond. A clean break below 433 would start unwinding that gamma and bring 417.5 into play.
Trading Plan
* Upside scalp: Buy strength on a 440 break with a first target at 450 and a trailing stop under 433.
* Retest entry: If we dip to 433–426 and bounce with volume, that’s a low-risk reload spot aiming again for 440+.
* Bear hedge: Below 426 with heavy sell volume, short toward 417.5 makes sense.
Option Angle
For bullish plays, short-dated calls around the 440–450 strikes look attractive if 436 holds and IV stays reasonable. For hedging or quick shorts, puts near 417.5 or 410 work if a breakdown confirms.
Bottom Line
Trend bias stays up as long as TSLA holds 433–426. A strong hourly close over 440 could pull in more gamma fuel toward 450–457. Fail that zone and expect a deeper check toward 417.
Disclaimer: This is for educational discussion only and not financial advice. Always do your own research and manage risk.

I am bullish on TSLAI have not changed my buy bias for this baby.
II will continue adding TSLA to my portfolio with $360 and $400 as my medium-term take profits.
Share your thought.
If you found this helpful, like, follow and share

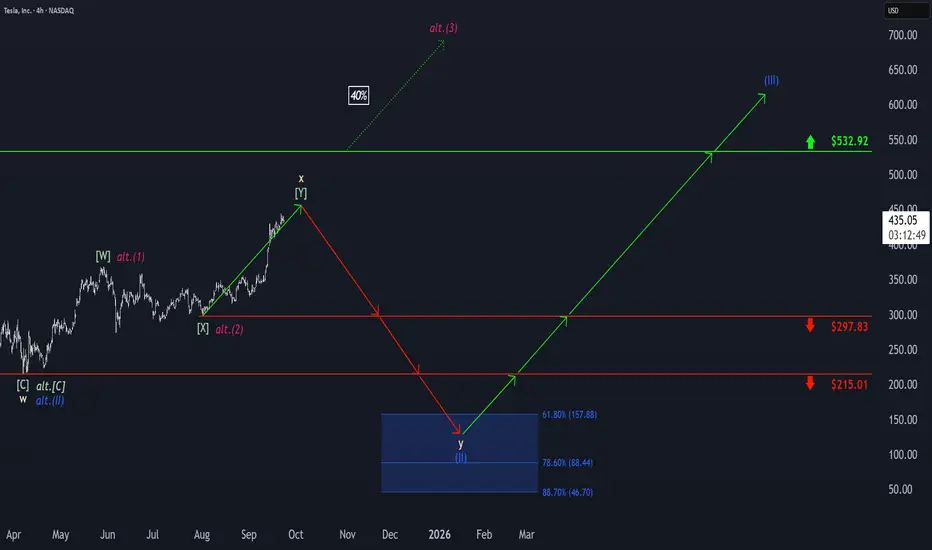
Tesla: Upward Momentum PersistsTesla’s upward momentum has persisted, with the beige wave x still having some room to run. However, we expect the corrective top to form well below resistance at $532.92, which should then trigger the final selling phase within the broader correction. Ultimately, wave y is projected to approach our blue Target Zone between $157.88 and $46.70, completing the large blue wave (II) in that range. Afterward, we anticipate a new wave (III) uptrend. That said, there remains a 40% probability that price may not reach the blue zone, as wave alt.(II) could have already completed at $215.01. In this scenario, TSLA would already be developing a magenta upward impulse and could break above the $532.92 level directly and sustainably.
Tesla (TSLA) BUYTesla (TSLA) is best known for electric cars, but its future depends on AI. From self-driving vehicles to its Optimus humanoid robot, Tesla is an AI-first company disguised as an automaker.

Will Tesla's stock price reach $600? Yes!
Hi my dears
I am at your service with Tesla stock analysis. This year and the following years, the stock growth trend will continue.
If you want to make big profits from the market, just follow my analysis.

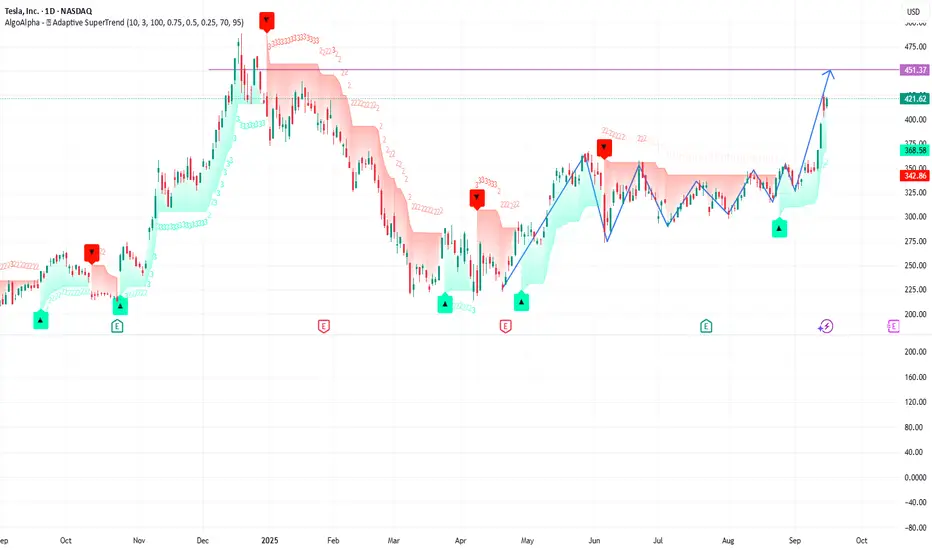
TSLA - is it the time for Fireworks ?TSLA - huge base, many breakout failures due to news.
Let's see if this time it sustains this bullish move.
TSLA support $324.48 has to hold for longTSLA bounced off $35 range support this morning on 4 hour was oversold. Needs to hold $324.48 bottom of uptrend support to see wave 5 target of $426 otherwise the trade is no longer valid and will need to wait for another support and oversold condition to go long

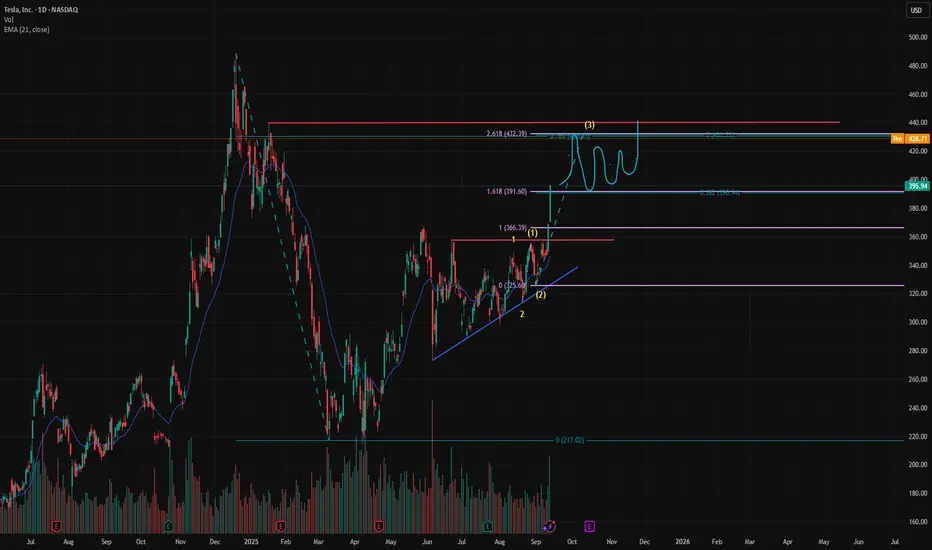
$TSLA first target $430-$440 rangeNASDAQ:TSLA 2.618 extension is at $432. Expecting a consolidation from this range, when I'll be adding to my position.
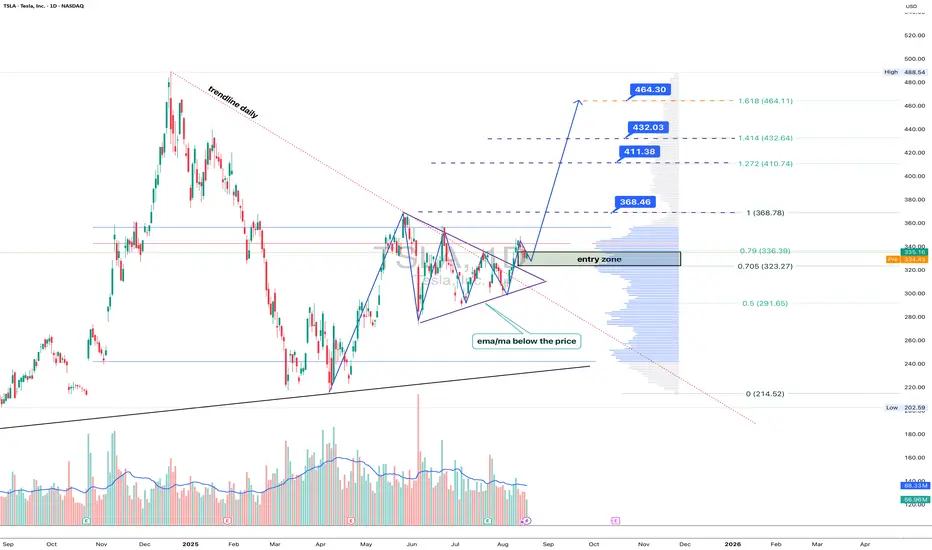
Tesla: breakout mode, Elon’s rocket fuel for the chartTechnically , Tesla broke out of a symmetrical triangle while holding above EMA/MA supports, which confirms bullish control. The breakout unlocks targets at 368.46 (Fibo 1), followed by 411.38, 432.03, and the 1.618 extension at 464.30. Volume profile confirms strong accumulation below, leaving the upside path less crowded.
Fundamentally , Tesla keeps investor attention alive. EV sales stabilized, but the focus has shifted to AI and robotaxi — Musk’s latest promises of disruption. With Fed rates peaking and yields easing, growth stocks regain momentum. Risks remain from Chinese competitors, yet Tesla’s margins are still leading the industry.
Tactical plan : entry zone stands at 323–336. As long as price holds above it, buyers target 368.46 → 411.38 → 464.30. A break below 323 would flip the bias back toward 291.
Bottom line: Tesla’s chart looks ready for lift-off. Musk might be dreaming of Mars, but for now, bulls are happy if he just launches the stock a few hundred dollars higher.
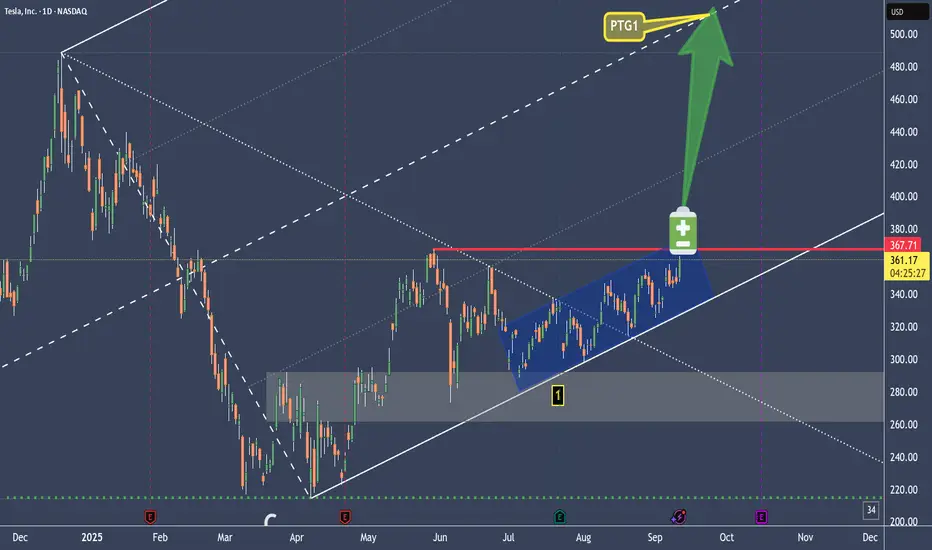
TSLA Battery Is still loading - May the Energy be with you.We see the slanted coil.
It act's like a Battery loading energy.
At one time it will expend it's energy, either up, or down.
Forks show the most probable path of price.
Forks provide a framework, where a Trader doesn't have to guess. Just trade the rule-book and follow your one plan.
Either we get stopped or we are happy Teslonians.
May the Energy be with you §8-)