PYPL | PayPal - They said it would pump!!!!NASDAQ:PYPL
They said it would pump.
...but all it did was dump.
On X they said PayPal would moon!
I got suckered again
...like a buffoon.
Should I add at the support line ahead!??!?
...No. I think I'll sell low instead.
Trade ideas

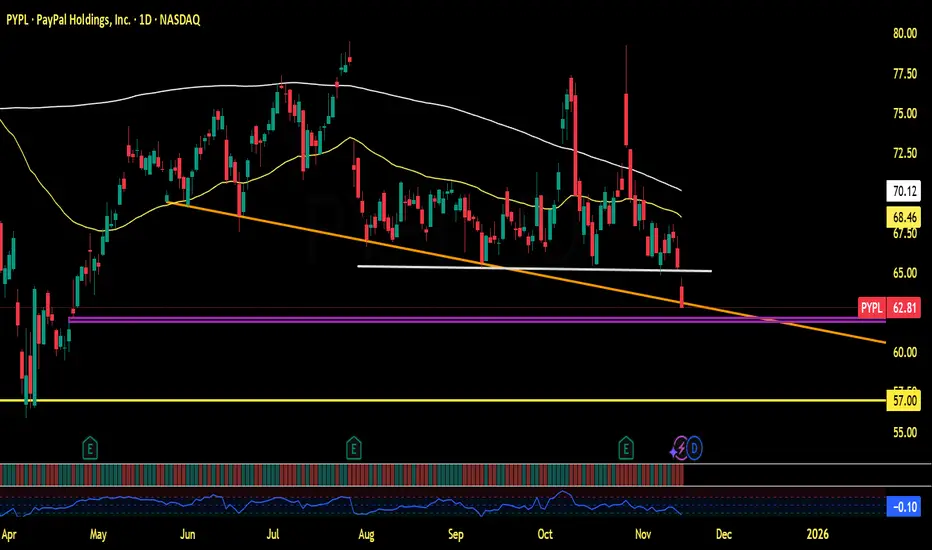
$PYPLAt the close NASDAQ:PYPL Below all trendlines with bearish candle headed towards small gap. Bears in control causing No reversals during Thursday's & Friday's carnage. Watch for a Support (from Aug. 2023) at $57.
Why $PYPL is the most undervalued play right nowMy DD on why NASDAQ:PYPL is the most overlooked opportunity in the market right now. 👇
The narrative on PayPal has been bearish for two years, but the data tells a completely different story. I overlaid Net Income (Green Line) against the Price Action to find the truth.
1️⃣ Why it crashed (The Context) Looking at 2022, the massive drawdown in share price made sense. Fundamental earnings took a massive hit. The market is efficient; when money stops flowing, the price drops.
2️⃣ The Recovery (The Reality) Fast forward to today. That "earnings problem" is gone.
Earnings have not only normalized, but they are also on track to generate the highest annual net income in the company's history.
The green line on my chart is making higher highs, signaling a full fundamental recovery.
3️⃣ The Disconnect Here is the alpha: The stock price hasn't realized the company is fixed. We are trading at 2018 price levels while generating record-breaking 2025 income levels.
The Verdict: The 2022 fear is still pricing this stock, ignoring the 2025 reality. I'm betting the gap between that green line (income) and the candles (price) is going to close soon.
NASDAQ:PYPL is back. 🐂

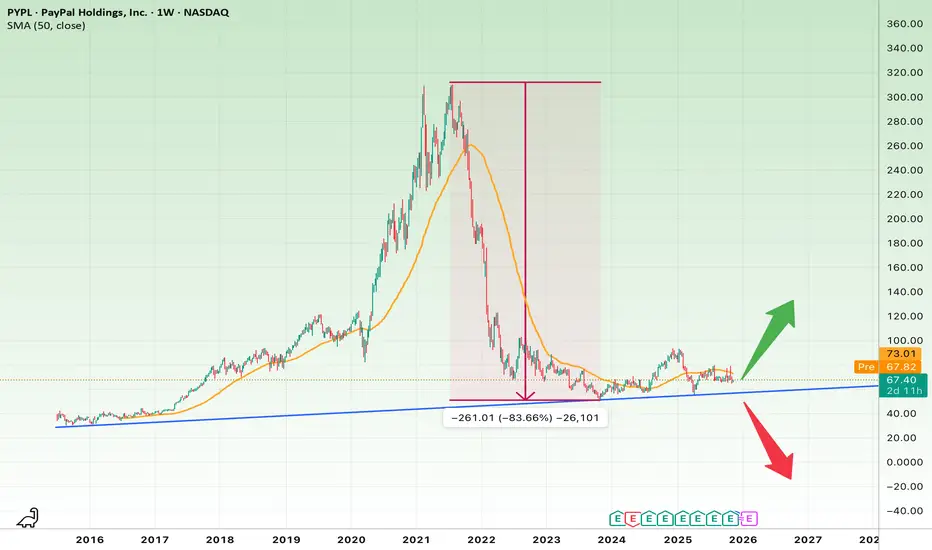
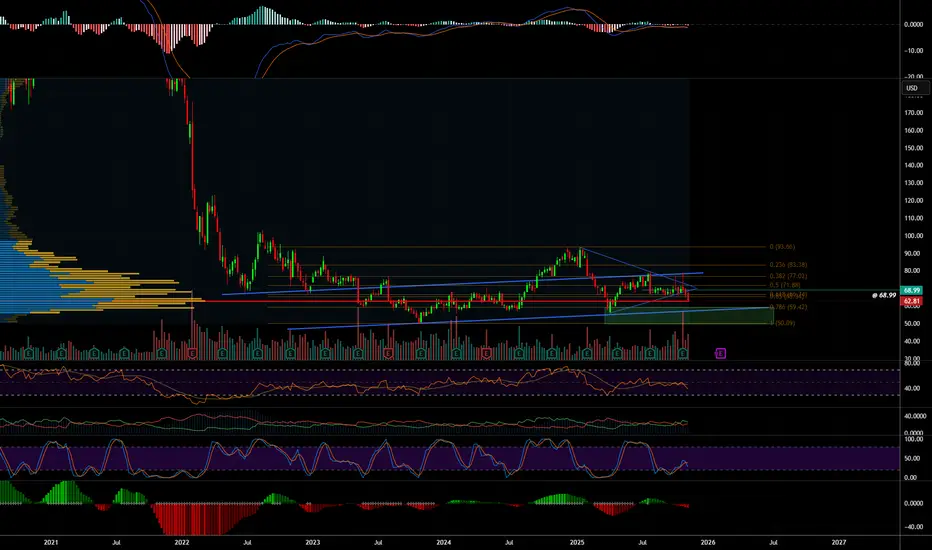
PayPal Down 83% from All-Time High — A Major Reversal Setup?PayPal has corrected massively from its 2021 high ($310) to around $66, sitting exactly on a multi-year ascending trendline that has held since 2016.
Bullish Case:
• Holding above $60–65 keeps the structure intact.
• Upside targets: $85 → $110 → $140.
Bearish Case:
• Losing $60 opens the door to $45 and possibly $35.
Conclusion:
PYPL is testing a “make or break” zone. Staying above this blue trendline could mark the start of a multi-quarter recovery.
PayPal: Further Downside ExpectedPayPal initially extended its decline as anticipated, before a modest upward rebound began to emerge. Overall, bearish momentum should primarily persist, likely pushing price below the $50.18 support level and completing the broader correction of the beige wave II. However, there is also a 39% probability that beige wave alt.II has already concluded. In that scenario, the stock would currently be developing a magenta upward impulse and would be in the process of forming (or would have already formed) the low of wave alt. . Wave alt. would then bring further gains, potentially breaking through resistance at $94.97.

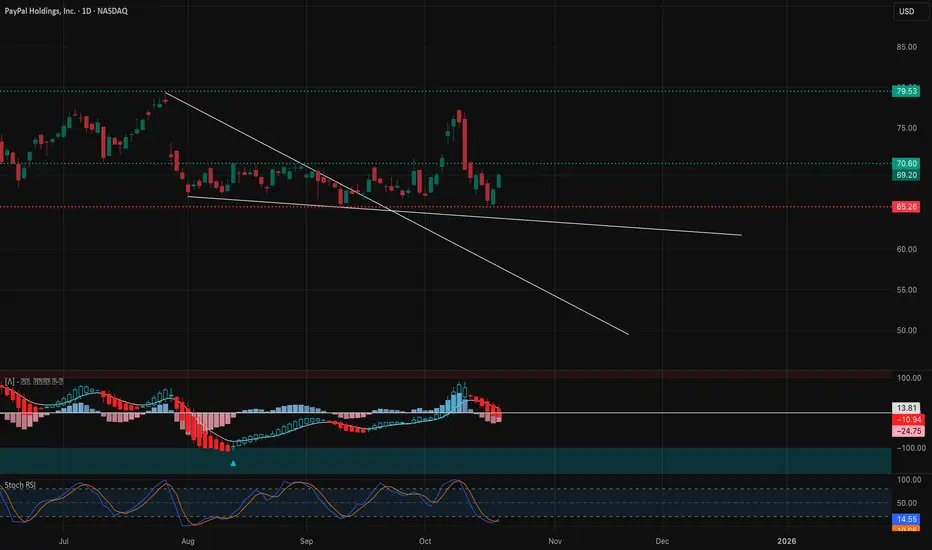
PYPL Range: Bounce or Breakdown Toward 75/61PYPL on the 1D chart remains a textbook rectangle, coiling after months of sideways trade. Price is back at the lower boundary near $65.50 with short-term momentum tilted bearish and all key MAs overhead. The MA20/60/120 are tightly clustered around $68.57–$70.63, reinforcing a heavy supply band. Volatility has contracted after October’s spike, so a decisive move from this squeeze looks close.
Primary path: neutral-to-range bias with a tactical bounce off the $65.50–$66.50 demand zone. A daily close back above the MA20 (≈$68.60) would be the first tell, while a daily close >$68.90 strengthens the case for a push into the $69.00–$70.50 cluster and a retest of $75.00. A sustained break and hold above $75.00 would transition the structure toward a fresh up-leg.
Alternative: failure at support. A decisive daily close <$65.20 would confirm a range breakdown and open $61.00. For positioning, keep the line in the sand tight: long ideas are invalid below $64.70; short ideas lose edge above $79.50. Until a break, respect the range—fade extremes and be disciplined with size, as volume on any breakout should be the confirmation cue.
This is a study, not financial advice. Manage risk and invalidations
PYPL in BUY ZONEMy trading plan is very simple.
I buy or sell when at either of these events happen:
* Price tags the top or bottom of parallel channel zones
* Money flow volume spikes beyond it's Bollinger Bands
So...
Here's why I'm picking this symbol to do the thing.
Price in buying zone at bottom of channels
Money flow momentum is spiked negative and under bottom of Bollinger Band
Entry at $63.00
Target is upper channel around $69.00
Paypal bullish good news however i dont know about long termI wouldnt trade paypal just doing it for a friend it might take some time.
based on my point of view paypal is an old company that was replaced with apple pay and cashapp/square

PayPal $PYPL - LONG | Orbis InvestmentPayPal NASDAQ:PYPL - LONG | Orbis Investment
Entry: 66.44
TP: 77.36
SL: 63.35
RR: 3.53

Sold Half PYPL. Raised Stops.Trading Fam,
Recently, you may remember, my new indicator triggered a BUY alert on quite a few stocks. Paypal was one of them. I entered this trade at around $69 dollars with a moderate target of $79 for a 1:2 rrr. We've nearly reached that target today. So, I've sold half, taken profit, raised my stops, and I'll let the rest ride. You know where to track the remainder of my trades.
Congrats to those who followed me. We've now won the last 13 of 13 trades for an avg. profit of 37%. As I continue to grow in experience with my indicator, we will only get better.
✌️Stew

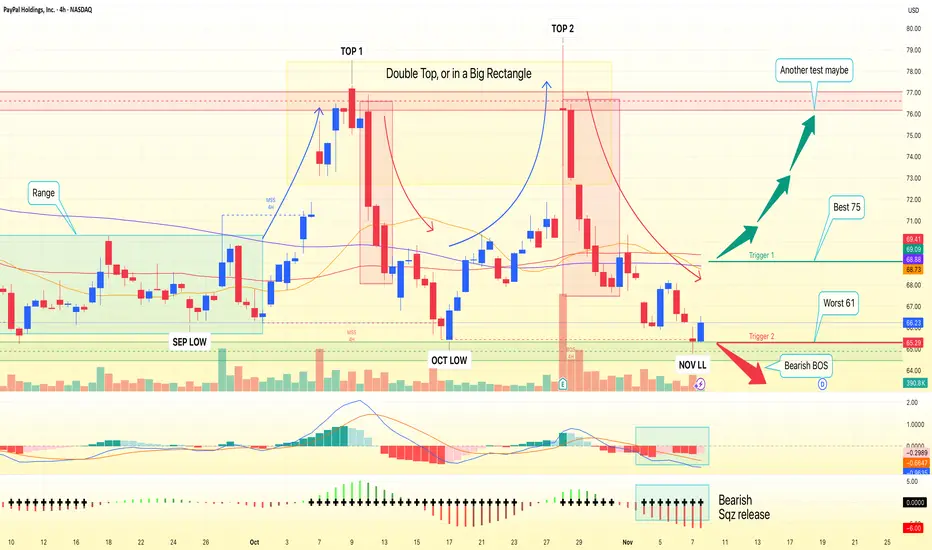
PayPal Under Pressure! Bearish WMA Break Signals Downside🎯 PYPL: The "Weighted MA Breakout Heist" 💰 | Bears Taking Control
📊 Asset Overview
PayPal Holdings Inc. (NASDAQ:PYPL) - Digital payments heavyweight showing bearish signals after weighted moving average breakdown.
🔍 The Setup: When Moving Averages Tell Tales
The chart's singing a bearish tune, folks! 🎵 We've got a Weighted Moving Average breakout to the downside — and when WMA breaks, it usually doesn't ask for permission to keep falling. Think of it like gravity... but for stock prices! 📉
💡 Trade Blueprint
🚪 Entry Zone
Flexible entry approach - Current market price works as entry. The beauty of this setup? The trend is your friend, so catching this wave at various levels could work. Just don't chase it blindly!
💭 Pro Tip: Scale in rather than going all-in at once. Dollar-cost averaging on the way down can be your best friend in bearish plays.
🛡️ Risk Management (The "Safety Net" Level)
Stop Loss: $68.00 🚨
Look, I'm calling this the "thief SL" because if price touches this level, you need to exit stage left — no questions asked! This isn't financial advice, just a technical level where the bearish thesis breaks down.
⚠️ Important: Set YOUR OWN stop loss based on your risk tolerance and account size. This is just a technical reference point, not a commandment carved in stone!
🎯 Profit Target (The "Escape Route")
Target: $60.00 💵
Why $60? Three compelling reasons:
📍 Moving Average Support Zone - Historical MA convergence area
📉 Oversold Territory - RSI/momentum indicators suggest potential bounce zone
Liquidity Trap Alert - Big money often parks orders here
⚠️ Reality Check: Markets don't move in straight lines. Take profits along the way! Suggested approach: Scale out 30% at $63, another 40% at $61.50, and let the final 30% ride to $60.
🔗 Related Pairs to Watch (Correlation Play)
Keep your eyes on these tickers — they often move in sympathy with PYPL:
SET:SQ (Block Inc.) - Fellow fintech, similar payment space dynamics 🔄
$V (Visa) - Traditional payment processor, inverse correlation during fintech weakness 💳
NYSE:MA (Mastercard) - Same logic as Visa, watch for divergence 🏦
NASDAQ:COIN (Coinbase) - Crypto exposure correlation with digital payment sentiment 🪙
NASDAQ:SHOP (Shopify) - E-commerce correlation, PYPL's merchant base overlap 🛒
Key Correlation Note: When fintech stocks sell off, traditional payment processors often see inflows. Watch the $V and NYSE:MA strength as potential confirmation of PYPL weakness!
📈 Technical Highlights
✅ Weighted Moving Average breakdown confirmed
✅ Volume supporting the bearish move
✅ Lower highs and lower lows pattern forming
✅ Key support zones identified below
✅ Risk-reward ratio favors the short side
⚡ The "Thief Style" Philosophy
This isn't about being greedy — it's about being strategic! 🎭 We identify the setup, execute with precision, and exit with profits before the crowd realizes what happened. That's the art of tactical trading!
Remember: The market doesn't care about your opinion. Price action is king 👑
✨ If you find value in my analysis, a 👍 and 🚀 boost is much appreciated — it helps me share more setups with the community!
#PYPL #PayPal #DayTrading #BearishSetup #TechnicalAnalysis #MovingAverageBreakout #SwingTrading #StockMarket #TradingView #ThiefStyle #PriceAction #RiskManagement #Fintech #NASDAQ #ShortSetup #TradingStrategy #ChartAnalysis #MarketAnalysis #TradingIdeas #StockTrading

$PYPL - Paypal: A Value Investing ApproachIs Paypal a Value Trap or a Gift at these levels?
We've begin to Dollar Cost average our way in. While we still expect more downside in the market at the moment, this is a long term play 1-2 year buy and hold. Remember, PayPal announced on October 28, 2025 that it will integrate with OpenAI’s “Instant Checkout” feature via the “Agentic Commerce Protocol” (ACP), so ChatGPT users will be able to complete purchases using their PayPal wallet directly within ChatGPT. This is a massive announcement if it plays out how they believe it will.
DCF models from multiple analysts peg intrinsic value between $90–$100 per share, implying 30–50% upside if PayPal maintains moderate growth and margins. Relative valuation supports this, with a P/E around 12x, below the fintech industry average, suggesting the market may be overly discounting near-term challenges. The company continues to generate strong returns on equity (~24%) and free cash flow, indicating it still earns well above its cost of capital.
While PayPal currently pays no dividend, its consistent share buybacks enhance shareholder yield. The market’s pessimism largely reflects competitive and regulatory fears, yet the business maintains a global brand, massive user base, and network effects that competitors struggle to replicate.
For a long-term, fundamentals-driven investor, these factors point to a mispriced quality company trading at a steep discount. Assuming stable execution, PayPal offers a compelling risk/reward profile and could deliver 40–70% upside over the next 3–5 years, making it a buy for value investors seeking both capital appreciation and margin of safety.
Disclaimer:
I do not provide personal investment advice and I am not a qualified licensed investment advisor. I am an amateur investor.
All information found here, including any ideas, opinions, views, predictions, forecasts, commentaries, suggestions, or stock picks, expressed or implied herein, are for informational, entertainment or educational purposes only and should not be construed as personal investment advice. While the information provided is believed to be accurate, it may include errors or inaccuracies. I will not and cannot be held liable for any actions you take as a result of anything you read here.
Conduct your own due diligence, or consult a licensed financial advisor or broker before making any and all investment decisions. Any investments, trades, speculations, or decisions made on the basis of any information found on here, expressed or implied herein, are committed at your own risk, financial or otherwise.
Feel free to give us a follow and shoot us a like for more analysis updates.
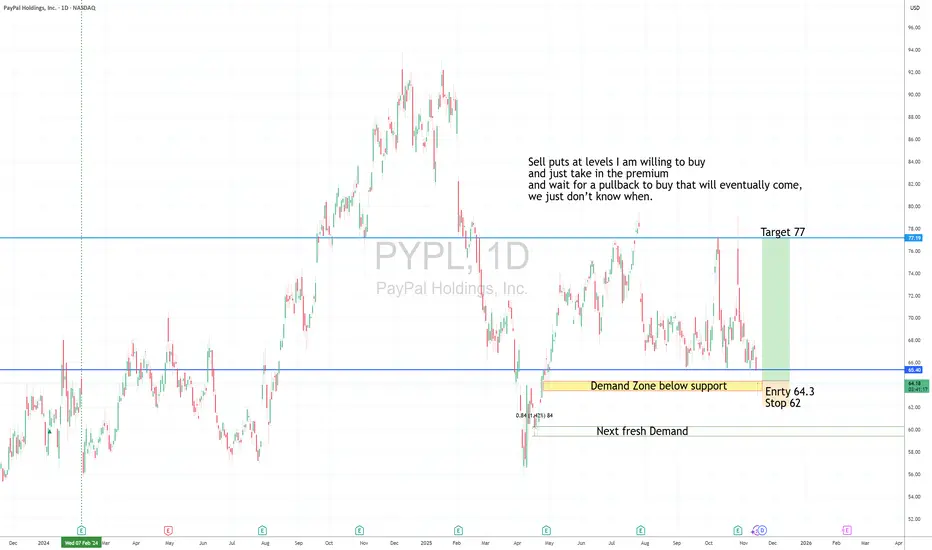
PYPL LongDemand Zone below Support
Long entry 64.3
if buy stock , stop 62
Target 77
Risk management is much more important than a good entry point.
I am not a PRO trader.
In my trading plan, the Max Risk of each short term trade should be less than 1% of an account.
Sell put at next demand Zone:
Sell puts at levels I am willing to buy and just take in the premium,
and wait for a pullback to buy that will eventually come, we just don’t know when.
$PYPLreclaim and retest of the 7 ema on the weekly
has been in this range since April 22
time to run it back
as long as we do not accept below white line we are golden
time frame a few years
its almost time imo

Breaking: Paypal ($PYPL) Gearing for A 500% Breakout PayPal Holdings, Inc. (NASDAQ: NASDAQ:PYPL ) a fintech company is set for a 500% breakout amidst bouncing off of support point setting sail for $300 zone.
As of the time of writing, the stock is up 8% with the RSI at 49, there is more room to capitalize on the low buying pressure.
In recent news, the company is integrating its wallet into OpenAI’s ChatGPT.
Beyond that headline-grabbing news, PayPal’s third-quarter earnings results, released before the market opened, revealed some puts and takes. Several key metrics, such as overall account growth, remained in single-digit territory, with some areas of acceleration in other parts of the business.
About PYPL
PayPal Holdings, Inc. operates a technology platform that enables digital payments for merchants and consumers worldwide. It operates a two-sided network at scale that connects merchants and consumers that enables its customers to connect, transact, and send and receive payments through online and in person, as well as transfer and withdraw funds using various funding sources, such as bank accounts, PayPal or Venmo account balance, consumer credit products, credit and debit cards, and cryptocurrencies.

PYPL cleared gap at $77, creater gap at $71Pypl has closed the gap at $77 but now created a gap at $71. Expect more volatility and a high probability of gap fill.

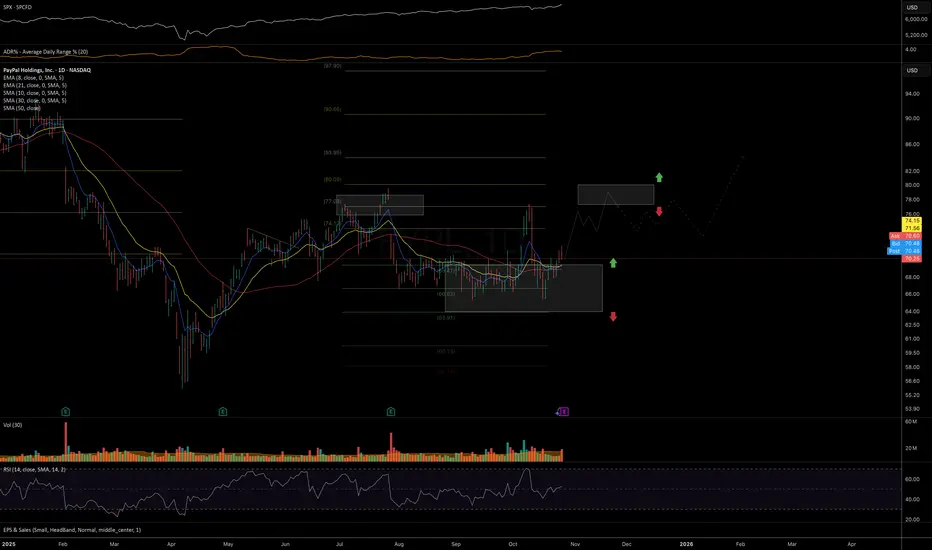
PYPL potential start of a new uptrendPrice may have completed its correction from the July highs and started the first wave of a new uptrend.
As long as the price continues to trade above 65, I expect upside momentum to persist toward the 80 resistance level, likely followed by a period of consolidation and base-building before a more sustainable breakout attempt in the coming months.
Chart:
Previously:
On mid-term resistance (Jul 24):
Chart:
www.tradingview.com
and (Jul 30):
Chart:
www.tradingview.com
On potential bottom (Sep 18):
Chart:
www.tradingview.com
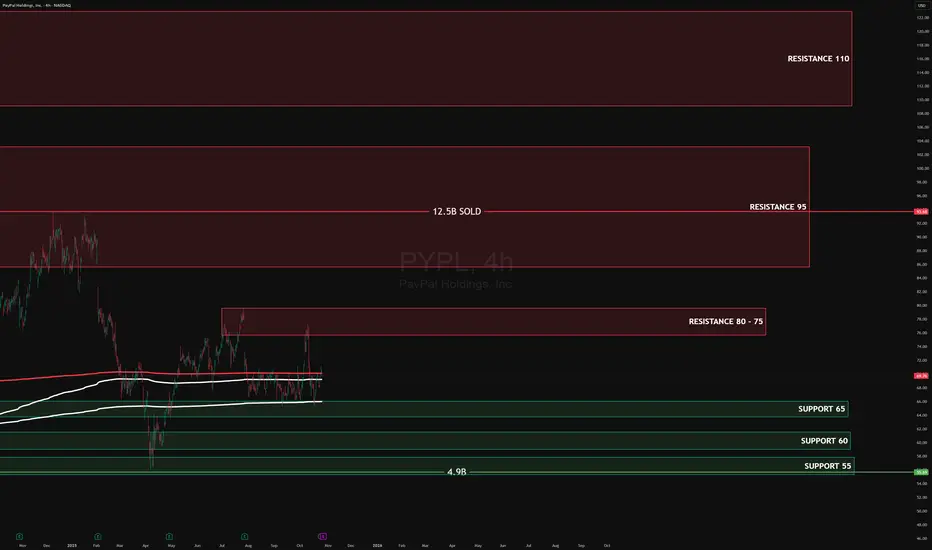
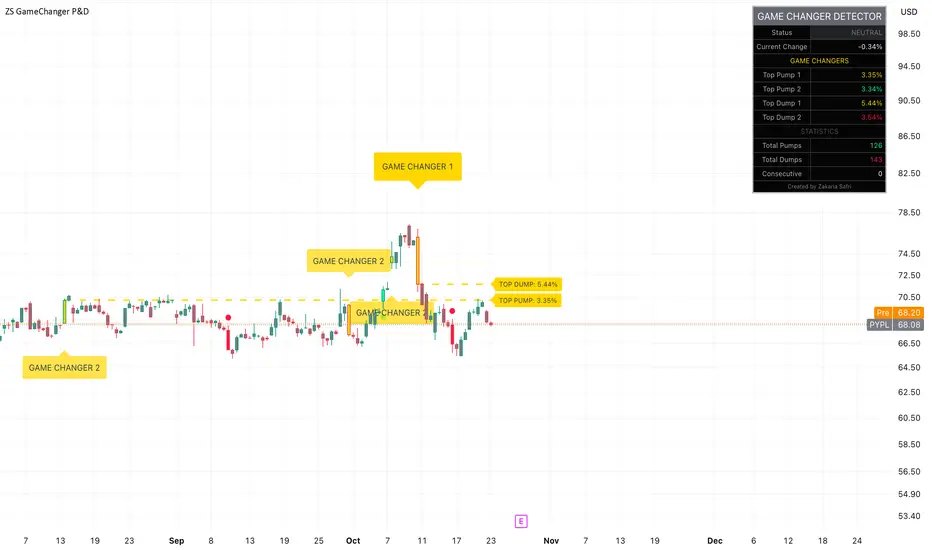
PYPL EARNINGS OCT - 2025PYPL basing above 65 support; 75–80 sell zone capped bounce;
heavy distribution near 95 (12.5B).
Target ↑72.5–75 | ↓65→60.
#PYPL
PYPL Weekly Outlook (Oct 21–25): Buyers Defend the BaseCan Bulls Reclaim $70? 🚀
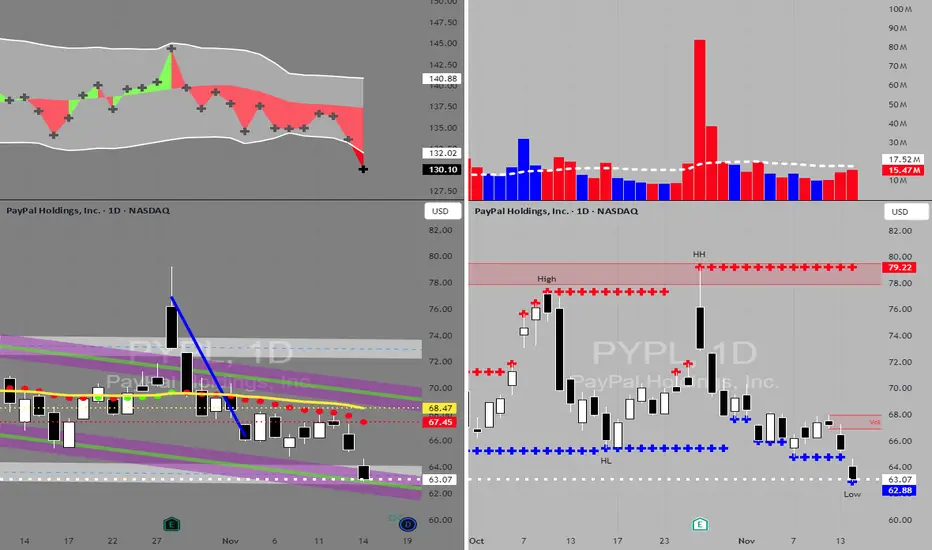
📆 Daily Chart — Macro Structure and Bias
Market Structure:
PayPal (PYPL) continues to trade within a broad descending channel but is showing early signs of structural stabilization. After several failed breakdowns, bulls defended the $64.50–$65.00 demand zone — a key level where prior liquidity sweeps triggered reversals. The most recent BOS (Break of Structure) around $69.00 indicates that smart money might be accumulating again within this base range.
We can see multiple CHoCH and BOS interactions suggesting buyers are quietly absorbing supply below $70, preparing for a potential structural shift back toward the mid-channel zone.
Supply & Demand / Order Blocks:
* Major Demand Zone: $64.00–$65.00 (deep OB and liquidity defense).
* Intermediate Supply Zone: $70.50–$71.00 (mid-channel resistance).
* Major Supply Zone: $79.00–$80.00 (top of the previous swing high cluster).
If bulls can maintain daily closes above $68.50, this could evolve into a mid-term reversal attempt toward $75+.
Indicator Confluence:
* 9 EMA vs 21 EMA: Bearish on macro view but flattening — momentum loss from sellers.
* MACD: Histogram is improving from deep negative; a cross above zero could confirm a macro shift.
* Stoch RSI: Rising sharply from oversold (10 → 45), signaling renewed buying strength.
* Volume: Buyer volume expanding near the base, consistent with accumulation phase behavior.
The daily structure remains in a potential bottoming phase; sustained closes above $69.50 will confirm a bullish shift.
⏱️ 1-Hour Chart — Short-Term Trend and Swing Bias
Market Structure:
The 1-hour timeframe paints a much clearer bullish microstructure after a decisive CHoCH from the descending wedge. Price reclaimed $67.00, then printed a BOS toward $69.20, completing the first leg of reversal structure.
We’re now consolidating just beneath $69.80–$70.00, which lines up with the mid-term supply zone and a key call wall on the GEX chart. The structure remains bullish as long as $68.00 holds as a higher low.
Supply & Demand / OB Zones:
* Demand Zone: $67.00–$68.00 (recent breakout OB).
* Supply Zone: $69.80–$70.50 (local resistance and liquidity pocket).
Indicator Confluence:
* 9 EMA > 21 EMA — clear bullish alignment, steep slope.
* MACD: Strong expansion with rising histogram, supporting upward bias.
* Stoch RSI: Hovering at 80+ — slightly overheated, but not reversing yet.
* Volume: Increasing on breakouts, declining during pullbacks — healthy pattern.
Trade Scenarios:
* Bullish Setup: Buy dips near $68.20–$68.50 → Target $70.00 / $71.00 → Stop $67.20.
* Bearish Setup: If rejection from $70.50 with divergence → Short to $68.00 / $67.00 → Stop $71.00.
If PYPL breaks and closes above $70, it will invalidate short setups and start targeting $72.50–$73.50 next.
🕒 15-Minute Chart — Intraday Momentum and Scalping Zones
Market Structure:
The 15-minute chart confirms strong short-term bullish control with stacked BOS and higher-low formations. Price is trending neatly along the rising intraday trendline, using the 9 EMA as dynamic support. Each micro pullback toward $68.80–$69.00 has been aggressively defended.
Supply & Demand / OB Levels:
* Demand Zone: $68.60–$68.80 (scalp OB and trendline support).
* Supply Zone: $69.80–$70.20 (intraday resistance + liquidity sweep potential).
Indicator Confluence:
* 9 EMA vs 21 EMA: Strong bullish slope; 9 EMA acting as perfect bounce line.
* MACD: Histogram slightly flattening after expansion — possible short-term cool-off.
* Stoch RSI: Overbought (>80), indicating potential short-term pause before continuation.
Scalp Plan:
* Bullish Bias: Enter near $68.80 pullback → Target $69.80 / $70.20 → Stop below $68.20.
* Bearish Bias: If $70 rejects twice with fading MACD momentum → Short scalp to $68.80 → Stop $70.40.
Intraday bias stays bullish unless price closes below $68.50 — that would mark short-term exhaustion.
📊 GEX (Gamma Exposure) & Options Sentiment Overview
PYPL’s options structure shows a neutral-to-bullish gamma setup with dealers likely positioned to stabilize price between $66–$70. The highest positive NET GEX sits around $70, effectively pinning current price in a tight gamma range.
Key GEX Levels:
* Highest Positive Gamma: $70.00 (dealer magnet).
* Major Call Walls: $72.00 and $74.00 — resistance zones if momentum expands.
* Put Support: $65.00 and $64.00 — strong floor if pullback occurs.
* IVR: 58.6 — elevated but not extreme, indicating active trader participation.
* Call Flow: 35.2% (muted but rising), suggesting cautious optimism.
If price sustains above $70.00, dealer hedging could flip to positive gamma expansion, pressing for a gradual melt-up toward $73–$74. A rejection below $68.00, however, might trigger delta-neutral unwind and short-term reversion to $65.
🎯 Closing Outlook
PYPL enters the week with a constructive recovery tone. The broader daily structure suggests a possible bottoming phase, while the intraday trend shows active buyer defense near $68. The GEX map supports a magnetized range between $68–$70, with potential gamma breakout if momentum persists midweek.
I’m watching for a decisive daily close above $70 — if bulls manage that, $72.50–$74 could be in play before the week ends. Below $68, expect a controlled retest toward $65 before another attempt higher.
Disclaimer:
This analysis is for educational purposes only and not financial advice. Always do your own research and manage your risk.
PYPLTwo gaps filled on Daily from a few months ago.
Divergence on Monthly chart and found potential support. Long target +160

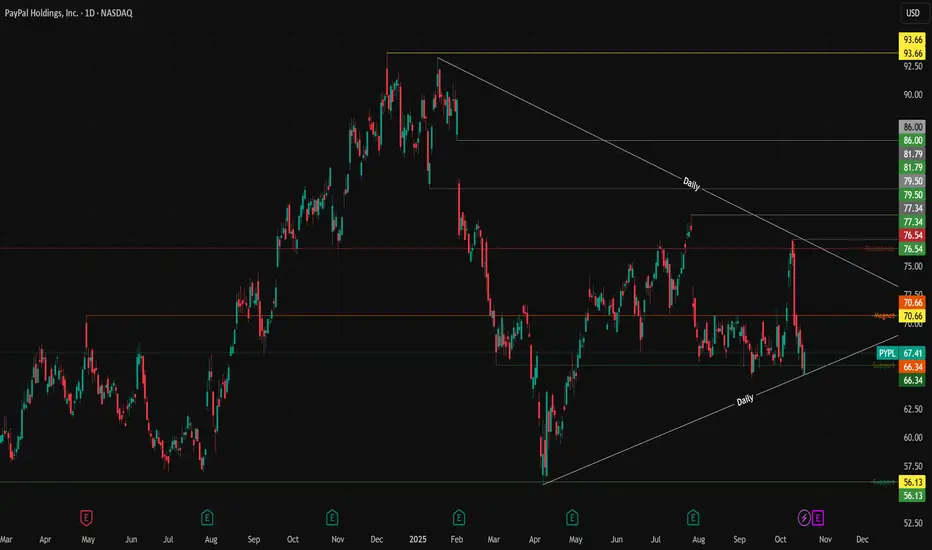
Trade Plan 10/18 Post: $PYPL #PYPLTrade Plan 10/18 Post: NASDAQ:PYPL #PYPL
📊 Setup Overview:
• NASDAQ:PYPL is forming a large symmetrical triangle, tightening range between $65.70 support and $70.66 resistance (magnet zone).
• The stock is coiling near the apex, setting up for a potential breakout or breakdown in the coming sessions.
• Momentum remains neutral but leaning bullish while price holds above the rising trendline.
🐂 Bullish Scenario:
• Hold above $65.70 and reclaim $70.66 for upside continuation.
• Breakout above $70.66 targets → $75 → $82 → $93.66.
• Watch volume — confirmation requires expansion above average daily volume.
🐻 Bearish Scenario:
• Lose $65.70 = breakdown from structure.
• Downside targets → $61 → $56.13 → $50.58.
• Sustained close below $56 would confirm a larger bearish trend resumption.
⚖️ Key Levels:
• Resistance → $70.66 / $75 / $82 / $93.66
• Support → $65.71 / $61 / $56.13 / $50.58
🕓 What I’m Watching:
• Confluence between trendline support and horizontal resistance near $68–70 — volatility likely.
• RSI and MACD compression signaling a breakout setup.
• Ideal trade: Wait for confirmation candle above or below the triangle with volume spike.
💬 If you found this helpful, drop a like and comment if you’re watching $PYPL.
Follow
@optibiz_trades
for daily setups, breakout alerts, and market analysis!
Paypal Looking Bullish!! Lets Go!Paypal is looking Really bullish.
Setup is Based on AMD, Accumulation, Manipulation and Distribution phase.
It has been accumulating at this price range for a while and enough Manipulation has takenplace. Now it is TIME for Distribution and hunt SL of Sellers, that is BSL.
It is not a Financial advice. It is a speculative idea that i am publishing for educational purposes.
Do your own Research.
Leave a thumbs up if you like this idea.
