#VISA - #V technical anticipationBased on my technical analysis, I think strong support for #VISA would be around $320 - $325.
But we have to double-check whenever the price drops to that area.
A strong bounce back or sideways movement due to market sentiment is possible.
Trade ideas

Selling Short Like a Pro: Secrets of successful selling shortLearn the important aspects of how to sell short with consistent success and higher profits. There are many myths about selling short that this video training will explain. Selling Short is something all traders need to learn to do. However, it requires an understanding of the downside price action that is totally different than buying long whether you swing trade, velocity trade or day trade.
The sell side is not an inversion of the upside. What drives price down is different. Learn how simple tips that enable you to watch for a good low risk entry for selling short.
Learn how indicators confirm the sell short entry signal.
Increase your trading profits by being able to buy long or sell short as the market conditions shift and change over time.

The Breakout Of Visa Stock + 3 Step System I have not been feeling well these past days hence why I have been quiet.
Am getting much better a a friend of mine
Gave me some oranges in exchange for avocados .
😏He got more avocado 🥑 compared to the oranges i got from him.
Anyway look at this chart.Notice that by using a CCI indicator you can see that the price has reached a breakout point
This point is called a New high
Also we are using the trend analysis system called the rocket booster strategy
The rocket booster strategy has 3 Steps:
1️⃣ The price has to be above the 50 EMA
2️⃣ The price has to be above the 200 EMA
3️⃣ The price should Gap up to a New high
-
Remember don't use any margin.
Rocket boost this content to learn more.
Disclaimer ⚠️ Trading is risky please learn risk management and profit taking strategies. Also feel free to use a simulation trading account.

Buy Visa Inc.Short Term Trading Advice by Naranj Capital
Buy Visa Inc.
● Buy Range- 347 - 351
● Target- 361 - 364
● StopLoss- 342
● Potential Return- 3-4%
● Duration- 14-15 Trading Days

V to $325My trading plan is very simple.
I buy or sell when price tags the top or bottom of parallel channels.
I confirm when price hits Fibonacci levels.
So...
Here's why I'm picking this symbol to do the thing.
Price at top of channels (period 100 52 & 26)
Stochastic Momentum Index (SMI) at overbought level
VBSM is spiked positive and over top of Bollinger Band
Price at 2.618 Fibonacci level
Entry at $348
Target is $325 or channel bottom

V: Sell ideaSell idea on V as you can see on the chart because we have the breakout with force the vwap and the support line by the sellers.

VISA bullish outlook like Mastercard - Target to $380Visa is looking good fundamentally and technically.
Strong Financial Performance: Visa reported a 14% earnings increase and 10% revenue growth, exceeding expectations.
Growth in Payment Volumes: Payments volume grew 9%, with a 16% rise in cross-border transactions.
Positive Market Sentiment: Analysts view Visa as a top pick due to its strong travel-related spending and valuation.
Strategic Partnerships: Visa partnered with X to launch the X Money Account, enhancing its digital payment services.
Price> 20 and 200MA
W Formation
Target $380.00

Visa Pullback Likely @ $360Visa has been ripping lately. Expecting a short pullback at $360, down to $321, then consolidation back above $360.
Good luck!

Visa ABC pattern incomming on the macro? Visa ABC pattern incomming on the macro? Debt crushing the consumer now, lets see what happens

VISA, Short, 2hVISA has broken a key resistance level at $321 and now appears to be pulling back toward this level for a correction. This setup indicates a potential move lower.
SHORT 🔥
✅ Like and subscribe to never miss a new analysis! ✅

Visa PitchFanNYSE:V
Visa looks to have bounced nicely to touch support of the PitchFan and can go into the green range above making new highs. The last two times the stock bounced and went into green range. Looks good.
Comment what you think about this chart.
Comment any tips or suggestions.
NYSE:V

VISA issuing the first buy signal of the pattern.VISA Inc. (V) has gone a long way since our buy signal almost 5 months ago (August 29 2024, see chart below):
As you can see it was a buy signal just before a 1W MACD Bullish Cross, and straight hit our $320.00 Target before it started pulling-back again the past 30 days.
The +2 year Channel Up pattern is intact and in fact the recent break below the 1D MA50 (blue trend-line) is the first buy signal that is being waved as the price is almost at the bottom of the internal (dotted) Channel Up, which is the Bullish Leg of the +2 year pattern.
The minimum decline within this pattern has been -7.30% so there is still some room for a new low but the 1D MACD indicates we might be seeing a Bullish Cross soon.
In any case, this is a solid level for a first buy entry if you are a long-term DCA investor. Target the top of the 2-year Channel Up at $330.00.
-------------------------------------------------------------------------------
** Please LIKE 👍, FOLLOW ✅, SHARE 🙌 and COMMENT ✍ if you enjoy this idea! Also share your ideas and charts in the comments section below! This is best way to keep it relevant, support us, keep the content here free and allow the idea to reach as many people as possible. **
-------------------------------------------------------------------------------
💸💸💸💸💸💸
👇 👇 👇 👇 👇 👇
Visa Targeting Gap Closure
▶️ The ascending channel gave us an ending diagonal with bearish RSI divergence.
▶️ The break of the bottom trendline is a strong indication that the downside will persist.
▶️ Most obvious initial target is the closing of the gap at 296.34.

Betting on End of Trend for Visa. VThis picture is highly suspect for and end of Grand Wave 5. This is a speculation only as confirmatory levels have not yet been crossed. Yet, we have an constellation of highly suggestive factors. These are momentum divergence (one) on the RSX and RSI (not shown) with Fib extension of 2.414, which we often see in cyclical finishes, second only to a 2.618 if no subdivisions are obvious. Plus, stochastic and volatility indicators are maxed out, suggesting a reversal. We like the nice Fibonacci cluster at 0.5/0.236 between the two cycles.
We are not in the business of getting every prediction right, no one ever does and that is not the aim of the game. The Fibonacci targets are highlighted in green or purple with invalidation in red. Confirmation level, where relevant, is a pink dotted, finite line. Fibonacci goals, it is prudent to suggest, are nothing more than mere fractally evident and therefore statistically likely levels that the market will go to. Having said that, the market will always do what it wants and always has a mind of its own. Therefore, none of this is financial advice, so do your own research and rely only on your own analysis.
Professionally, we are big fans of any indicators from Jurik, De Mark and Ehlers, which we use in addendum in analysis prior to putting down positions.
Trading is a true one man sport. No single confluence of indicators is truly good enough, and a professional trader's sense must be developed through a lot of hard work and over a significant period of time. Good luck out there and stay safe.

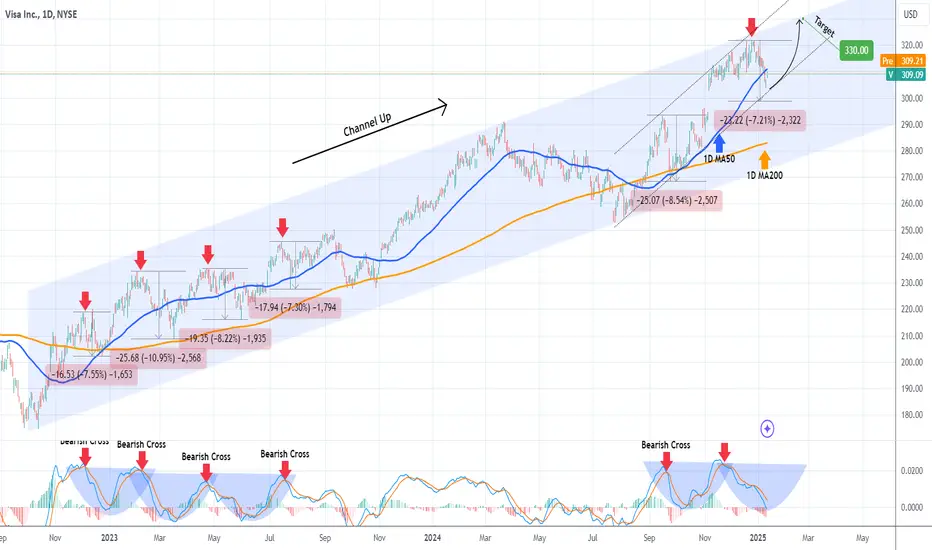
VISA flashing a short-term sell signal.Visa Inc. (V) has been one of our most accurate recent stock predictions (August 29, see chart below), as it is about to complete the buy signal we gave on the Channel's bottom to a +27.36% rise and hit our $320.00 Target:
Needless to say, if you took that call, evaluate your options as the profit is already enormous. Moving forward, specifically zooming in on the 1D time-frame, we can see that Visa is flashing its first sell signal in a while.
The price isn't only almost at the top of the 2-year Channel Up but more importantly, the 1D MACD has completed a Cup sequence on a Bearish Cross, similar to all early corrections at the start of this Channel.
As you can see all MACD Bearish Crosses were followed by pull-backs of similar size with the minimum being -7.30%.
As a result, we can expect the stock to hit and even break below the 1D MA50 (blue trend-line) at $295.00 (-7.30% decline), which would be also near the 0.382 Fibonacci retracement level (similar to the December 22 2022 Low).
-------------------------------------------------------------------------------
** Please LIKE 👍, FOLLOW ✅, SHARE 🙌 and COMMENT ✍ if you enjoy this idea! Also share your ideas and charts in the comments section below! This is best way to keep it relevant, support us, keep the content here free and allow the idea to reach as many people as possible. **
-------------------------------------------------------------------------------
💸💸💸💸💸💸
👇 👇 👇 👇 👇 👇

The 3 Step Rocket Booster Strategy Trading Recap [3.Min Video]In this video, we recap the article that I wrote about
to see if the trading strategy is working.
Now this does not mean all the trades will work
But in this video
we are taking advantage of the one
trade that has worked.
To learn more about the rocket booster
strategy watch this video.
Rocket boost this content to learn more
Disclaimer: Trading is risky please
learn risk management and profit-taking
strategies.
Also, learn to use a simulation trading account
To make profit
before you trade with real money

This Is The 3 Step Rocket Booster StrategyRight now you are probably thinking
"This trading thing doesn't work"
Even I think that sometimes
and its crazy to see moves go the direction
I saw after 5 months!
My patience is very thin,
and so waiting for a move to go up can
be a nightmare it's just like farming
and waiting for the crops to grow
sooner or later the crops will
grow you will be ready to harvest.
This is the mentality I have to force my
self to have when it comes to trading
with this strategy in the capital markets.
because, again this is not day trading
This is trend trading.
It's a long-term strategy for beginners.
Do not use margin higher than x3
If you look at this chart of NYSE:V
you will notice the rocket booster
strategy.
What is the rocket booster strategy?
the rocket booster strategy has 3 steps:
#1-The price has to be above the 50 EMA
#2-The price has to be above the 200 EMA
#3-The price has to gap up in a trend
Looking at this chart do you see the trend?
Then it's the right time
to buy.
Disclaimer:Trading is risky you will lose money
please learn risk management and profit taking
strategies
and learn to use a simulation trading tool
before you trade with real money.

V - Stock breaking out of consolidation. V - Stock making new all time highs today after breaking out of consolidation area. Stock is strong on indicators and looking to hit $320. calls looking good above $314. on watch

Visa Inc.Hi guys,
In this chart i Found a Demand Zone in Visa inc CHART for Positional entry,
Observed these Levels based on price action and Demand & Supply.
*Don't Take any trades based on this Picture.
... because this chart is for educational purpose only not for Buy or Sell Recommendation..
Thank you

VISA filling gap BEarishVISA looks like to fill the gap up opening it did on its earnings
It will probably retest the support of 292 to 296 area
At this point entries can be made to ride the long term bull trend of Visa
its a fundamentally strong stock which will benefit from rate cuts
Entry : 292-296
Stop loss : 270

$V - new all time highs break incoming. $320 PTV - Stock about to break all time highs again on daily time frame. Stock is looking strong on charts. looking for calls above $312.50 for a move towards $320. Stock is strong on indicators.

Visa (V): Pullback Incoming After New All-Time HighsVisa ( NYSE:V ) has reached our anticipated wave 3 target, a significant milestone for this stock that has consistently delivered strong performance. Recently, regulators in the EU have begun probing Visa and MasterCard’s fees, assessing their impact on businesses. While this could pose some risks, Visa’s overall trajectory remains promising.
The stock has been setting new all-time highs consistently, but with the potential completion of wave ((v)) and wave 3, we are now looking for a pullback. This correction could offer a great opportunity to open new long positions. Our target range for the pullback is between $280 and $260, though the exact level remains uncertain. Before this, there could still be further upside, with a potential minor retracement between $311 and $325 that would support a bearish short-term outlook.
We are monitoring this closely and have alerts set to act when the time is right. Visa remains a long-term performer, but patience will be key to capitalizing on its next move.

V Visa Options Ahead of EarningsIf you haven`t bought V before the previous earnings:
Now analyzing the options chain and the chart patterns of V Visa prior to the earnings report this week,
I would consider purchasing the 282.5usd strike price Calls with
an expiration date of 2024-11-1,
for a premium of approximately $5.80.
If these options prove to be profitable prior to the earnings release, I would sell at least half of them.
