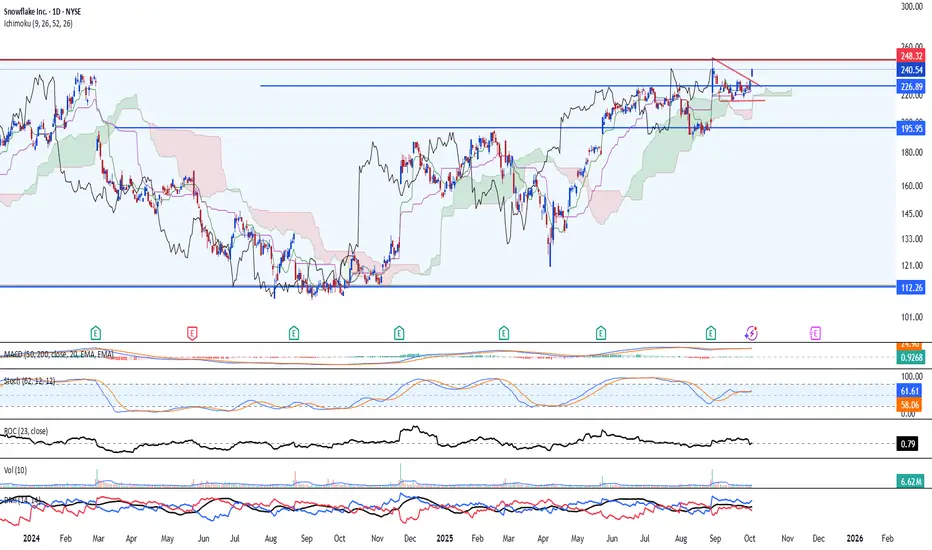
SNOW LongBroader Market Structure
SNOW has been in a clear downtrend for several sessions, forming consecutive lower highs and lower lows. The downside continuation was confirmed by the CHoCH at 228.41, which marked a break of the previous bullish correction and re-established bearish control. Recently, price created a BOS at 268.22, but that BOS occurred after a corrective push into higher-timeframe supply and does not yet shift the broader trend; instead, it signals that the bullish leg was likely just a retracement within a larger bearish structure. Overall, the main trend remains downward, with the current pullback acting as a potential setup for a bullish short-term correction before sellers re-enter higher.
Supply & Demand Zones
The supply zones above 240–244 and 266–271 are strong because price dropped sharply from each one with decisive bearish displacement. These zones have consistently capped bullish attempts, showing strong institutional selling pressure. The demand area at 228–232 has proven supportive: buyers stepped in with strength at the extreme low and created a sharp reaction upward, establishing the CHoCH. This is the only meaningful demand currently holding price up and is the base of the expected bounce.
Price Action Within Your Marked Region
Price is currently pulling back toward the grey demand zone near 228–232 after rejecting the lower supply at 240–242. Within your marked area, price is stabilizing and showing a potential slowing of bearish momentum, which often precedes a bullish corrective leg. If buyers defend this demand again, the chart supports a push back into the 240–244 supply block. However, if the demand fails and price closes decisively below 228, the bullish scenario collapses and the downtrend resumes aggressively.
Trade Bias, Expected Direction & Invalidation
The bias is short-term bullish as long as price holds above 228.00. Expected direction is a bounce from demand toward the 240–244 supply zone. A break and close below 228 would be the key invalidation and shift the outlook back to full bearish continuation toward 220.
Momentum & Candle Behavior
Momentum currently favors sellers but is slowing; the most recent downward candles are losing range and showing smaller bodies, which often signals seller exhaustion near demand. No strong reversal candles have formed yet, but price behavior suggests it is preparing for accumulation rather than continuation.
Trade ideas

Let it $Snow Snowflake has broken out of a rising wedge pattern on elevated volume, which often indicates that the move may be overextended. This kind of breakout frequently precedes a corrective pullback, potentially returning toward the gap left near the previous earnings report.
The first downside target is around 200, with a secondary target near 180, aligning closely with the 0.618 Fibonacci retracement level, which serves as a deeper but technically significant support zone.

Can Data Giants Survive Their Own Success?Snowflake Inc. (NYSE: SNOW) stands at a critical crossroads, facing what the report describes as a "perfect storm of converging headwinds." Despite beating Q3 fiscal 2026 analyst estimates with $1.21 billion in revenue (up 29% year-over-year), the stock plummeted as investors focused on decelerating growth rates and concerning forward guidance. The company that once epitomized cloud data warehousing dominance is now fighting a multi-front war against aggressive competitors, shifting technological paradigms, and macroeconomic pressures that have fundamentally altered SaaS valuations.
The report identifies several structural threats eroding Snowflake's competitive position. Databricks has emerged as the ascendant force, recently valued at $100 billion compared to Snowflake's ~$88 billion market cap, while growing revenue at over 50% annually versus Snowflake's 29%. The rise of Apache Iceberg, an open table format that allows customers to store data in cheap object storage rather than Snowflake's proprietary system, threatens to cannibalize the company's high-margin storage revenue stream. Additionally, Net Revenue Retention has declined from peaks exceeding 150% to 125%, signaling saturation among enterprise customers and difficulty expanding usage within existing accounts.
Beyond competitive dynamics, Snowflake faces macroeconomic and geopolitical challenges that further complicate its challenges. The end of near-zero interest rates has compressed valuations for high-duration growth stocks. At the same time, enterprises have shifted IT spending from cloud migration to optimization and AI infrastructure budget dollars flowing toward GPUs and LLM training rather than traditional data warehousing. The 2024 credential-stuffing attacks on customer accounts, though not a platform breach, damaged Snowflake's "secure by design" reputation precisely when data sovereignty concerns and regulatory fragmentation are forcing costly infrastructure deployments across multiple jurisdictions. The company must execute a flawless pivot to AI-powered analytics while embracing open formats without destroying its business model, a classic innovator's dilemma that will determine whether Snowflake can reclaim its former market dominance or settle into mature, commoditized utility status.
SNOW Earnings Breakout Alert — High-Conviction Call SetupSNOW Earnings Trade Overview (QS Premium) — 2025-12-03
Direction: BUY CALLS
Confidence: 65% | Conviction: Medium
Expiry: 2025-12-05 (2 days)
Strike Focus: $267.50
Entry Range: $11.53
Target 1: $17.10 (+50%)
Target 2: $22.80 (+100%)
Stop Loss: $8.65 (-25%)
Position Size: 2% of portfolio
Market Context & Analysis
Katy AI: Neutral to slightly bearish (-2.02%, 50% confidence) — signals slight downside.
Technical: Pre-earnings rally +6.57%, volume 1.2x average, MACD bullish, breakout above $268 resistance.
News: Strong earnings expectations with 1259% revenue growth, insider leak optimism, analyst bullish sentiment.
Options Flow: Neutral PCR 0.94, unusual $350 call activity suggests institutional bullish positioning.
Risk Level: HIGH — conflict with Katy AI, elevated IV (157%), and earnings binary event.
Implied Move: $24.60 (≈9.3% move expected).
Trade Rationale
Edge: Combines strong fundamentals, technical breakout, and positive insider sentiment, overriding Katy AI’s cautious signal.
Timing Advantage: Earnings already released → captures potential post-earnings continuation.
Risk Management: Balanced delta 0.501, tight stop limits downside, consider scaling out at Target 1 due to high IV/time decay.
⚠️ Note: Moderate confidence level; use caution and reduce position size if necessary.
SNOW 4 HRThis chart shows the price action of Snowflake Inc. (SNOW) on the 4-hour timeframe, with a combination of trendlines, support zones, a gap zone, and a projected bearish region marked in orange for visual guidance.
1. Overall Trend Context
The recent price movement shows a sharp decline from a previous high, followed by a retest attempt that failed and continued downward.
The chart uses dotted trendlines to outline potential directional paths.
2. Fib-Based Rejection Zone (Top Arc Area)
Above the current structure, semi-circular colored arcs (Fib-style fan/arc) highlight where price previously faced resistance.
This area shows:
A cluster of curved resistance levels
The point where the decline began
A strong rejection, confirming selling pressure at those levels
3. First Support Zone (Mid-Level)
Labeled “1st support”, this is the first major area where buyers might attempt to stabilize the price.
Located just beneath the current price
Highlighted in green and brown shading
Suggests a potential bounce zone if momentum slows
4. Second Support Zone (Deeper Level)
Below the first one, “2nd support” marks a wider structural support.
Represents a deeper potential retracement
This region aligns with previous price interactions
Acts as a more significant level if the downtrend continues
5. Gap Area (Earlier in the Chart)
A rectangular “GAP” box on the left shows an earlier price gap.
Price moved up too quickly, leaving an imbalance
Gaps often act as magnets for price
The dotted lines connect this gap to future possible interaction points
6. Bearish Zone (Lower Right Red Area)
A wide red wedge labeled “bearish” shows the projected zone where sentiment becomes significantly negative.
Positioned between ~186–200
Indicates a key downside level where the chart's structure turns into a clearly bearish outlook
Highlighted with red shading and dotted boundaries
7. Trendline Structure
Multiple orange dotted trendlines illustrate
Possible upward recovery paths
Possible continued downward pressure
Long-term diagonal supports and resistances extending into the future
These lines help visualize potential direction depending on how price reacts at each support.

$SNOW is overvalued by 40-50%- NYSE:SNOW is getting super overvalued and running ahead of valuations.
- Companies are now optimizing costs and trying to focus on finops and cost optimization.
- I believe rally has been extended too much.

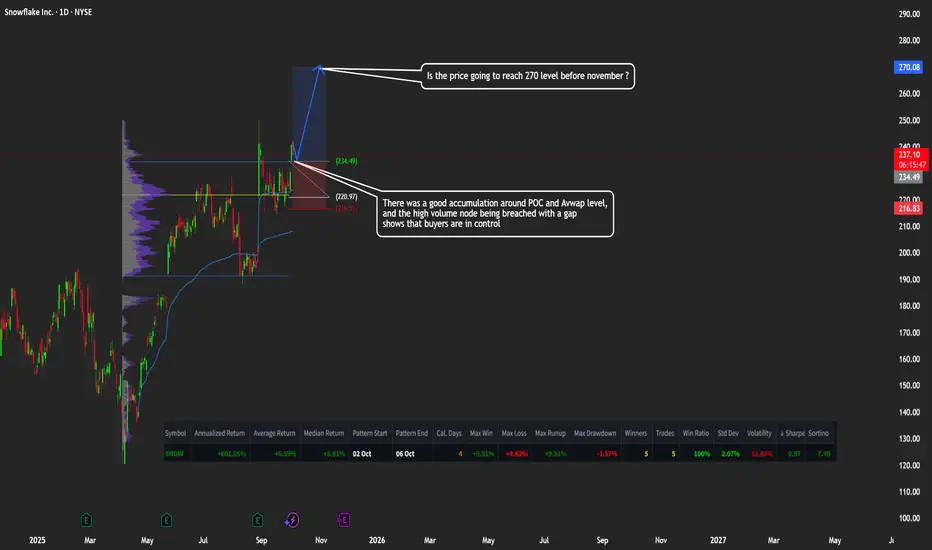
SNOW: Snowflake Headed to $270?🚀 Snowflake Ready for Takeoff? $270 Before November?
Caption:
SNOW has shown strong accumulation around the POC and VWAP levels, with buyers taking control after breaking through the high-volume node with a gap. 📈
Momentum could push the price toward $270 in the coming weeks.
👉 What do you think — is $270 realistic, or will we see a pullback first?
$SNOW - 52 week high break incomingSNOW - Stock breaking out here of $250 resistance on the daily with a strong buy candle. Stock has 52 week highs at $255.39. looking for calls above that level for a move towards $275 and higher. Stock is decent at indicator level. $250 is key support.

SNOW: Bullish Breakout in ProgressSNOW: Bullish Breakout in Progress
SNOW has broken to the upside, showing a pattern very similar to the previous bullish structure on the left side of the chart — a sign of strong buying momentum.
The price made a clear breakout above the $227 resistance zone, confirmed by a strong bullish candle.
If SNOW stays above this breakout level and starts to consolidate, it could gather strength for another move higher toward the next resistance levels.
🎯 Target Zones:
$255
$270
$290
You may find more details in the chart!
Thank you and Good Luck!
❤️PS: Please support with a like or comment if you find this analysis useful for your trading day❤️
Snowflake attempting to breakout of the rangeNYSE:SNOW is looking at potential breaking out of the consolidative range (See chart here: ). WE maintain a buy based on our previous note on Nov 2024 ( On the daily chart, snowflake has returned to the uptrend after prices was seen closing above all the indicators of the ichimoku. Also, the break above the small descending triangle has confirmed the bullish continuation pattern. We maintain a buy with target at 288.00 and 414 over the longer-term. Key support is at 220 and 200.
Super performance candidate NYSE:SNOW , cloud-based data platform leader in its fast growing industry as its business model is expected to grow significantly, with strong customer growth and integrating with the A.I rush, positioning itself to capture significant market share.
Sitting at a RS Rating of 94,
I have reasons to believe this security could increase
$SNOW Earnings Pullback OpportunityOverview of Recent Earnings and Market Reaction
On August 27th, NYSE:SNOW reported its earnings after the market closed, missing analyst expectations. Despite the earnings miss, the company posted a significant increase in revenue, highlighting its continued growth within the AI sector.
Institutional Interest and Subsequent Trading Activity
Institutional investors demonstrated strong interest in NYSE:SNOW , as evidenced by trading volume that was more than four times higher than the average of the previous ten days. Following this surge, the next nine trading sessions saw some profit-taking, but this occurred on reduced volume, suggesting a potential consolidation rather than a reversal.
Technical Analysis and Price Outlook
Currently, NYSE:SNOW appears to be forming a bullish pennant pattern, which may indicate that the stock is ready to resume its uptrend. However, there could be resistance around the $235 level, which corresponds to previous highs.
Trading Plan
The plan is to initiate a long position in NYSE:SNOW if it breaks above the short-term downtrend line. A stop loss will be placed just below the most recent low to manage risk effectively.

SNOW BUYSnowflake (SNOW) has positioned itself as the backbone for AI applications. By managing and streamlining data across platforms, Snowflake is enabling companies to build smarter AI systems.

Snow getting ready to dip before the ripSo snow just broke out 4hr trend line looking for a retest of that trend line for a bounce will be looking for calls once it comes back down for the retest. Targeting 2351st then 240 then 250 . Let’s see how this plays out possibly I’m thinking we get the dip from Tuesday morning data id like to wait depending where snow sits at eod! NFA goodluck
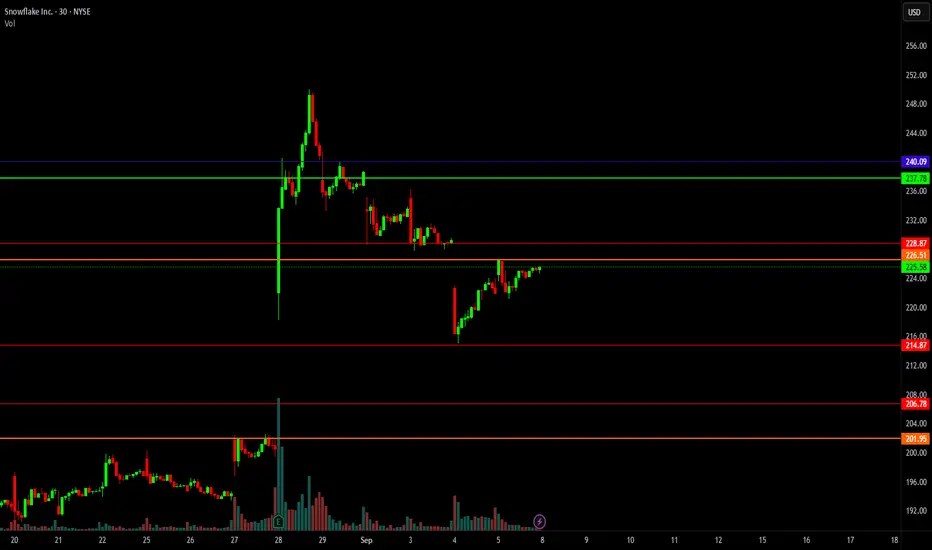
$SNOW about to make a MASSIVE MOVEScenario A (Base Case)
Support bounce: Price held at ~$214.87, then nearly filled a gap.
Next leg up: Target $228.87—likely to gap-fill, wick, then reverse.
Retrace path: After that, expect another pullback to $214.87, then deeper fill down to $201.95—that’s a big move if triggered.
Scenario B (Bull Break)
Key breakout: If SNOW breaks above $228.87 decisively, look for continuation to $237.78, and potentially rally back into the $252 range.
Scenario C (No-Trade Zone)
If price just drifts sideways in chop—we sit out. Trading in no-man’s land gives poor risk/reward and gets you whipsawed.
Strategy
Base case (A): SNOW bounced at ~$214.87, filled up near $228.87, likely wick and fall. If that happens, look for re-entry shorts targeting $214.87 and deeper to $201.95.
Bullish flip (B): A clean break and hold above $228.87 opens pathway to $237.78 and potentially retest into the low $250s.
Chop (C): Sideways 30-minute to 1-hour movement? No edge—stay light, stay patient.
Why Each Move Matters
$214.87 = proven bounce zone, sets the stage.
$228.87 = gap-fill and area where momentum—or rejection—gives clue.
$201.95 = deep gap fill, big structural play if price falls fast.
$237.78 / $252s = next resistance cluster if bullish scenario runs.
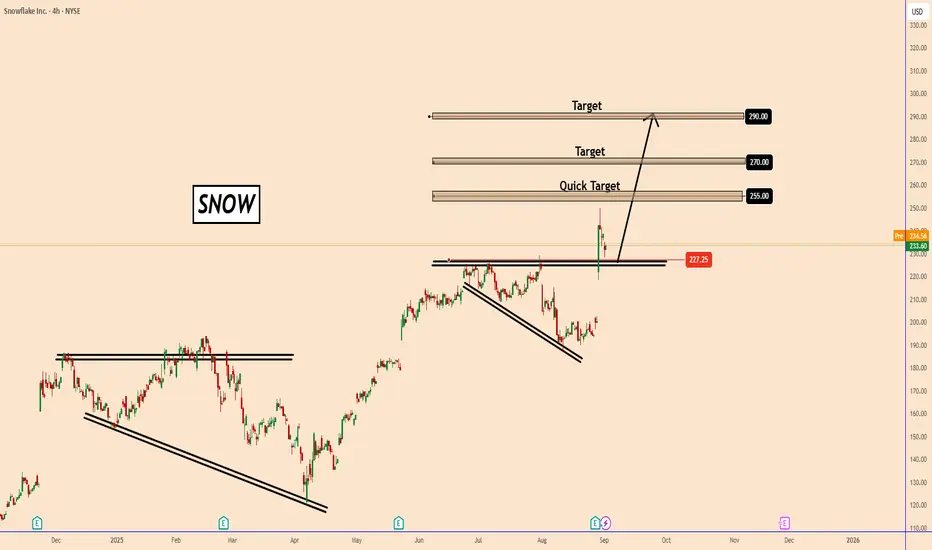
SNOW: Bullish Setup ExplainedSNOW: Bullish Setup Explained
SNOW broke upward and the current pattern looks similar to the pattern on the left side of the chart, signaling strong bullish momentum.
We can observe a clean breakout above the resistance zone near $227.
Sharp bullish candle confirms momentum.
If SNOW holds above the breakout zone and consolidates, it could build momentum for a push toward $290.
🎯 Target Zones:
255 - Short-term traders may take profit here
270 - Mid-level resistance
290 - Major resistance
You may find more details in the chart!
Thank you and Good Luck!
❤️PS: Please support with a like or comment if you find this analysis useful for your trading day❤️
Enter into Fall with SNOWHello I am the Cafe Trader.
Today we’re looking at Snowflake (SNOW).
Price has broken into the Top of Demand, pushing back buyers while bears are making a case for this to go lower.
From a shorter term perspective, bears are in control of this one, making the Red scenario the most likely to happen in my book.
But if you are strongly convicted in SNOW, I have give you two trades, and some long term ideas to get some exposure on SNOW.
Green Scenario
If buyers defend the Top of Demand here, we can see a quick move higher back into Strong Supply . This would be the aggressive play, taking the immediate bounce.
2RR Setup
Entry: 192 (Top of Demand)
Stop: 177.5 (below Bottom of Demand)
TP: 223 (Strong Supply)
Notes: Top of Demand needs to hold, Personally you could even tighten the stop as this is a bit loose.
Red Scenario
If buyers fail at the Top of Demand, we’ll likely see price flush into the Strong Demand zone . That’s where I’d expect More conentrated buyers to step in.
Entry: 156 (Strong Demand)
Stop: 148.8 (below Strong Demand)
TP: 192–194 (Top of Demand flip)
Notes: This is the more conservative path, but also the higher conviction zone for a rebound.
Long Term
If you were looking to get some good pricing with SNOW, these should match your conviction.
Aggressive: 192–194 (Top of Demand)
Value: 156 (Strong Demand)
Extreme Value: 112–115 (Extreme Demand)
This is a layered setup. If aggressive buyers show up now, great — but if not, let the market come to you at the better value zones. Either way, SNOW offers multiple opportunities depending on your conviction and patience.
Happy Trading,
@thecafetrader
Snowflake Melt Up! NYSE:SNOW had an extraordinary breakout on earnings.
Raising their FY 2026 guidance by 100M
Today our members closed our $220 Oct 17 call options for a monster gain.
We are looking to roll profits up and out into farther strike and date.
This price action should see some consolidation, so let the momentum digest itself.
A clear weekly pattern is taking hold of this ticker, so allow it lots of time to play out.

SNOW exiting half of positionCaught a lovely 14% wick of the underlying through purchase of stock before earnings.
Snow posted a strong earnings so will exit half at 229.0 and leave the rest for runners for the next couple of weeks
“SNOW Earnings Sniper--$210C Lotto--Don't Miss Out
🔥 **SNOW Earnings Sniper Trade (2025-08-27)** 🔥
🎯 **Setup**
* **Buy**: SNOW 210C (Exp 2025-08-29)
* **Entry**: \$7.25 (ask)
* **Profit Target**: \$14.50 (100%+) → \$21.75–29.00 (200–300%)
* **Stop**: \$3.63 (-50%)
* **Confidence**: 75% (Moderate Bullish)
* **Timing**: Enter pre-earnings close (AMC print).
📊 **Rationale**
* 88% beat history + AI/data tailwinds.
* Heavy call OI at \$210/\$215/\$220.
* Technicals washed out → primed for upside squeeze.
* Implied move: ±9%. Upside skew.
* Macro backdrop: Low VIX, growth bid, AI sector tailwinds.
⚠️ **Risk Notes**
* Margins/guidance = key risk.
* IV crush post-earnings → exit fast.
* Strict risk management required.
✅ **Execution Plan**
* Size ≤2% portfolio.
* Place limit at \$7.25 pre-close.
* Use OCO: Stop \$3.63 / Targets \$14.50 & \$21.75.
* Exit by next morning latest.
---
📌 **TRADE DETAILS (JSON)**
```json
{
"instrument": "SNOW",
"direction": "call",
"strike": 210.0,
"expiry": "2025-08-29",
"confidence": 75,
"profit_target": ,
"stop_loss": 3.625,
"size": 1,
"entry_price": 7.25,
"entry_timing": "pre_earnings_close",
"earnings_date": "2025-08-27",
"earnings_time": "AMC",
"expected_move": 9.0,
"signal_publish_time": "2025-08-27 15:02:19 UTC-04:00"
}
```
---
🚀 **TradingView Viral Title Ideas**
* **“SNOW Earnings Sniper 🎯 \$210C | AMC Trade Setup 🚀”**
* **“SNOW Earnings Play ⚡ Calls Loaded at \$210 | 75% Bullish Bias 📈”**
* **“SNOW Earnings 🔥 \$210C Lotto | Risk \$725 → Target \$2,175+ 📊”**

Is Snowflake $SNOW about to melt?NYSE:SNOW looks in a precarious position. Having suffered a sharp drop down to sub $190, it has began climbing back up to a key area at $199.88. However, a large gap sits under it, all the way down to a previous consolidation area in may at $180
This presents an interesting short opportunity from this retest down to $179.33
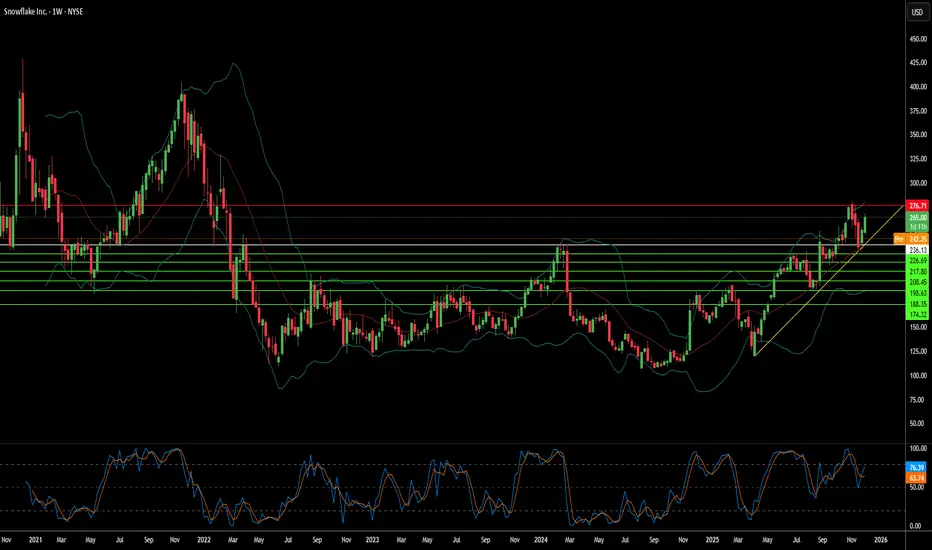
Put a lid on what smells badWe are within a resistance range that is as old as 5 years. It has been confirmed impressively in February 2024 again. Perhaps we will test these high again within the next weeks. But I oubt that we may decisive exceed the 230-240 level as this resistance is very strong and even stronger due to the 2024 Fibonacci extension.
The top on Wednesday could no be overcome. This means to me that we are in a decisive zone now with a possible correction attempt towards the open window of mid May.
Another upward attempt may be followed then.

$SNOW Bull Flag?NYSE:SNOW has been and still may be one of the leaders in this market. It is forming a Bull Flag and within that flag is a nice wedging formation.
I am bullish with this name, so I have an alert set on the upper downtrend line. Should it break that, I will look for a good risk reward entry to open a position. It is possible if the market pulls back, that NYSE:SNOW could continue down to test the 50 DMA (red). All TBD.
If you like this idea, please make it your own and follow your trading plan. Remember, it is your money at risk.
In addition, Nvidia NASDAQ:NVDA and Snowflake NYSE:SNOW were among the investors that backed artificial intelligence company Reka's $110 million funding round, Reka said Tuesday.
Reka said the investment will accelerate its technical development efforts and will also scale its multimodal platforms.
The investment boosts the startup's valuation to more than $1 billion from the previous $300 million in a 2023 funding round, Bloomberg reported Tuesday.
