AEO Stock Is Trading at 1999 Prices. What Does Its Chart Show?Sydney Sweeney controversy or not, American Eagle Outfitters NYSE:AEO has struggled for some 18 months now and is even trading lower than it did on a split-adjusted basis in October 1999. What does the clothing retailer's fundamental and technical analysis say as AEO prepares to release second-quarter results?
American Eagle Outfitters' Fundamental Analysis
AEO has lost more than half of its value between Friday's close at $12.94 and the stock's March 2024 $26.44 intraday peak.
That said, the recent controversy over the clothing firm's jeans ad featuring actress Sydney Sweeney has helped breathe some life into the stock over the past six weeks or so.
AEO has risen 39.6% since its June 13 52-week low as social-media users -- including President Donald Trump -- weighed in on whether its "Sydney Sweeney Has Good Jeans" ad campaign was bigoted.
Still, the firm will release fiscal Q2 results after the bell on Wednesday at a time when quarterly numbers haven't generally been kind to AEO.
The retailer posted a fiscal Q1 loss in May and has seen year-over-year earnings and revenues both contract for three consecutive three-month periods.
Nonetheless, analysts expect AEO to report a return to profitability in this week's earnings. The consensus view calls for $0.20 in adjusted earnings per share on $1.23 billion of revenue.
However, that would compare poorly to the $0.30 in adjusted EPS that American Eagle Outfitters reported in the year-ago period, while also reflecting 4.4% in year-over-year sales contraction.
Of the nine sell-side analysts that I found that cover this name, seven have lowered their earnings estimates for the quarter since it began, although two have revised their numbers higher.
But interestingly, two highly rated analysts have expressed completely different opinions of the stock just a week ahead of its earnings release.
Jay Sole of UBS reiterated his "Buy" rating and $19 price target vs. AEO's aforementioned $12.94 Friday close.
Conversely, Christopher Nardone of Bank of America downgraded the stock to "Underperform" from a previous "Neutral" while taking his target price down to $10 from an earlier $11. (TipRanks rates both Cole and Nardone at four-stars-plus out of a possible five.)
American Eagle Outfitters' Technical Analysis
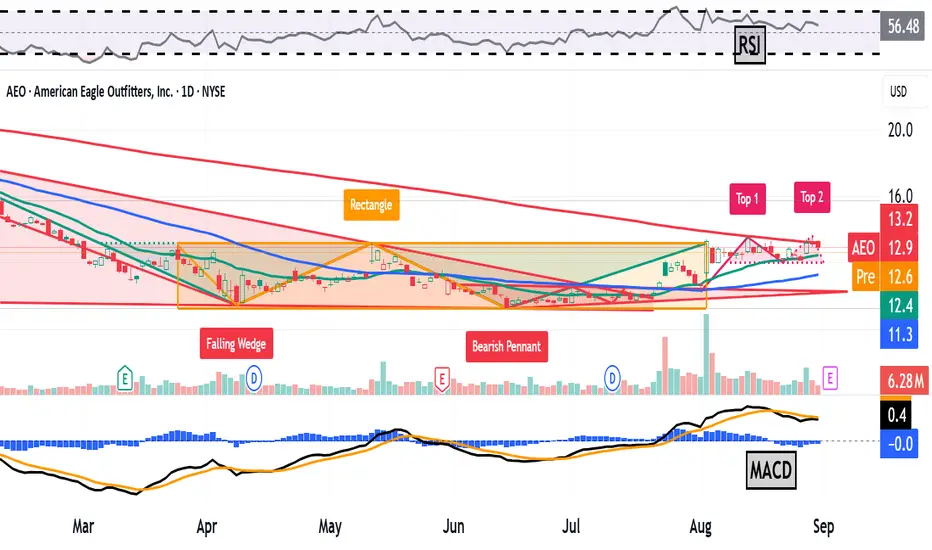
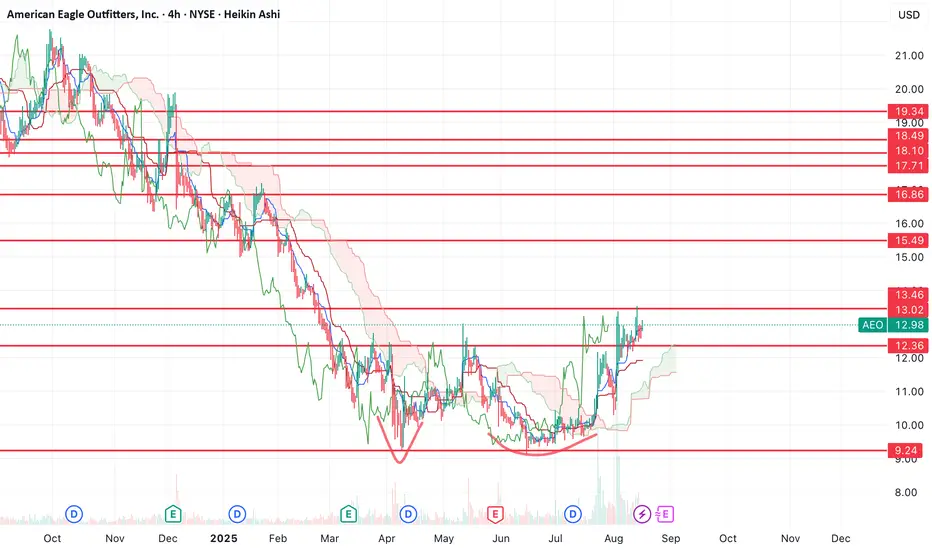
Next, let's look at AEO's chart going back six months:
This chart shows competing technical set-ups that appear to be sending mixed messages ahead of the AEO's earnings release.
On one hand, readers will see that from last spring into this past summer, AEO developed what's called a "double-bottom" pattern of bullish reversal, marked with black diagonal lines and showing a $13 neckline (pivot). The stock broke through this pivot in early August, but didn't get very far.
That said, a much smaller "double-top" pattern of bearish reversal might have since developed with a $12 downside pivot, as shown by the pink-shaded areas at the chart's right.
I say "might" because we really don't know yet if that second top is really a top. Although we might have a downside pivot, it wouldn't take much for the stock to resume its reaction to the earlier bullish double-top set-up that appeared to run out of gas.
Meanwhile, AEO's Relative Strength Index (the gray line at the chart's top) is looking better than neutral technically, but really is nothing special.
However, the stock's daily Moving Average Convergence Divergence indicator (or "MACD," marked black and gold lines and blue bars at the chart's bottom) appears bearish, but is also showing some signs of life.
The histogram of the 9-day Exponential Moving Average (or "EMA," denoted by the blue bars) is in negative territory, but not significantly so.
And both the 12-day EMA (black line) and 26-day EMA (gold line) are in positive territory, which could be bullish. Nonetheless, the gold line is above the black line, which is usually a bearish technical signal.
Add it all up and investors and traders will have to choose. Which sell-side analyst has it right? Which technical set-up has it right?
The bullish set-up looks better defined right now, but this will probably be decided by AEO itself when the company goes public this week with its quarterly numbers.
(Moomoo Technologies Inc. Markets Commentator Stephen “Sarge” Guilfoyle had no position in AEO at the time of writing this column.)
This article discusses technical analysis, other approaches, including fundamental analysis, may offer very different views. The examples provided are for illustrative purposes only and are not intended to be reflective of the results you can expect to achieve. Specific security charts used are for illustrative purposes only and are not a recommendation, offer to sell, or a solicitation of an offer to buy any security. Past investment performance does not indicate or guarantee future success. Returns will vary, and all investments carry risks, including loss of principal. This content is also not a research report and is not intended to serve as the basis for any investment decision. The information contained in this article does not purport to be a complete description of the securities, markets, or developments referred to in this material. Moomoo and its affiliates make no representation or warranty as to the article's adequacy, completeness, accuracy or timeliness for any particular purpose of the above content. Furthermore, there is no guarantee that any statements, estimates, price targets, opinions or forecasts provided herein will prove to be correct.
The Analyst Ratings feature comes from TipRanks, an independent third party. The accuracy, completeness, or reliability cannot be guaranteed and should not be relied upon as a primary basis for any investment decision. The target prices are intended for informational purposes only, not recommendations, and are also not guarantees of future results.
Moomoo is a financial information and trading app offered by Moomoo Technologies Inc. In the U.S., investment products and services on Moomoo are offered by Moomoo Financial Inc., Member FINRA/SIPC.
TradingView is an independent third party not affiliated with Moomoo Financial Inc., Moomoo Technologies Inc., or its affiliates. Moomoo Financial Inc. and its affiliates do not endorse, represent or warrant the completeness and accuracy of the data and information available on the TradingView platform and are not responsible for any services provided by the third-party platform.
AFG trade ideas
Sydney Sweeney Pumps American Eagle!Sydney Sweeny is apparently still hot on wall street and in the eyes of teenagers.
American Eagle posted a blockbuster earnings report popping the stock like its on Viagra.
Beating Revenue & EPS expectations.
Revenue came in at $1.28B
EPS came in at 0.45
A clear successful advertising campaign from AEO execs.
We issued $15 November 21st calls to members and this trade has blown my expectations with this pop.
This stock has triggered a bullish daily chart pattern which has completed the measured move. Now its a question of how much can wall street bets / reddit squeeze this name?

AEO American Eagle Outfitters Options Ahead of EarningsAnalyzing the options chain and the chart patterns of AEO American Eagle Outfitters prior to the earnings report this week,
I would consider purchasing the 15usd strike price Calls with
an expiration date of 2027-1-15,
for a premium of approximately $3.25.
If these options prove to be profitable prior to the earnings release, I would sell at least half of them.
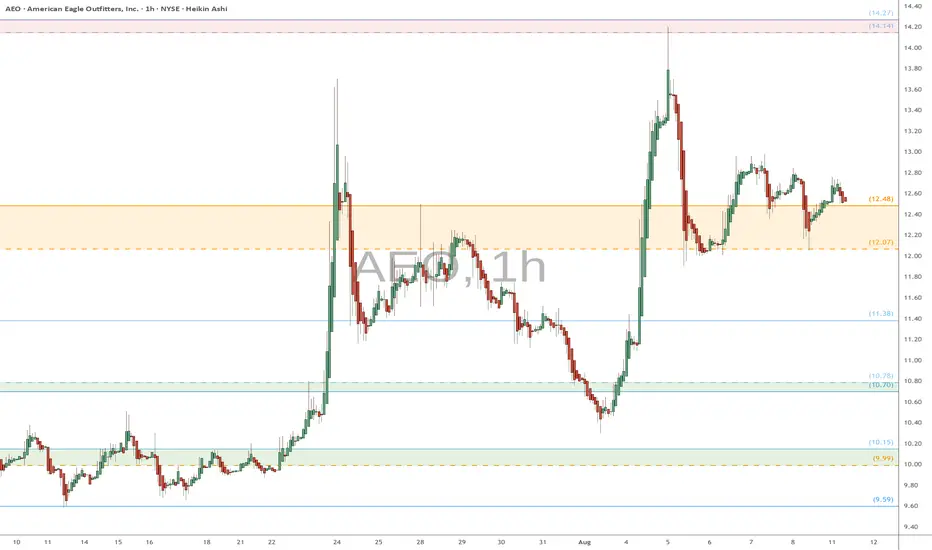
AEO watch $12.07/48: Double Golden fib zone to determine trendAEO's advertising controversy has brought some erious volatility.
Price still unable to exit orbit of Double Golden zone $12.07-12.48
Looking for a clean Break-n-Retest in either direction for entry.
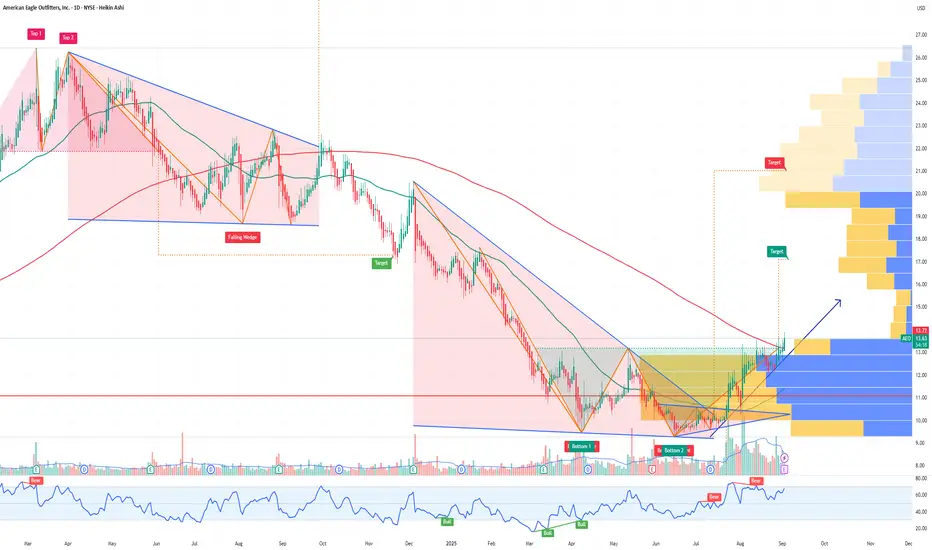
$AEO adam and eve bottom, target $15+American Eagle Outfitters formed an adam and eve bottom chart pattern and has now broken through resistance at $12.33 and retested it as support.
The next level it needs to break to the upside is $13.46.
If it can break above that level, then the next resistance is at the $15.49 level which is also the 50% retracement from the highs. That would make for a great short term target.
However, I've marked off resistance above that just incase the move continues to run.
Let's see how it plays out.
$AEO Can Sydney Sweeney Get This Moving?NYSE:AEO – I have made some quick cash on this stock. (I have no position right now)
I may take another trade on it again but, that AVWAP from the all-time high, only about 18 months ago, shows that there are a lot of shareholders underwater looking to get out (overhead supply). Sydney Sweeney is going to have to help them sell a lot of jeans quickly to make this a legit leading stock.
Right now it seems for this to get goin, it needs a ton of volume as a meme stock in the short term. Which may make it a good day or shorter term swing trade. All TBD.
I am intrigued by this one so I am keeping a close eye on it.
Thanks for looking.

American Eagle Oufitters - Bottoming outNYSE:AEO saw a strong bullish reversal from the bottom and with the 15% jumped on Monday, the stock has briefly broken above the resistance line at US$13.02. Given the strong momentum, AEO will likely confirmed the double bottom and reached US$20.00.
Momentum:
Long-term MACD has performed a crossover at the bottom and histogram is positive. Stochastic has confirmed the oversold crossover and 23-period ROC is rising and stay positive on the high note. Volume spikes upon break out

Sydney Sweeney and American EagleWe had an outbreak on the internet.
Jeans or genes?
A seemingly outlandish debate regarding a seemingly insignificant commercial during a time NYSE:AEO is at its historical low in recent years.
Now #Trump is appraising #Sydney after he learned that she is a registered Republican.
Coincidence? I think not.
Here is what I think how it happened:
NYSE:AEO management team looked at their stock price, and went "huh. we gotta do something about this. Our company is failing". What's the secret to a success retail store?
Exposure. Attention. Publicity.
What could be better than the cultural slash between Woke movement and its counterpart? NONE.
For whatever backlash it has, it's one of the most successful marketing campaign for retailers this year. Now almost everybody is talking about it. Whether you have visited an NYSE:AEO store or not, now it is the first one on your mind when you think of clothing companies.
And for those up against NYSE:AEO , they don't appear to me as the target audience to $AEO.
Internet fuzz like this cannot be understimated, especially for a company with around $1B market cap.

American Eagle - Head and Shoulders Top - Selling opportunity Head and shoulders Top
A selling signal pattern.
Option 1: To wait for price to close below the support line. Then short the stock. Stop loss when the price close above the support line.
Take profit: As you deemed fit
Stop loss: Close trade when the price closes above the "support" line.

$AEOGreen: Entry Point
Blue: Start of Week
Red: End of Week
Thumbs Up: Trade Available for Week
Numbers: Price Targets
*For share traders only. Not meant for options.

$AEO Tilted Cup and HandleI am seeing a not so perfect cup and handle for $AEO. Rationale that is a bullish stock is because fundamentals says so as their EPS diluted growth rate is more than 100%. Let's observe.
Ka-ching!

(Potential Trade) AEO(11 May 2024)
Watching AEO as a potential breakout trade.
Potential Entry: $25.15
Initial S/L: $ 22.14
Counter has appear to have completed Subminuette Wave iv as a Flat correction from its Subminuette Wave iii High at $26.44
Look to play the breakout trade as soon as it triggers the $25.15 high
Trade will be voided if prices break down in the opposite direction instead

AEO potential buy setupReasons for bullish bias:
- Basic DOW theory
- Positive earnings
- No divergence
Entry Level(CMP): 23
Stop Loss Level: 19.45
Take Profit Level 1: 26.55
Take Profit Level 2: Open

$AEO: American Eagle Flying off 17.5We'll see if retail can continue it's bounce off the lows, if it does, I suspect AEO will continue at 17.5


AMERICAN EAGLE OUTFITTERS Stock Chart Fibonacci Analysis 040123 Trading Idea
1) Find a FIBO slingshot
2) Check FIBO 61.80% level
3) Entry Point > 13.1/61.80%

AEO - BullishAmerican Eagle Outfitters (AEO) came out with quarterly earnings of $0.42 per share, beating the Zacks Consensus Estimate of $0.23 per share. This compares to earnings of $0.76 per share a year ago. These figures are adjusted for non-recurring items. As the chart shows it has room to reach 17$ and 18.10$. with major hurdle at 15.86$. Potential return is between 11 - 17.8%

$AEO - The winter is coming!The winter is coming for $AEO, and bears are going in to hibernation!
Looks like $AEO is on the lowest point of its' cyclic pattern and about to break all ceilings.
NYSE:AEO

Big moves ahead of AEO. Year long correction is over.I think that AEO is one of the most overlooked stocks right now. Elliot wave analysis suggests that the year long correction is over and we are on the brinks of starting a new motive wave. We clearly saw a breakout out of the falling wedge on friday, and that's BULLISH. Not only that, but AEO is a company that actually makes money. Above all that, AEO is a highly shorted stock with 23% of the free float shorted. Also, SPY is bound to rally into a corrective leg, short term is looking BRIGHT for AEO. NFA.

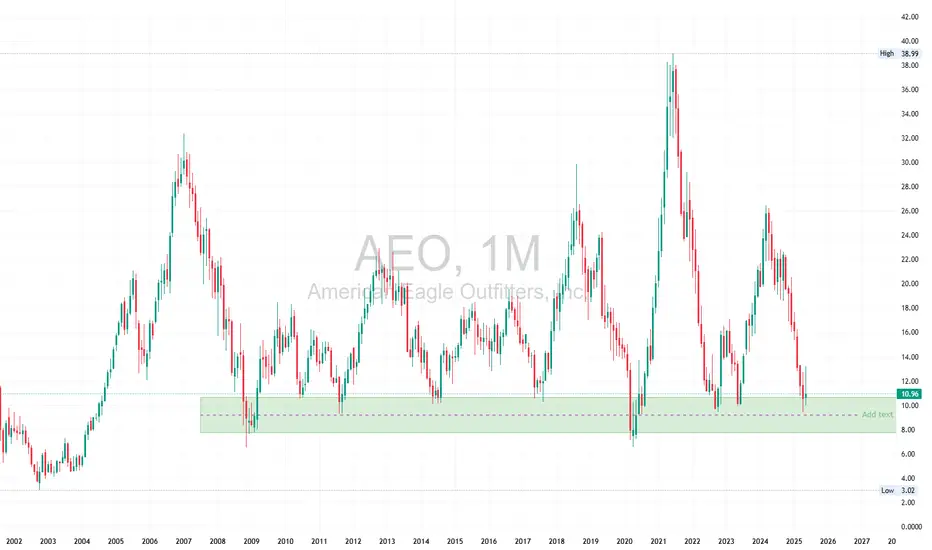
Rare Buying Opportunity for AEOThis monthly chart for American Eagle Outfitters ( AEO ) shows a clear non-logarithmic trend line that has continued throughout the history of the company's existence on the exchange (except briefly during COVID lockdowns). The green shaded area is a definite buy area for long-term investors. This linear trend held up during the Great Recession when 10% of the population was unemployed, and there is no reason to believe that economic circumstances are worse now than in the Great Recession, such as to expect the 25-year trend to end. Similar to VFC , this is another high dividend stock that is sitting in a relatively rare buying zone. Based on my charting analysis, I believe that this stock will likely end 2022 about 25% higher than the current price. So based on the charts, I expect to get about a 25% return on investment in addition to a 5% dividend by the end of the year.
Not financial advice. As always nothing is ever guaranteed. Trends can end.

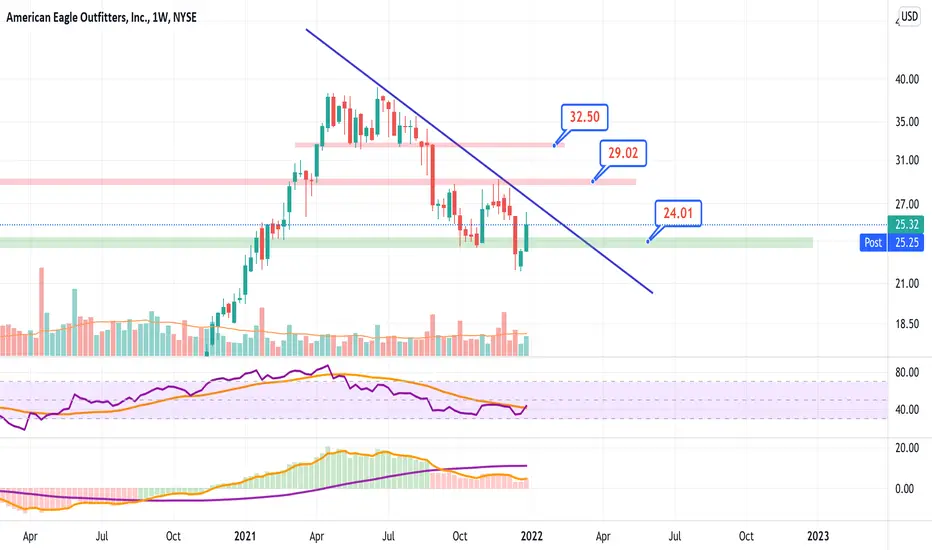
Falling wedge patternA beautiful falling wedge appeared on the weekly chart. Normally, this is a bullish pattern. Combining it with the indicators, also with the price movements, then we get a bullish outlook. MACD indicator just painted a bullish divergence with higher lows on the indicator and lower lows on the chart. Besides that, we retested Dec 13. lows and it failed to sink below.
Support-Stop: 21,97
Resistance: 25,68
Target: 27,76

AEOWeekly Chart Report
AEO weekly chart looking primed for a breakout to the upside. It has a positive divergence on the RSI and the last two green candles went up in increasing volume. The first level of resistance is 29 and then 32.