EA rising wedge breakout, attacking resistanceinsiders sold some stock, but stock is not falling, but rather attacking resistance
ADX confirms direction
ATR% (low volatility) - expect large move
moving averages very tight
Trade ideas


Trying to breakout$EA looks like its trying to breakout, been tricky lately but watch for 102. break or retest of breakout
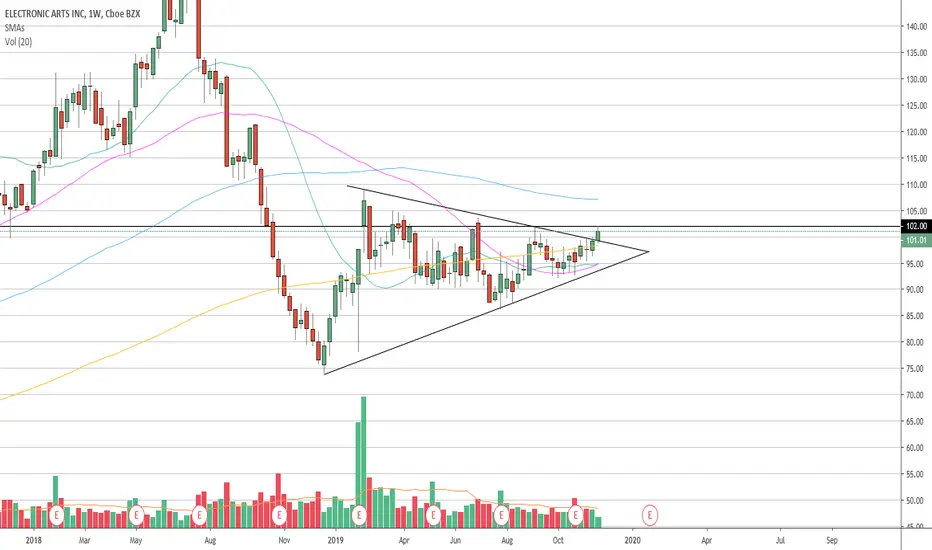

Electronic Arts testing trend line and $100Being stuck in this falling range for a while, EA is testing top of the range again, a break of line and $100 is a good buy signal. Recent swings give a good stop level and risk-reward.
As part of S&P500, this gaming giant has a $28.48B market cap. Price target of most banks and investment funds in this stock is around $120 and higher.
Alternatively if we see a rejection from the trend line, short is possible with a stop above $100 with a buffer.
Good Luck!


EA Looks Poised to Break OutNASDAQ:EA - After a surge from late December to mid February, the stock embarked on a long correction as it retraced around 61.8% of this advance with a falling channel. EA established support in the 88-90 area in July-August and held above this support zone during September-October pullback. Thus, a higher low is taking shape and this could be the start of another leg higher. The stock broke above the red resistance zone this week and I expect a break out of the big falling channel.

Possible Test of top channel coming.Test of top channel.
Looking for a break of Resistance at 105
Rising RSI

Three Percent Trade Idea: Go long EAHere is a great opportunity to go long on EA.
At Three Percent Trades we have a price target of $130.00 / share, which is a potential upside of 32.4% from the current level.
We use a combination of fundamentals & technical analysis to trade high probability set-ups, and believe this is a great opportunity to take advantage.

SAR INDICATORWe can observe sar, a trend indicator. when sar is above prices it indicates a downward trend, while if it is below prices it indicates an upward trend

Inv Head and shoulders on EAstill can hit $90 and be valid unlikely at this point. wouldnt recommend a position but I will be watching for a breakout


$EA Animal Crossing: Textbook Bat Pattern!1 Like = 1 Vote to rename "Harmonic Patterns" to "Animal Patterns"
Goodluck :)


AE post on Twitter: invest in cryptoThey recently posted a post on their twitter calling for the purchase of cryptocurrency;
I guess there will be growth.
The last time I posted the news about Facebook crypto, there was growth, Samsung also showed growth


EA Good Short SetupPossible short near top of channel around $100. Support around 96 and 93 on the way down to target rising trendline. Good risk vs reward.
Information contained herein is not intended to be a source of investment advice. Any opinions are personal and just for fun.

