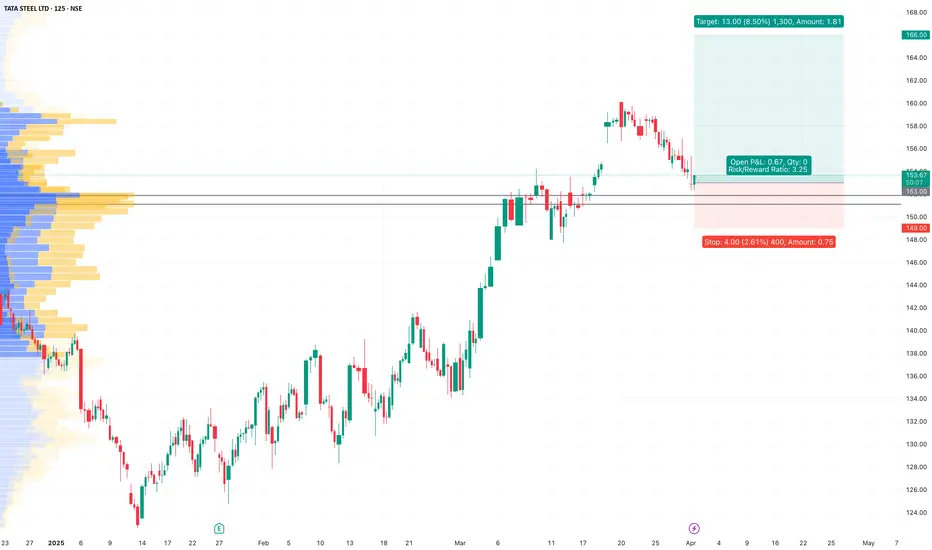
TATASTEEL - Tata Steel LTD (2 hours chart, NSE) - Long PositionTATASTEEL - Tata Steel LTD (2 hours chart, NSE) - Long Position; short-term research idea.
Risk assessment: High {volume & support structure integrity risk}
Risk/Reward ratio ~ 3.25
Current Market Price (CMP) ~ 154
Entry limit ~ 153
1. Target limit ~ 158 (+3.27%; +5 points)
2. Target limit ~ 161 (+5.23%; +8 points)
3. Target limit ~ 166 (+8.50%; +13 points)
Stop order limit ~ 149 (-2.61%; -4 point)
Disclaimer: Investments in securities markets are subject to market risks. All information presented in this group is strictly for reference and personal study purposes only and is not a recommendation and/or a solicitation to act upon under any interpretation of the letter.
LEGEND:
{curly brackets} = observation notes
= important updates
(parentheses) = information details
~ tilde/approximation = variable value
-hyphen = fixed value
Trade ideas
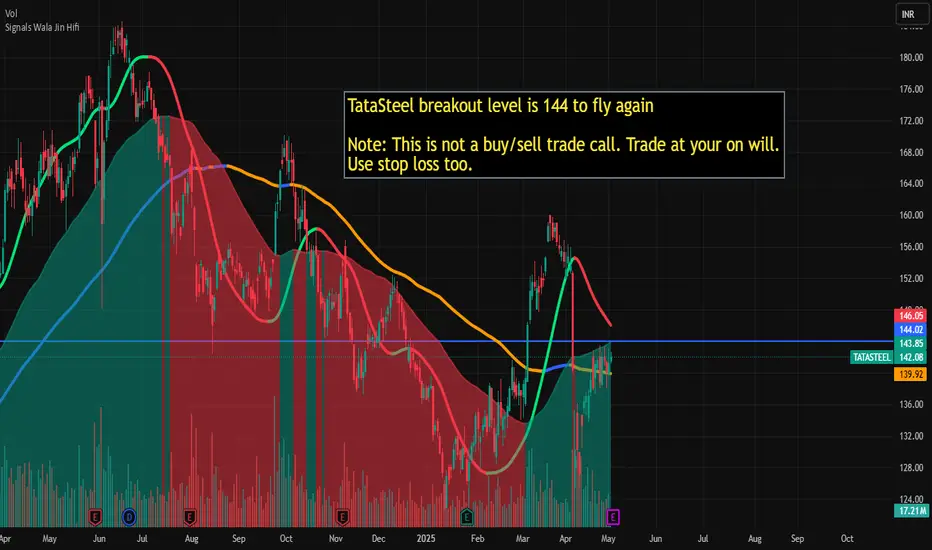
Tata Steel breakout level is 144 for fly againTataSteel breakout level is 144 to fly again
Note: This is not a buy/sell trade call. Trade at your on will. Use stop loss too.
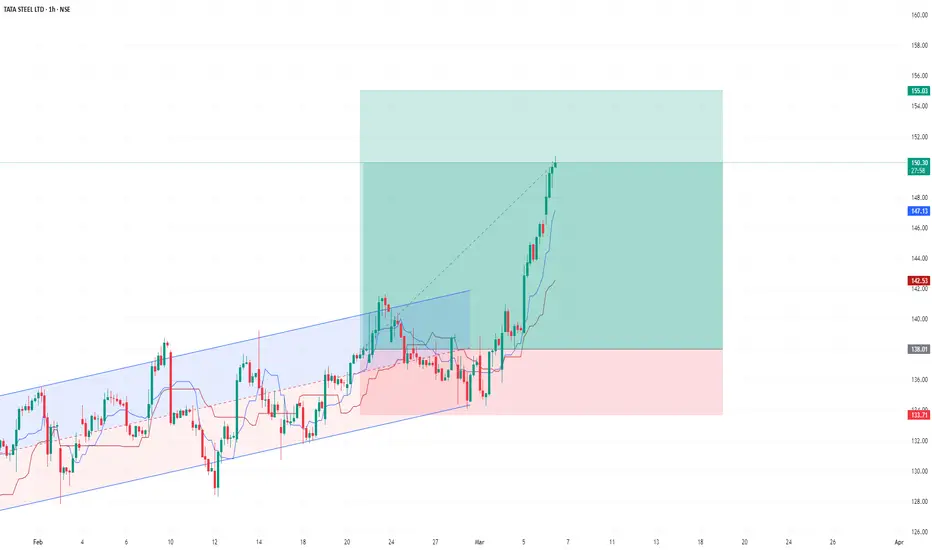
Long on TATA STEEL | Bullish Metal countersI'm Bullish on the Metal sector especially stocks like TATA STEEL & HINDALCO.
TATA Steel seems to be in a nice consolidation pattern on the 1H chart and the buyers seem to be in control.
Price has bounced off the major low support formed on 9th Apr-25.
I have a strong hunch that the stock can test the 155 price level this month.
That would be an impressive 9% move for a stock like TATA STEEL.
P.S. Not a recommendation. Pls due your own due diligence.

TataSteel , 1WThe Channel Pattern Breakout is looking very Good ,
we can consider this Breakout at this point also because it is at 20 EMA Support
if you are not Confident wait for Proper Retest to enter or if you want to take some risk then You can Enter at this Place .
Follow For More Ideas like this Swing Trade Ideas

Trendline Breakout in tata steelThe price has now broken above the trendline.
The current weekly candle has closed above the trendline, which is a sign of a potential breakout.
The breakout is also supported by a strong green candle with increased momentum.
If the price sustains above the trendline in the next few candles, it can confirm a trend reversal.

tata steeln December 2024, India launched a probe after record imports, largely from China, forced top steel mills to petition the government.
On Tuesday, India's Directorate General of Trade Remedies, which functions under the federal trade ministry, recommended a 12% temporary tax for 200 days on certain steel product imports in a bid to curb "serious injury" to the domestic industry.
The tax is proposed to be levied on products including hot-rolled coils, steel sheets and plates, as well as cold-rolled coils and sheets.
Analysts at J.P. Morgan see scope for raising estimates on steel companies' earnings as the tax "opens up ample room for imagination around profitability improvement."
"The tax can potentially lead to more room for price hikes in the next few months after rising to 1,500 rupees to 2,000 rupees in the near term," Parthiv Jhonsa, lead analyst for metal and mining at brokerage Anand Rathi, said.
"Earnings of steel companies are expected to increase in the next one to two quarters," he said.
The tax is expected to help Indian steel mills counter any potential trade diversions from countries like Japan and South Korea into the South Asian country after U.S. President Donald Trump imposed 25% import tariffs on the alloy, as per commodities consultancy BigMint.
The two Asian countries account for 15% of steel shipments to the U.S.

#TATASTEEL Supply Zone (Swing Trade)TATA Steel is approaching a significant supply zone, indicating a potential resistance area where selling pressure may increase. Swing traders can watch for bearish reversal signals (e.g., bearish candlestick patterns, rejection at the zone, or declining volume) to capitalize on a potential downward move. This zone represents a key level where the stock has historically faced selling pressure, making it an ideal area for shorting or exiting long positions.

Tata steelDue to fundamental tata steel is an pure value stock so the under value is 75 once reach start sip margin of safety 28

Result of TATA STEEL Analysis within a WeekI gave a analyses last week that metal stock may be in green and in those many stock i choose TATA STEEL and gave brief description and now here is the result.
#TATASTEEL Supply ZoneThe TATASTEEL Supply Zone is a strategically designed hub that ensures seamless procurement, storage, and distribution of raw materials and resources critical to TATASTEEL's operations. This facility plays a pivotal role in maintaining supply chain efficiency, reducing downtime, and supporting sustainable production processes.
Equipped with advanced inventory management systems and eco-friendly practices, the Supply Zone aligns with TATASTEEL's commitment to innovation, sustainability, and operational excellence. It serves as the backbone of the company's supply chain, enabling timely delivery of materials and driving productivity across its global operations.

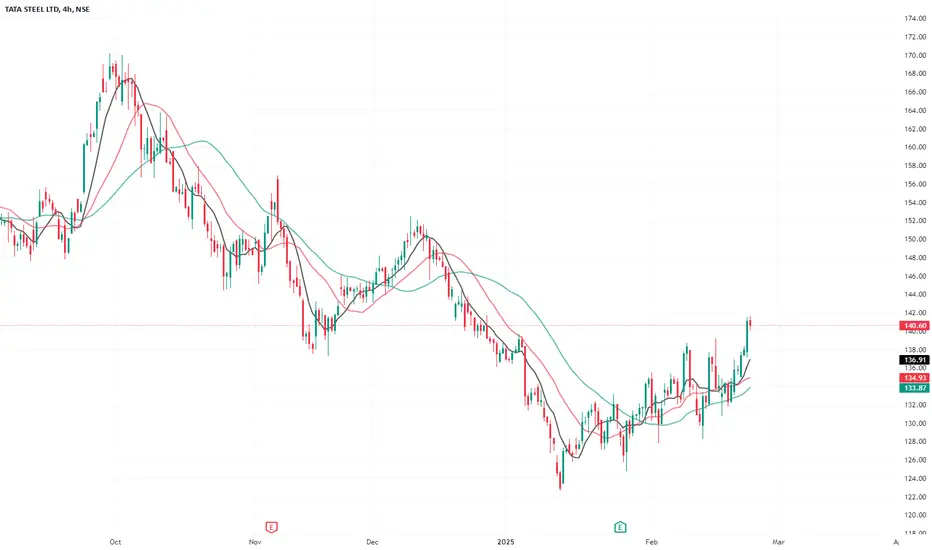
TATA Steel upside?TATA Steel looking good just near 50ema could reach upto 157-160. but,
1. Look out for retest near 200ema
2. Fib - at .55 another pullback is possible
3. Please check other fundamentals and sector analysis

TATA Steel 27 FEB PredictionNifty Metal Sector Analysis & TATASTEEL Forecast
The Nifty Metal sector has been showing strong resilience, retesting its monthly support level three times before breaking out this week. With all metal stocks within Nifty performing well, we now focus on TATASTEEL's key levels and potential price movements.
Current Market Structure :
The Nifty Metal index has confirmed a breakout after multiple retests at its monthly support.
A strong bullish trend is observed across metal stocks, indicating sector-wide strength.
TATASTEEL, one of the leading stocks in the metal sector, is approaching a crucial resistance level.
TATASTEEL Price Levels & Trading Plan:
Strong Resistance: 144.60
TATASTEEL is expected to face a significant rejection at this level.
If the price struggles to break above this point, a pullback is likely.
Support Zone: Around 135
In case of a rejection at 144.60, the stock may find support near 135.
This level will act as a buying opportunity if the price stabilizes.
Breakout Confirmation: Above 144.60
If TATASTEEL successfully crosses the 144.60 resistance, it could lead to a rally towards 152 in the near term.
A strong volume breakout will be a key confirmation factor for this uptrend.
Conclusion:
Traders should watch for rejection at 144.60 and potential support at 135.
A breakout above 144.60 could trigger a bullish momentum towards 152.
Market participants should closely monitor sector performance and global metal prices to validate the strength of the move.
Risk Management:
Stop-loss for long positions: Below 132
Stop-loss for short positions: Above 147
Always consider overall market sentiment and global cues before executing trades.
Disclaimer: This analysis is for educational purposes only and not financial advice. Traders should conduct their own research before making any investment decisions.
Tata steel is short term bullishTata steel is short term bullish it may be come upto 155 for complete it's B point on Elliott wave pattern keep eye on that.

Tata Steel in Demand ZoneWhen Tata Steel enters a demand zone, it means buyers are likely to step in, providing a potential reversal or strong bounce. Instead of using indicators, let's analyze it purely based on price action.
Identifying Tata Steel’s Demand Zone
A demand zone is a price area where buyers have shown strength before. Look for:
✅ Historical Support Levels – Areas where price reversed multiple times in the past.
✅ Strong Rally After Base – A zone where price consolidated before making a sharp move up.


ENTRY INITIATED - TATA STEEL FOR YOUEverything is pretty much explained in the picture itself.
I am Abhishek Srivastava | SEBI-Certified Research and Equity Derivative Analyst from Delhi with 4+ years of experience.
I focus on simplifying equity markets through technical analysis. On Trading View, I share easy-to-understand insights to help traders and investors make better decisions.
Kindly check my older shared stock results on my profile to make a firm decision to invest in this.
For any query kindly dm.
Thank you and invest wisely.

Tata steel looking good for upside Tata steel looking good for upside & trading in very crucial zone it can revers from this level .in weekly time frame

tata steel in buytata steel is pure vaule stock
so current a nifty in side ways upside tata steel will give M pattern @184 from 130 then it will come under book value that mean
72.2 tata steel book value
1st buy zone 130 trg 184
2nd buy zone 70-50 trg 260
margin of safety 35 trg 277

Demand Zone in Tata Steel StockA demand zone in Tata Steel stock represents a price area where buyers show strong interest, leading to upward price movement. This zone is typically identified by significant buying pressure, often observed near support levels. Traders look for candlestick patterns or volume spikes within the zone for confirmation.
Monitoring these zones can help identify potential reversal points or entry opportunities for a bullish trade. Always pair demand zone analysis with broader market trends and risk management strategies.


TATASTEEL poised for upmoveTataSteel (NSE) is at the bottom of the parallel, upward trending channel. Also, the RSI is at the lowest ends.

TATASTEELNSE:TATASTEEL
One Can Enter Now ! Or Wait for Retest of the Trendline (BO) Or wait For better R:R ratio
Note :
1.One Can Go long with a Strict SL below the Trendline or Swing Low of Daily Candle.
2. Close, should be good and Clean.
3. R:R ratio should be 1 :2 minimum
4. Plan as per your RISK appetite
Disclaimer : You are responsible for your Profits and loss, Shared for Educational purpose
