#MARA NASDAQ:MARA
MARA is poised to go higher potentially towards $50 as the first target and onto 150+ in the next few years if bitcoin continues to break higher highs. Its only a matter of time before the miners start to catch up as the revenues would grow significantly and with green energy initiatives these companies can really go above and beyond in the future.
Trade ideas

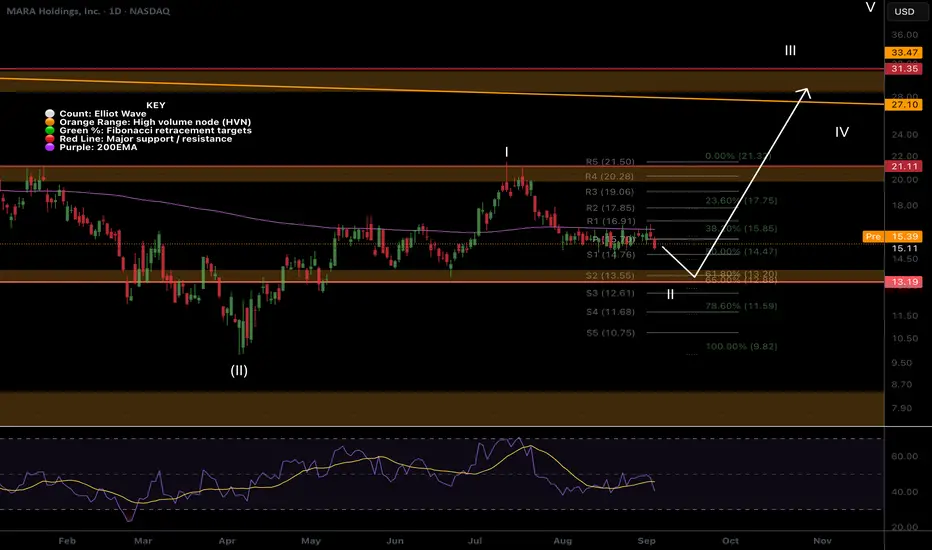
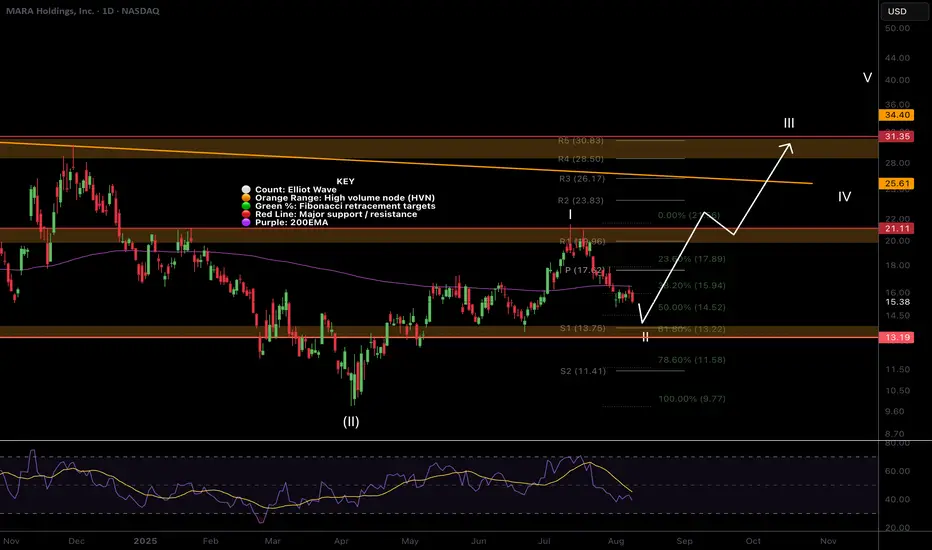
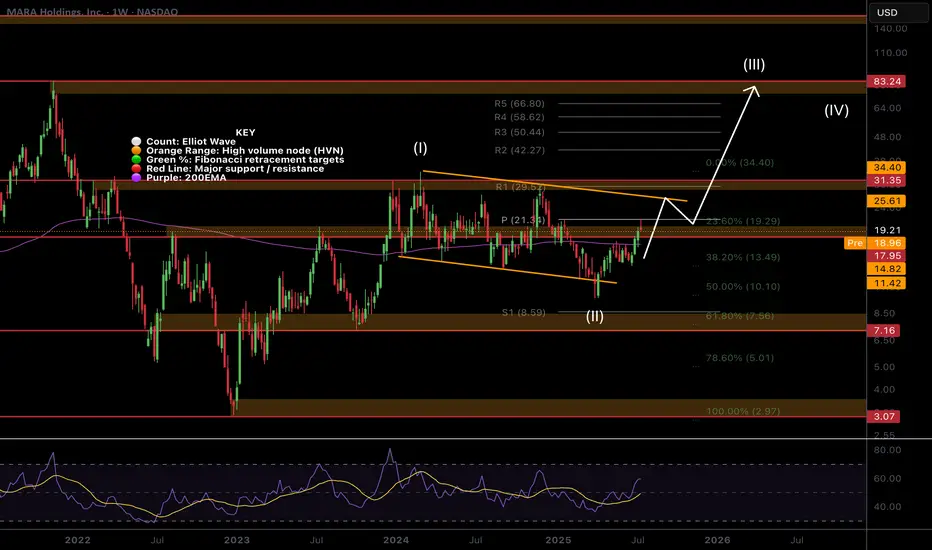
MARA Wave III Underway!Local Analysis / Targets / Elliot Wave
MARA appears to have begun wave III with a rally out of the range and above the daily 200EMA. Wave III has a price target of the High Volume Node resistance at $31 but with the current tailwindsI I expect to overextend.
RSI is overbought and there is looming resistance from the wave 1 high just ahead. Traders should be cautious of this resistance and expect a range below for a while.
Standard Deviation Band Analysis
Standard deviation bands shows price coming into the fair value regression line as resistance. A breakout above this will bring up the SD+2 threshold target of $55. Bands offered a great buy opportunity when price dipped into the green opportunity zone at $3.
Safe trading

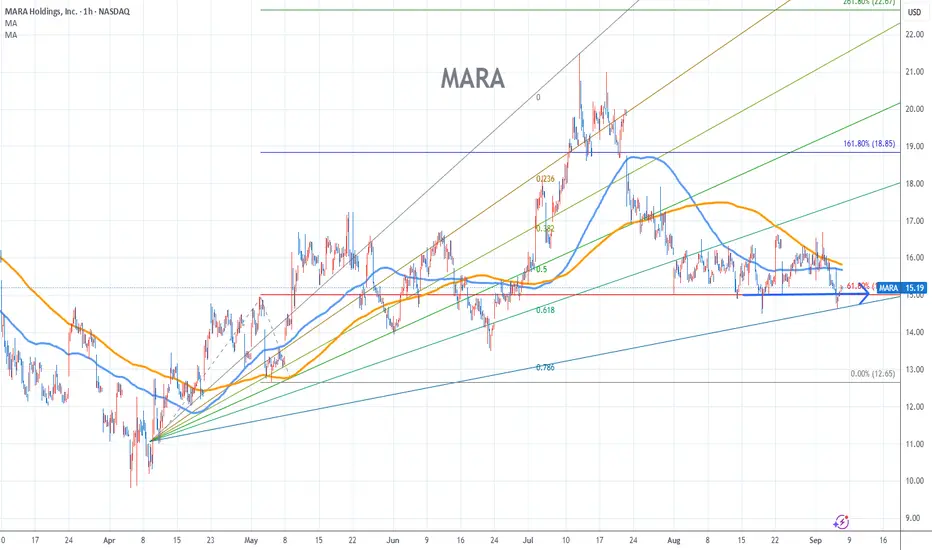
Marathon Stock Chart Fibonacci Analysis 090625Trading Idea
1) Find a FIBO slingshot
2) Check FIBO 61.80% level
3) Entry Point > 15/61.80%
Chart time frame:C
A) 15 min(1W-3M)
B) 1 hr(3M-6M)
C) 4 hr(6M-1year)
D) 1 day(1-3years)
Stock progress:A
A) Keep rising over 61.80% resistance
B) 61.80% resistance
C) 61.80% support
D) Hit the bottom
E) Hit the top
Stocks rise as they rise from support and fall from resistance. Our goal is to find a low support point and enter. It can be referred to as buying at the pullback point. The pullback point can be found with a Fibonacci extension of 61.80%. This is a step to find an entry-level position. 1) Find a triangle (Fibonacci Speed Fan Line) that connects the high (resistance) and low (support) points of the stock in progress, where it is continuously expressed as a Slingshot, 2) and create a Fibonacci extension level for the first rising wave from the start point of the slingshot pattern.
When the current price goes over the 61.80% level, that can be a good entry point, especially if the SMA 100 and 200 curves are gathered together at 61.80%, it is a very good entry point.
As a great help, TradingView provides these Fibonacci speed fan lines and extension levels with ease. So if you use the Fibonacci fan line, the extension level, and the SMA 100/200 curve well, you can find an entry point for the stock market. At least you have to enter at this low point to avoid trading failure, and if you are skilled at entering this low point, with the fibonacci6180 technique, your reading skill of to chart will be greatly improved.
If you want to do day trading, please set the time frame to 5 minutes or 15 minutes, and you will see many of the low points of rising stocks.
If you prefer long-term range trading, you can set the time frame to 1 hr or 1 day
MARA HIGH PROBABILITY SETUP SOON!!!🚨 MARA HIGH PROBABILITY BUY SETUP 🚨
* Here We Can See Clearly The Next Potential Move For MARA Coming Hours/Days.
* Keep Your Eyes Close On Your Trading Positions.
* Happy PIP Hunting Traders.
FXKILLA.
$MARA One More Push Lower to the Golden Pocket?NASDAQ:MARA was rejected hard on the 6th test of the daily 200EMA! The probability of a breakthrough is huge but it just cant overcome supply as people want out of this underperforming Bitcoin Miner! Just the recipe we need for explosive upside, capitulation.
The S2 pivot and Fibonacci golden pocket should see strong support and potential bottoming of wave II, $13.20
Daily RSI is working its way into oversold which will line up nicely for a high probability trade set up I will share in my trading signals substack.
Safe trading
MARA Holding Tight!NASDAQ:MARA continues to lag behind the small cap Miners. It is attempting to break through the weekly 200EMA once more after the rejection from the weekly pivot and High Volume Node (HVN) resistance I warned about.
My long term outlook remains up in Elliot wave 3 towards the R% weekly pivot at $66.
The golden pocket and HVN support of the local retracement has yet to be tested as resistance which acts like a magnet for price.
RSI remains at the EQ and price remains just below the channel EQ.
Safe trading

$Mara bullish or ultra bullishIf you believe bitcoin mining is the future among other crypto projects, may be there is something here. Log trendline break could lit fire under this beast or not. We'll see.

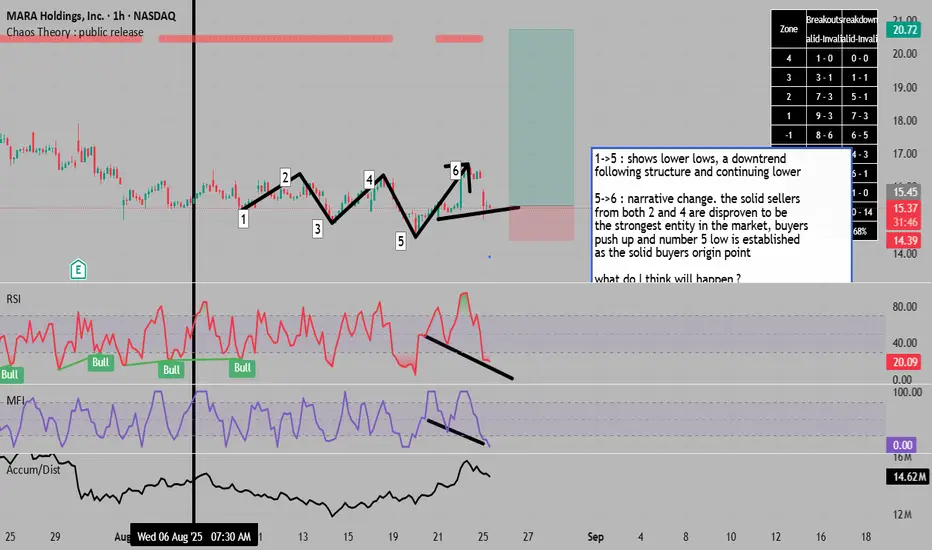
a change in narrative with return to solid =BUYers ## MARA Technical Analysis & Market Outlook
### **Elliott Wave Structure (1→5)**
The decline from wave 1 to 5 traced a clear five-wave impulsive move lower, establishing a downtrend with progressively lower lows. This bearish sequence bottomed around $10, marking the completion of the corrective phase.
### **Market Structure Shift (5→6)**
Wave 5 marked a critical inflection point. The subsequent rally to wave 6 (~$21) invalidated the bearish control established at waves 2 and 4, confirming that selling pressure had been exhausted. This pivot established the $10-14 zone as the **"smart money" accumulation area** - a level now being retested.
### **Current Setup at $15.47**
We've returned to this proven demand zone with multiple confluence factors:
**Technical Indicators:**
- **Inside candle formation** after aggressive selling - classic equilibrium pattern suggesting seller exhaustion
- **Bullish divergence** on RSI (currently 36.76) and MFI - price making lower lows while momentum indicators show higher lows
- **Oversold conditions** across multiple timeframes with RSI in the 30s
- Testing the **critical $14-15 support zone** that sparked the previous 100%+ rally
**Market Context:**
- Analysts maintain **$22.95 average price target** (47% upside) with targets ranging to $39
- 8 Buy ratings vs 0 Sell ratings from Wall Street analysts
- Bitcoin correlation remains strong, with BTC targeting $140,000 by year-end per Elliott Wave analysis
- Institutional accumulation continuing via ETFs despite recent price weakness
### **Trade Thesis**
The convergence of oversold technicals, bullish divergence, and a retest of proven support creates an asymmetric risk/reward opportunity. The inside candle represents the market catching its breath before the next directional move. Given that:
1. Previous buyers defended this zone aggressively (wave 5→6 move)
2. Momentum indicators are flashing oversold with positive divergence
3. Analyst consensus sees 40-50% upside to fair value
4. Bitcoin's broader trend remains intact with $140k targets
**The probability favors a bounce from current levels back toward $20-23 initial targets, with $14 as a clear stop-loss level.**
### **Risk Management**
- **Entry Zone**: $15-16
- **Stop Loss**: Below $14 (wave 5 low)
- **Initial Target**: $20-23 (analyst consensus range)
- **Secondary Target**: $25+ (if Bitcoin reaches $140k projections)
- **Risk/Reward**: ~1:3 minimum
The market has shown its hand - buyers step in aggressively at these levels. Until proven otherwise, this zone should act as a springboard for the next leg higher.
MARA - Currently Favorite Short-Term PickI believe MARA is primed for a sharp 50–80% upside move in the short term.

$MARA Setting Up for A Huge Move?This stocks price action has been subdued far too long after they sold shares to investors but should be moving more aggressively alongside Bitcoin, being the second largest holder of BTC in its treasury.
Price appears to have completed an awkward wave 1 potentially a leading diagonal with wave 2 now underway while price is under the daily and weekly 200EMA. Wave 2 target is a little bit lower in the Fibonacci retracement golden pocket and major High Volume Node support $13.19.
Daily RSI has made its way lower currently showing bullish divergence. If the count is right wave 3 should be hard and fast!
Bitcoin stocks have all had a decent retracement causing me to upgrade my Elliot Wave count to a completed macro wave 1 with wave 2 now underway, suggesting the best returns are still to come over the next months for this category asset class in wave 3!
Analysis is invalidated if we go to new highs above $21.5 or lose $9.85
New long signals are certainly building in the DEMA PBR and Price Action strategies so keep an eye out on the Trade Signals Substack as we have made very food profits lately in these markets!
Safe trading
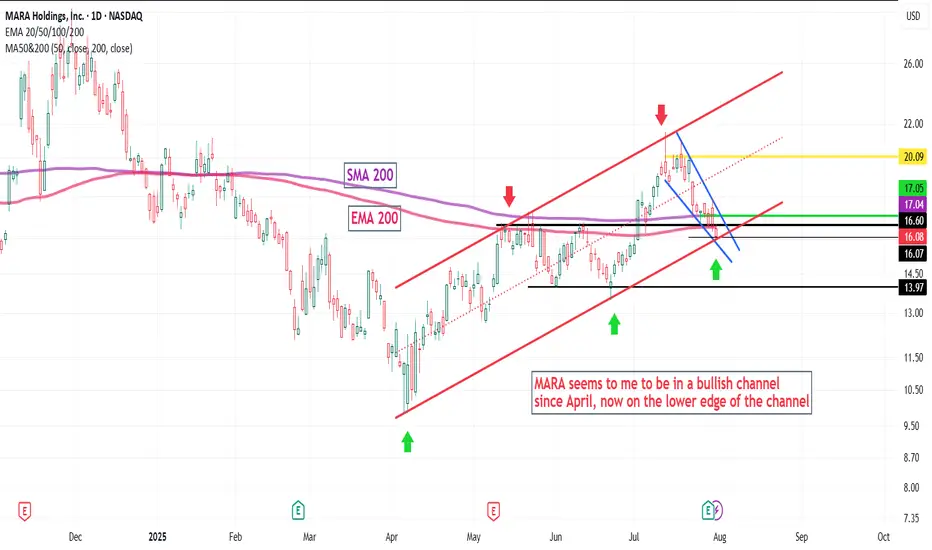
MARA in channelMARA seems to me to be in a bullish channel
since April, now on the lower edge of the channel
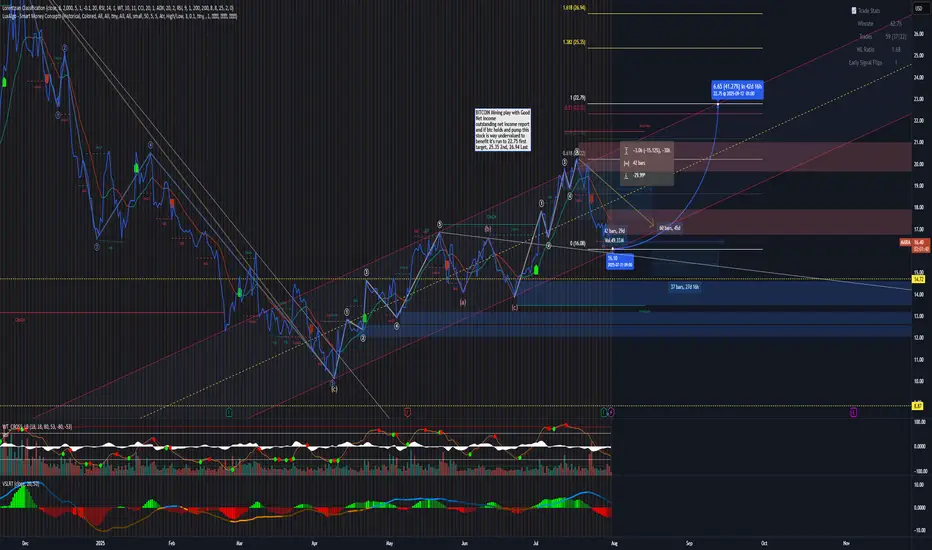
Mara Push higher expectationWith recent outstanding earning report MARA is a undervalue bitcoin mining play offering better risk and Elliott wave count on wave 4 completion looking for wave 5 push up. anytime to see a green reversal day and further movements above the current redline, the hold can last over 1 to 2 weeks. the upmove can last over 27 days. looking over the trendwave. so it's better to seek 60 days options contract
MARA: Mining Bitcoin, Diluting ShareholdersMarathon's Q2 results were great. Revenue up 64% to $238M, adjusted EBITDA exploding 1,093% to $1.2 billion, and swinging from a $200M loss to an $808M profit year-over-year. Those are eye-popping numbers that deserve scrutiny. The massive EBITDA jump and profit turnaround are largely driven by Bitcoin's mark-to-market gains, not operational improvements.
What continues to concern me is the dilution story. That $940.5 million raise they just completed might provide "strategic dry powder," but it's coming at the expense of existing shareholders. The company has been aggressively issuing equity, and while the recent numbers look impressive, a significant portion of that value creation is paper gains tied to crypto appreciation.
They're making progress on vertical integration, but a meaningful chunk of their hashrate still relies on third-party hosting arrangements. The all-in mining costs remain a key metric to watch—strong Bitcoin prices can mask underlying operational inefficiencies.
The timing of these results is also worth noting. MARA, like other miners, benefited enormously from Bitcoin's run to new highs and the broader institutional adoption wave we've seen with ETFs and corporate treasury strategies. But as CEO Fred Thiel himself has warned, there are signs of frothiness in the market reminiscent of previous crypto bubbles.
The AI and HPC initiatives still read like a work in progress. While the company talks a good game about diversification beyond pure Bitcoin mining, material revenue contributions from these ventures remain elusive.
Here's my take: MARA's Q2 numbers reflect the perfect storm of operational scale meeting a Bitcoin bull market. The company has undoubtedly grown its mining capacity and BTC holdings significantly. But the headline-grabbing profitability is heavily dependent on crypto valuations staying elevated.
For investors considering MARA at current levels, the key question isn't whether they can deliver strong numbers in a Bitcoin bull market—they've proven they can. It's whether the business model is resilient enough to generate attractive returns if Bitcoin faces a meaningful correction. Given the company's ongoing dilution, operational leverage to BTC prices, and rich valuation multiples, I'd argue there's limited margin of safety built into the current stock price.

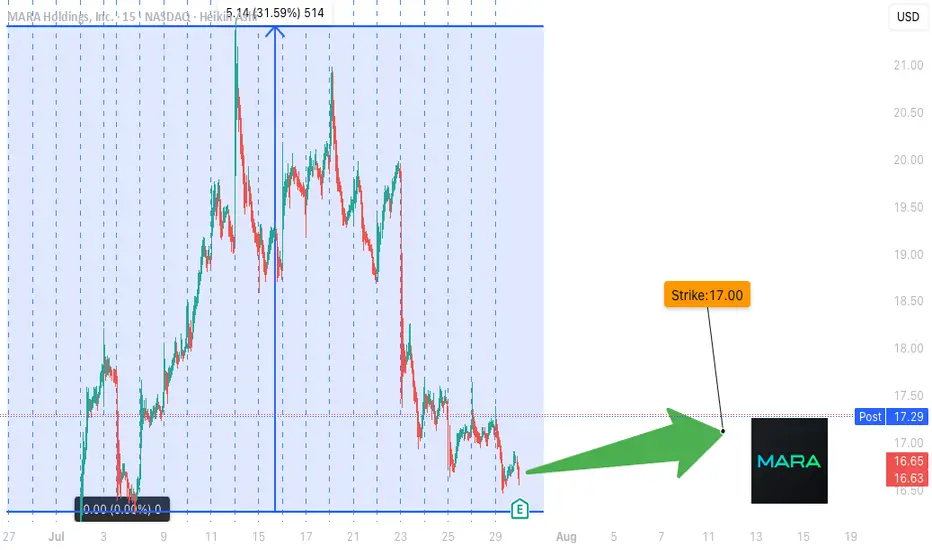
**MARA Earnings Setup – TradingView Breakdown**
🚨 **MARA Earnings Setup – TradingView Breakdown** 🚨
📅 *Earnings Play for 07/29/2025*
🎯 *Strike: \$17.00 Call | Exp: 08/01/2025*
💰 *Premium: \$0.59 | Target: \$1.18*
📈 *Conviction: 75% Bullish*
🔹
---
🧠 **What’s the Setup?**
MARA just raised \$950M to expand BTC holdings 💥
Revenue YoY growth: **+29.5%** 📊
Margins still rough: **-46.7% profit**, but potential catalyst is 🔥 if BTC pumps.
---
🧨 **Options Flow Is Heating Up**
👀 Massive open interest on **\$17 Calls**
🤏 Put/Call Skew slightly bullish
🧮 IV low despite high beta (6.55) = **cheap volatility play**
---
📉 **Oversold + Coiled Tight**
📉 RSI: 38.57 (Oversold)
📍 Support: \$16.50 | Resistance: \$17.50
💣 Sitting at key technical inflection pre-earnings.
---
🔮 **Trade Idea**
🎯 *Buy \$17C @ \$0.59*
🚀 Target: \$1.18 (2x gain)
🛑 Stop: \$0.30
📆 Exit within 2 hrs post-ER to avoid IV crush
---
📊 **Risk/Reward**
💰 Max Loss: \$59
📈 Potential Gain: \$118
⚖️ R\:R = 2:1
---
🔥 **Why It Could Go Viral**
✅ Bitcoin bullish narrative
✅ High beta + cheap IV = explosive setup
✅ Oversold technicals + earnings catalyst
---
🔁 **Like & Save this if you're playing MARA ER 🔥**
\#MARA #EarningsPlay #OptionsTrading #BitcoinStocks #TradingView #ShortSqueeze #CallOptions #HighBetaSetup #CryptoStocks #EarningsSeason #MARAAnalysis #TradingStrategy #Fintok #Finfluencer
MARA Is Waking Up And Looks Promising For The Crypto MarketMARA Is Waking Up And Looks Promising For The Crypto Market, as it can send the price even higher this year from a technical and Elliott wave perspective.
Marathon Digital Holdings with ticker MARA nicely and sharply recovered away from the strong support after a completed projected higher degree abc correction in wave B/2. So, similar as Crypto market, even MARA can be forming a bullish setup with waves »i« and »ii« that can soon extend the rally within wave »iii« of a five-wave bullish cycle within higher degree wave C or 3, especially if breaks above 21 first bullish evidence level. It could be easily supportive for the Crypto market if we consider a positive correlation.

$MARA Hits the Weekly PivotNASDAQ:MARA path has been grinding higher clearing the High Volume Node (HVN) resistance where it is sat as support.
The weekly pivot rejected price perfectly so far but if the count is correct and Bitcoin doesn't dump I expect this continue strongly towards the descending orange line resistance as my partial take profit target.
Once that line is broken i am looking at terminal bull market targets of $80 but will of course take profit at key areas along the way.
Wave 2 swung below the descending support and recovered at 0.5 Fibonacci retracement potentially kicking off wave 3.
Safe trading
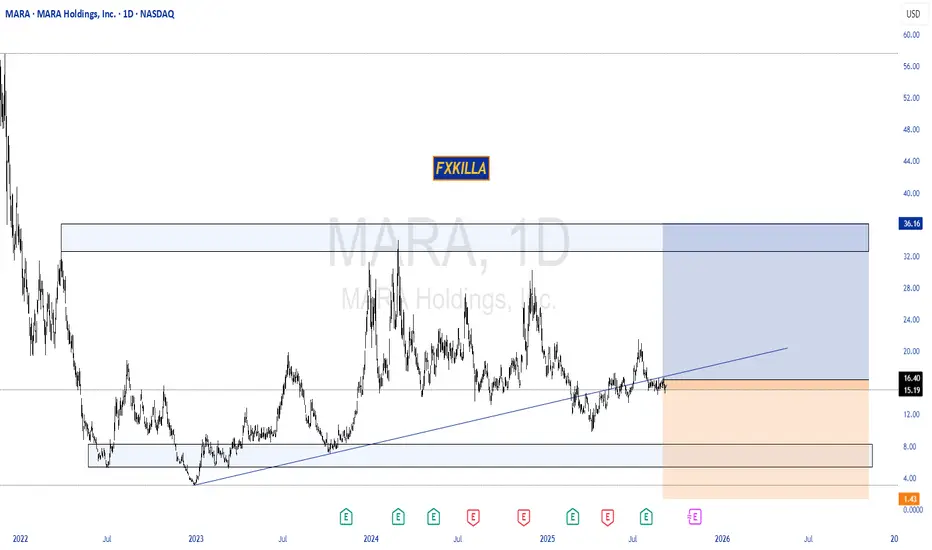
MARA supply and demand; swing tradeI'm looking at the weekly chart here, we have an interesting zone between 14.00$ and 14.68$. We've had decent amount of price action correlating to the areas going back to December of 2020. I set my trade idea with a stop loss at 12.95$ just in case of a liquidity flush , we're still getting at least a 3.5 to 1 ratio, with 2 other targets. This could take till May 2026 to conclude, would consider this a swing trade so could take months or more.

Why MARA Stock Could Rally Now as Bitcoin Eyes Its Next Leg UpWith Bitcoin regaining momentum, MARA Holdings (MARA) is showing technical signs that could signal a strong rally ahead. Here’s why the chart supports a bullish case:
1. Bullish Technical Breakout
Golden Cross Signal: On the 15-minute chart, MARA has just seen its shorter-term moving average (blue) cross above the longer-term moving average (yellow), highlighted by the red circle. This “golden cross” is often seen as a bullish momentum signal, indicating a potential trend reversal to the upside.
Strong Volume: The recent surge is accompanied by a spike in green volume bars, confirming strong buying interest and supporting the breakout.
2. Clear Upside Target
Target Set at $17.50: The chart highlights a target price of $17.50, which represents a significant upside from the current level around $14.95. This target aligns with previous resistance and could be reached quickly if momentum continues.
3. Bitcoin’s Influence
Crypto Correlation: MARA is highly sensitive to Bitcoin’s price movements. With BTC back on track and showing signs of starting its next leg up, MARA typically amplifies those moves, often rallying harder than Bitcoin itself.
4. Momentum Shift
Breaking Above Resistance: MARA has broken above short-term resistance levels and key moving averages, shifting the momentum from bearish to bullish in the short term.
Room to Run: The next major resistance is near the $16.50–$17.50 zone, giving the stock room for a continued rally if buying pressure persists.
Bottom Line:
MARA’s chart is flashing bullish signals just as Bitcoin is setting up for another potential rally. With a technical breakout, strong volume, and a clear upside target, MARA could be poised for a significant move higher if the crypto market continues to recover.

$MARA at Resistance!NASDAQ:MARA continues its rally and has come into the High Volume Node resistance target and R2 daily pivot.
Daily 200EMA was tested as support after price smashed through. I expect continuation to the upside $24 target at the R5 daily pivot after some consolidation at this resistance.
Analysis is invalidated way below wave 2 at $13
Safe trading

Trade Idea: MARA (Marathon Digital) - High-Probability Breakout📈 Ticker: MARA (Nasdaq)
💰 Entry: $17.28 (pullback to support)
🛑 Stop Loss: $14.03 (below swing low)
🎯 Take Profit: $24.05 (next resistance + Fib extension)
🔢 Risk/Reward Ratio: 3:1
🔍 Technical Setup
✅ Trend: Strong daily uptrend (higher highs & higher lows)
✅ Support/Resistance:
Entry: $17.28 (near 20-day EMA & previous breakout zone)
TP: $24.05 (1.618 Fib extension + prior resistance)
✅ RSI (14): ~60 (neutral, room for upside)
✅ Volume: Rising on up-moves, confirming bullish momentum
✅ MACD: Bullish crossover on daily chart
🎯 Why This Trade?
1️⃣ Strong Uptrend: MARA is in a clear bullish phase with institutional interest.
2️⃣ Optimal Entry: Pullback to $17.28 offers low-risk entry near dynamic support (EMA 20).
3️⃣ High Reward Potential: TP at $24.05 (39% upside) with tight risk (SL at -18.8%).
4️⃣ Bitcoin Correlation: MARA often follows BTC’s momentum (bullish BTC = bullish MARA).
⚠️ Risk Management
Stop Loss: Hard stop at $14.03 (below recent swing low).
Position Size: Risk only 1-2% of capital (adjust shares accordingly).
Trailing Stop: Move SL to breakeven if MARA hits $20.00.
📅 Timeframe & Strategy
⏳ Holding Period: 2-6 weeks (swing to position trade)
📊 Ideal Scenario:
Holds $17.28 support and pushes toward $20, then $24.05.
Volume expansion on breakout = confirmation.
❌ Invalidation Criteria
Close below $14.03 = exit (break of structure).
Loss of 20-day EMA + declining volume = caution.
📌 Final Thoughts
MARA offers a high-reward swing trade with a 3:1 R/R ratio. The setup aligns with:
Bitcoin’s bullish sentiment (if BTC holds $60K).
Strong technicals (EMA support, RSI not overbought).
🔥 Like & Follow if you agree! Would you enter this trade? Comment below! 👇
#MARA #Bitcoin #Stocks #Trading #Crypto #Breakout #SwingTrading
(Disclaimer: Not financial advice. Trade at your own risk.)

Rising wedge with bearish divergenceI can see Whales unloading on the 2hr chart, with peak volatility, and rsi stalling. Im break the trade down over several charts..

"MINORITY" Report.. Miners making a move.. Often = "delayed" BTCCheck 1Y big picture.
BTC miners making their moves, interesting to see how they compare to each other.
Those 4 a picked for a reason: top 4 performers.
Interesting to see:
IREN @ RIOT topped 70-100%
MARA & CLSK still got "room" to run..
NFA but quite possibly not late to catch a train..

MARA - Trade Both Sides To WinMARA
Similar to Bitcoin , MARA bounced from a 1:1 extension:
And so a 3 wave correction completed in symmetry.
So on MARA chart , from April lows we have;
- A weak 1:0.618 (GW) 3 wave upside bounce (blue line).
- A shallow and descending 1:1 3 wave correction (yellow line).
- And a 0.5 retracement bounce.
The bounce is weaker than Bitcoin and overall the chart looks weak also considering the 1:0.618 extension ~ weak because the third wave is shorter and a sign of waning momentum.
If Bitcoin will at some point move on up then there is a possibility that this 3 wave correction is a connecting and momentum shifting Pattern Separation from the bearish 1:0.618 wave up, into a more bullish future wave up.
But overall the chart looks weak to my eyes.
I am going to somewhat play both sides here because Bitcoin is printing upside liquidity sweeping action.
This signals some sort of downside in the pipeline.
...
In this area I do not yet have too much idea whether the Bitcoin bounce has real impetus or it is an unstable short squeeze that would lead to impulsive downside.
But I do think that some downside is coming; either a pull back or the dominant trend continuing down.
And so this is my opportunity to take the short term signal to get in early on a MARA short.
...
If MARA is weak compared to Bitcoin and Bitcoin grinds higher, there is a reasonable chance that MARA will start falling.
But another significant consideration is that Nasdaq made a new ATH today ~ MARA is part of the Nasdaq index.
Since Nasdaq has tapped into higher liquidity above previous ATH, there is a reasonable chance that Nasdaq will not be making much more significant Y axis discovery to the upside.
And so; similar to the relationship with Bitcoin; if Nasdaq grinds higher and MARA is weak comparing to Nasdaq, then MARA may start falling away.
With both Bitcoin and Nasdaq potentially in some sort of distributive (topping) territory and a potential MARA having a weak relationship with both, in the most bearish scenario MARA may capitulate down and down from here.
And in the more bullish scenario I may make a small loss or perhaps breakeven.
So I bought a few short positions here 👍.
This analysis is shared for educational purposes only and does not constitute financial advice. Please conduct your own research before making any trading decisions.
