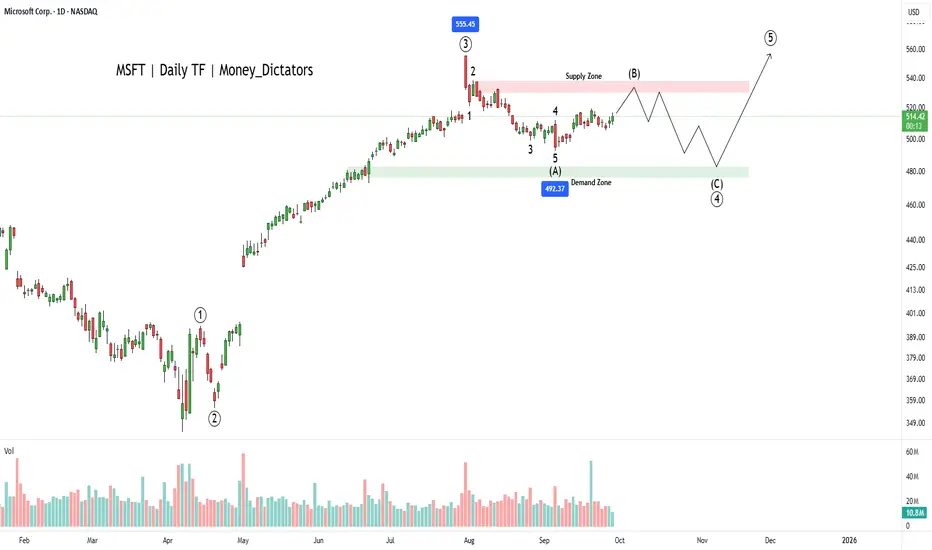
Microsoft Is Finishing Wave 4 CorrectionMicrosoft is in a wave 4 correction, and once it's fully completed, it can extend the rally within wave 5 from a technical point of view and according to Elliott wave theory.
Microsoft is a global technology company founded by Bill Gates and Paul Allen in 1975. It’s best known for its Windows operating system, Microsoft Office suite, and cloud platform Azure. Over the years, Microsoft has expanded into gaming (with Xbox), professional networking (LinkedIn), and AI (through partnerships like OpenAI). Today, it’s one of the world’s most valuable and influential companies, shaping software, hardware, and cloud computing industries.
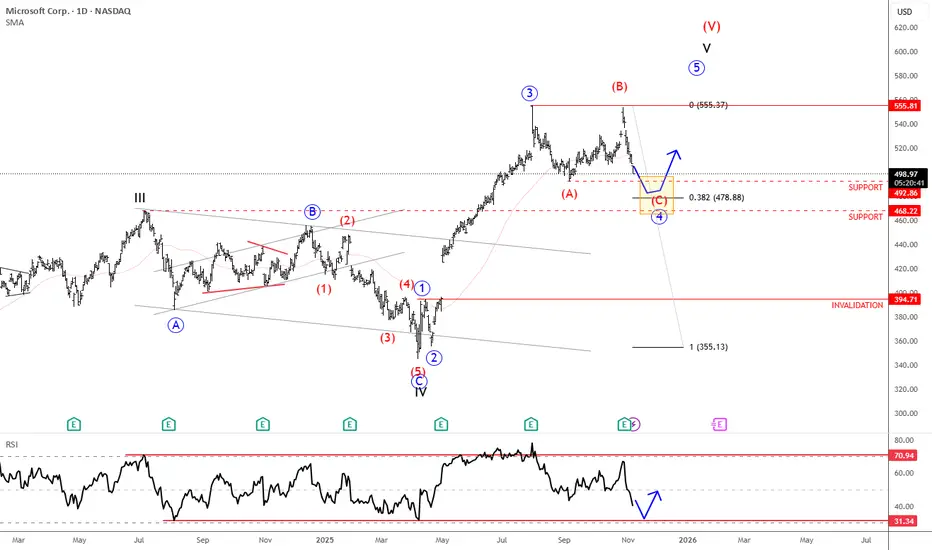
Microsoft reported earnings last Wednesday after the close, with the price turning lower after reaching new highs. The structure still appears to be a wave four in progress — a flat correction where the current drop likely represents wave C. Wave C often stabilizes near wave A levels, suggesting support around 492 and 468 (the former 2024 high). Holding this zone could set up the next rebound into the final higher-degree wave five.
Highlights:
Trend: Corrective phase, wave C of flat in progress
Potential: Rebound toward new highs once support holds
Support: 492 / 468
Invalidation: Below 394
Note: Watch for stabilization at support before potential wave five continuation
Microsoft Corporation Shs -CAD hedged- Canadian Depositary Receipt Repr Shs Reg S
No trades
Trade ideas
Rebound Setup: Limit-Buy after Short-Term Exhaustion (MSFT)Hi Traders
This is a systematic mean-reversion setup I use across liquid ETFs and large-cap equities.
The goal is simple: enter weakness into exhaustion, not falling knives.
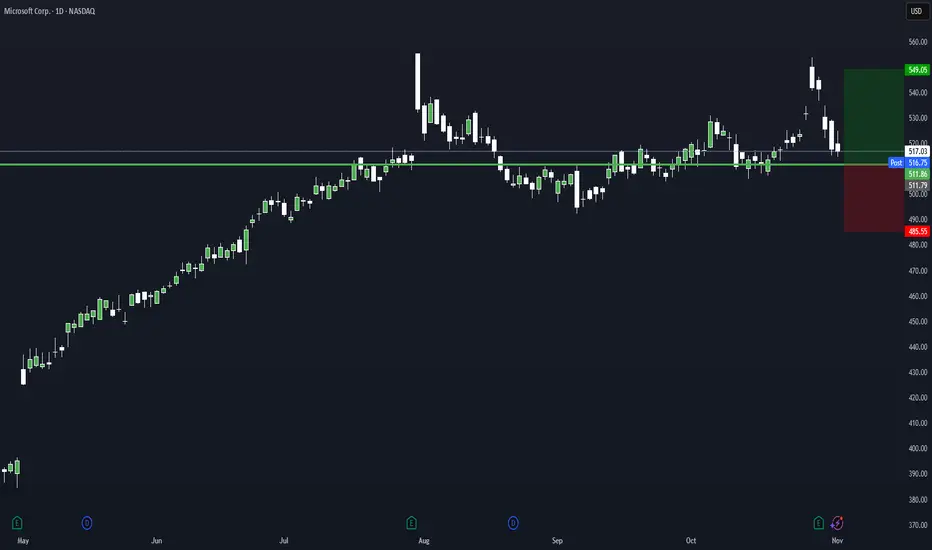
I will place a limit order for MSFT at $511.86. If the order remains unfilled, I will cancel it at the close of trading tomorrow.
Key Concepts:
Oversold short-term conditions
Price deviation vs recent mean
Volume/volatility context
Limit order for the next session only when criteria align
Exit next session open (or rules-based exit, depending on version)
I don’t chase dips — I predefine levels and only enter when price comes to me. This trade idea triggered a limit buy level for today on EFA at 93.55.
General notes:
Works best in mean-reverting environments
Avoid news catalysts & low-liquidity names
This is not a signal service — just a research-based framework
If you like data-driven, rule-based setups, follow along —
I will share more systematic edge ideas like this.
Microsoft: Wave X Top Confirmed! As primarily anticipated, Microsoft shares recently reached the high of turquoise wave X just below resistance at $562.17 before quickly reversing lower. This decline, part of the same-colored wave Y, is likely to bottom within our magenta long Target Zone between $477.87 and $451.84, where we also expect the low of magenta wave (4). In our view, this range presents attractive opportunities for long positions, as we anticipate a renewed upward move during magenta wave (5) to follow. This rally should push price above the $562.17 resistance and complete the larger blue wave (I). Alternatively, we see a scenario in which the high at $562.17 marked only the end of beige wave alt.III (probability: 36%). In this case, a drop below the $392.97 support would be expected to form the low of wave alt.IV.

MICROSOFT may fall to $450 if this Support breaks.Microsoft (MSFT) has been trading within a 4-year Channel Up since the November 22 2021 High. Last week it got rejected exactly on its July 28 2025 Resistance (which was a Higher High for the Channel Up) and formed a Double Top, which continues to decline this week as well.
With its 1W RSI also displaying a Bearish Divergence (since the July High) similar to past sell alerts within this Channel Up, it is possible for the stock to correct to at least $450, which represents the 0.5 Fibonacci level where the previous July 2024 - March 2025 correction found Support. That was just above the 1W MA200 (orange trend-line), which also priced the bottom of the October 31 2022 Low but that correction was -38.69%, considerably stronger that -26.54%, which is also plausible if 2026 is a Bear Cycle.
The level that has confirmed those two correction Sell Signals within this Channel Up has been the 1D MA150 (red trend-line). On both occasions, Microsoft closed a 1W candle below the 1D MA150 and confirmed the correction, something that hasn't happened at any other time during these 4 years.
-------------------------------------------------------------------------------
** Please LIKE 👍, FOLLOW ✅, SHARE 🙌 and COMMENT ✍ if you enjoy this idea! Also share your ideas and charts in the comments section below! This is best way to keep it relevant, support us, keep the content here free and allow the idea to reach as many people as possible. **
-------------------------------------------------------------------------------
💸💸💸💸💸💸
👇 👇 👇 👇 👇 👇

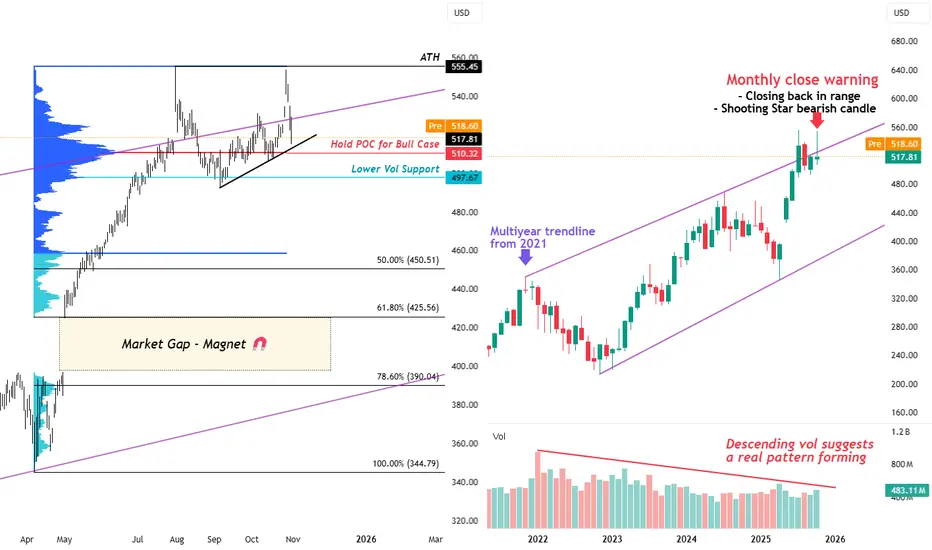
Warning: Microsoft closes BACK under Multiyear Range TrendlineMicrosoft has printed a significant bearish candle in October, and this is a major red flag for technical traders.
This candle not only aligns with a Shooting Star formation — a classic bearish reversal signal — but also closes back under a MULTI-YEAR rising trendline that’s been in play since 2021.
On the monthly timeframe (right chart), we can clearly see a rising channel forming over the past few years. The descending volume adds weight to this structure, suggesting true consolidation or distribution, not just a pause in trend.
📉🐻 Bias: Bearish - Monthly Rejection Candle
Unless buyers step back in soon, the risk of a deeper correction grows.
MONTHLY TIMEFRAME CONTEXT
Shooting Star rejection right at prior channel top
Closing back inside range after brief breakout attempt
Volume trending lower since 2021 — confirms pattern maturity
Interpretation: This kind of rejection after a breakout attempt usually signals exhaustion. Unless volume reverses sharply, the next few months could retrace toward mid-channel support (Around VAL at 50% Fib retracement).
DAILY TIMEFRAME ANALYSIS
MSFT’s recent volume profile highlights $510.32 as the point of control - price with the highest recorded traded volume.
Hold above $510–518 → bulls can still grind higher along the rising trendline
Break below $510 → opens room to test $497.67 (~$500 psychological support)
Below that, we enter the deeper retracement zone:
50% Fib at $450.51 → midpoint of the 2024–2025 rally
61.8% Fib at $425.56 → aligns with top of mid-2025 market gap
78.6% Fib at $390.04 → confluence with multiyear lower trendline, potential 2026 projection target
Market structure note: Losing the Point of Control (POC) at $517.81 would confirm the short-term trend shift and make the $450–$425 zone a strong liquidity magnet.
Closing Thoughts:
Microsoft’s fundamentals have started flashing caution too — not because growth is gone, but because expectations are stretched.
Last quarter’s cloud and AI segments still showed strength, but CapEx guidance surged, margins tightened, and investors didn’t love the tone of the forward outlook. Add to that a hawkish Fed backdrop , slowing enterprise spend, and rotation out of mega-cap tech, and you’ve got a setup that could easily unwind a bit of premium.
For now, it’s a “wait and see” moment — if bulls can defend $510 and the broader market stabilises, this may just be a cooling-off phase. But if we keep closing under the multiyear trendline, that’d confirm a shift from momentum to mean reversion, and the next few months could get interesting.
MSFT QuantSignals V3 Weekly 2025-11-05MSFT QuantSignals V3 Weekly 2025-11-05
MSFT Weekly Signal | 2025-11-05
• Direction: BUY PUTS | Confidence: 65%
• Expiry: 2025-11-07 (2 days)
• Strike Focus: $507.50
• Entry Range: $3.88
• Target 1: $6.08
• Stop Loss: $2.71
• Weekly Momentum: NEUTRAL (-0.56% 1W)
• Flow Intel: Bearish (High P/C Ratio) | PCR 2.54
• Max Pain: $517.50 (+2.2% vs spot)
• ⚠️ MODERATE RISK WARNING: Consider reducing position size due to moderate confidence level.
⚖️ Compliance: Educational commentary for QS Premium members only. No financial advice.
🎯 TRADE RECOMMENDATION
Direction: BUY PUTS
Confidence: 65%
Conviction Level: MEDIUM
🧠 ANALYSIS SUMMARY
Katy AI Signal: The AI shows a neutral stance with HOLD signal, but provides a bearish bias with target at $517.30 (above current $506.20) and stop loss at $498.61. However, the weekly directional guidance strongly indicates BUY PUTS with composite score of -2.5 and STRONG signal strength.
Technical Analysis: Current price at $506.20 shows -4.13% intraday decline with bearish EMA alignment. Stock is trading below session open ($524.50) and VWAP ($518.66), indicating selling pressure. Weekly momentum is neutral but multi-week trend shows -1.46% decline, confirming bearish bias.
News Sentiment: Bearish with tech sector sell-off led by Palantir affecting AI-focused stocks. OpenAI's CFO comments about break-even and government backstop needs may reduce investor enthusiasm for AI infrastructure plays like Microsoft.
Options Flow: Extremely bearish with Put/Call Ratio of 2.54 indicating heavy put buying. Unusual activity at $560 put strike shows institutional bearish positioning. Max pain at $517.50 suggests upward pressure potential is limited.
Risk Level: MEDIUM-HIGH due to short time frame (2 days to expiry) and potential for short-term reversal in tech stocks.
💰 TRADE SETUP
Expiry Date: 2025-11-07 (2 days)
Recommended Strike: $507.50
Entry Price: $3.80 - $3.95
**Tar
Image
QS Analyst
APP
— 5:43 PM
get 1: $6.08 (60% gain from entry)
Target 2: $8.54 (120% gain from entry)
Stop Loss: $2.71 (30% loss from entry)
Position Size: 3% of portfolio (cautious allocation due to short expiry)
⚡ COMPETITIVE EDGE
Why This Trade: Combines Katy AI's technical bearish bias with overwhelming options flow confirmation and sector weakness catalysts
Timing Advantage: Mid-week positioning with only 2 days to expiry maximizes time decay benefits for put positions
Risk Mitigation**: Conservative strike selection with -0.555 delta provides balanced risk-reward for weekly expiration
🚨 IMPORTANT NOTES
Only 2 days until expiration - time decay will accelerate rapidly
VIX rising to 18.01 may increase option premiums but also volatility
Tech sector sell-off could reverse quickly on positive news
Position size should be conservative due to binary event risk
📊 TRADE DETAILS 📊
🎯 Instrument: MSFT
🔀 Direction: PUT (SHORT)
🎯 Strike: 507.50
💵 Entry Price: 3.88
🎯 Profit Target: 6.08
🛑 Stop Loss: 2.71
📅 Expiry: 2025-11-07
📏 Size: 3.0
📈 Confidence: 65%
⏰ Entry Timing: N/A
🕒 Signal Time: 2025-11-05 20:43:48 EST
⚠️ MODERATE RISK WARNING: Consider reducing position size due to moderate confidence level.

Microsoft Corp, poised for 550?On daily TF, Microsoft looks positive. Currently trying to break neckline of C&H pattern at 531, if sustains 550 would be next destination

Clear MSFT’s Hidden TrapMicrosoft (MSFT) has been a market darling for years, and most analysts are still riding the bullish wave. Cool. But markets don’t move on vibes—they move on structure. The $506 zone has become a critical mid-term support region. If price slips below that level, it signals exhaustion in the current trend and opens the door for a sharper correction.
Once that support breaks, liquidity gaps and untested demand zones point toward $349 as the next major downside magnet. That’s a steep fall, but it’s not fantasy—it’s just what market structure is telling us. Long-term fundamentals remain strong, but mid-term technicals don’t care about optimism. Smart investors should watch $506 closely. Below it, the chart stops whispering and starts shouting.

MSFT Bearish: H&S Breakdown Eyes 455–465 SupportMicrosoft (MSFT) just cracked lower from a three-month range. After topping near 560 in early August, price chopped between 500 support and 530 resistance before breaking beneath the 20/60-day MAs and the neckline at 510–515. It’s now pressing the 120-day MA around 502 with expanding volatility and heavy sell volume—classic signatures of a confirmed head-and-shoulders top.
Primary path: favor fades into resistance and breakdowns. A weak bounce that stalls inside 515–525 (neckline retest) keeps the short idea intact; a break-and-daily-close below 502 unlocks 490 first, then the 455–465 demand zone. Tactically, shorts can also lean on an intraday trigger (e.g., 1H close below 512) with stops tightened if momentum accelerates. Invalidation for shorts is clean: a daily close back above 531, which would neutralize the breakdown.
Alternative: if 502 holds and buyers reclaim the range, a daily close above 530–531 would negate the bearish structure and open a squeeze toward 555–560. Bulls still have work to do while price sits below the falling 20/60-day MAs and the 530 ceiling.
This is a study, not financial advice. Manage risk and invalidations

Caution Ahead: Strong Financials, but Market Conditions May ShifDespite the strong financial report, from a technical perspective, we've reached a point where caution is essential, and market conditions should be monitored closely. Even though the financial performance is robust, there’s a possibility that the situation could shift unexpectedly, which might lead to market changes that challenge the strong financial outlook.

Microsoft - This bullrun will end soon!💊Microsoft ( NASDAQ:MSFT ) might reverse soon:
🔎Analysis summary:
Microsoft created a textbook bullish break and retest back in the beginning of 2025. After this retest, we then witnessed a major rally of about +50% over the past couple of months. But considering the recent weakneses and resistance, this rally might be over very soon.
📝Levels to watch:
$550
SwingTraderPhil
SwingTrading.Simplified. | Investing.Simplified. | #LONGTERMVISION

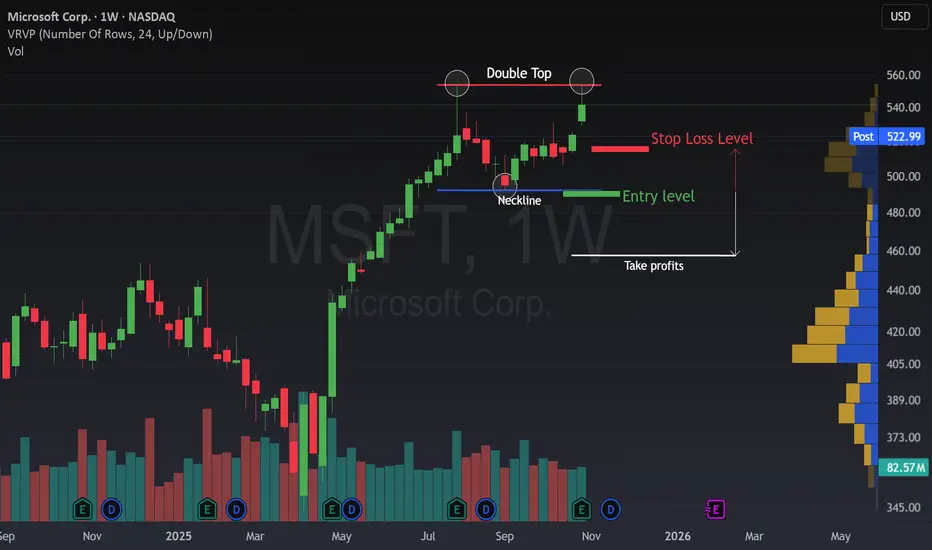
A Double Top in MSFT has just appeared.The weekly chart of Microsoft (MSFT) is showing a potential Double Top formation, a classic sign that bullish momentum might be losing strength .
🔹 Bullish Scenario: As long as the price stays above the blue neckline , the uptrend remains intact. Buyers are still in control, and a clear breakout above the recent highs could trigger a move into new all-time highs.
🔹 Bearish Scenario: If the price breaks below the neckline , it could confirm the Double Top setup and open the door for short opportunities.
NASDAQ:MSFT is standing at a critical decision point, will the stock continue its strong rally, or is this the first sign of exhaustion before a larger pullback?
💬 What do you think, are we about to see another breakout, or is the beginning of a deeper correction?
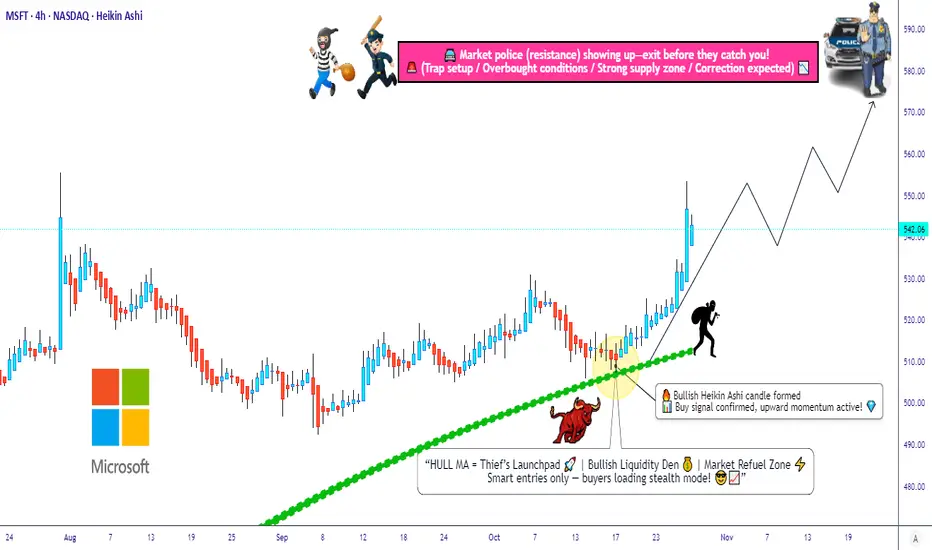
MSFT Market Blueprint: From Pullback to Profit Zone💼 Asset: Microsoft Corporation (MSFT) — NASDAQ
Type: Swing Trade Setup
Bias: Bullish Pullback Play
🔍 Plan Overview
MSFT is showing a clean bullish pullback confirmation with the Hull Moving Average acting as dynamic support. A Heikin Ashi reversal doji candle has appeared — a strong hint that buyers are gaining control again 🟢.
Momentum looks ready to shift back to the upside as the pullback finds its footing. The plan focuses on catching this move with layered entries (a.k.a. “Thief Strategy” style).
⚙️ Entry Plan (Layered “Thief” Style Method)
This approach uses multiple limit orders to build a strong position during pullbacks. You can add or adjust based on your own risk appetite.
📍 Layered Entry Points:
🟩 520.00 — first buy zone (initial position)
🟩 530.00 — second layer (confirmation add-on)
🟩 540.00 — third layer (momentum add)
💡 Tip: You can increase or decrease the number of layers depending on volatility or confidence in trend continuation.
🔒 Stop Loss (SL)
🛑 Thief OG’s SL idea: 510.00
Note: Dear Ladies & Gentlemen (Thief OG’s), I’m not recommending to stick strictly to my SL — trade with your own risk management. Make money and protect it wisely. 💰
🎯 Target Profit (TP)
🎯 Target zone: 580.00
The “Police Force” (strong resistance zone) is waiting up there — where the market could become overbought or trap late buyers. That’s where we take our profit and vanish with gains like pros 😎.
Note: Dear Ladies & Gentlemen (Thief OG’s), again — you can set your own TP. This level is my personal exit zone for safety and profit lock.
🔗 Related Pairs & Market Watchlist
Keep an eye on correlated tech giants and ETFs to confirm momentum:
💻 NASDAQ:AAPL (Apple Inc.) – often leads the NASDAQ tech sentiment.
🌐 NASDAQ:GOOGL (Alphabet Inc.) – confirms sector strength.
📊 NASDAQ:QQQ (NASDAQ 100 ETF) – index pressure or breakout signal for techs.
⚙️ AMEX:XLK (Tech Sector ETF) – broader sector health indicator.
🧠 Correlation Insight:
When Apple ( NASDAQ:AAPL ) or Google ( NASDAQ:GOOGL ) show the same bullish reversal near their moving averages, it reinforces MSFT’s bullish continuation. Strong moves on NASDAQ:QQQ and AMEX:XLK also validate that the entire tech sector is moving in sync.
⚠️ Disclaimer
This is a Thief-style trading strategy, designed for educational and entertainment purposes only — just for fun 🎭.
Trade responsibly and manage your risk accordingly.
✨ “If you find value in my analysis, a 👍 and 🚀 boost is much appreciated — it helps me share more setups with the community!”
#MSFT #SwingTrade #BullishSetup #TechStocks #LayeredEntry #HeikinAshi #HullMA #TradingPlan #StockMarket #ThiefStyle #TradingView #Investing #NASDAQ #PriceAction
Here's What Microsoft's Chart Says Heading Into EarningsMicrosoft NASDAQ:MSFT , which will release earnings next week, is beating the S&P 500 SP:SPX year to date -- up 24.4% vs. about 15.7% for the SPX. MSFT has also gained roughly 112% over the past three years, while the S&P 500 has added just 78.9%. What does the company's chart show us ahead of earnings?
Let's check things out:
Microsoft's Fundamental Analysis
Earnings season is about to heat up. With Netflix NASDAQ:NFLX and Tesla NASDAQ:TSLA having reported results this week, the rest of the Mag-7/FAANGs -- Microsoft, Apple (AAPL), Amazon NASDAQ:AMZN , Meta NASDAQ:META , and Alphabet NASDAQ:GOOG NASDAQ:GOOGL -- will release numbers next week.
MSFT is set to release Q3 results after the closing bell on Wednesday, with the Street looking for the software giant to report about $3.66 in GAAP earnings per share. (Analyst estimates range from $3.50 to $3.78.)
A result like that would compare nicely to the year-ago print of $3.30.
Meanwhile, analysts' consensus estimate projects that MSFT will report $75.4 billion in revenue for the period, with individual forecasts ranging from $70.1 billion to $76.6 billion.
The consensus projection would be good enough for almost 15% in year-over-year revenue growth, in line with the pace of sales gains that Microsoft has regularly produced over the past few years.
All in, 26 of the 32 sell-side analysts I know of that cover Microsoft have revised their earnings estimates higher since the quarter began, while just three have lowered their forecasts. (Three have made no changes.)
Beyond just the quarterly numbers, Microsoft CEO Satya Nadella will have a lot to talk about on the earnings call -- from deals Microsoft has signed to power data centers to contracts with chip designers and LLM providers.
There's just a lot going on right now at Microsoft, from expansion of the firm's AI universe to plans to move a majority of its manufacturing out of Mainland China. A lot of what Nadella says about these things could cause a reaction in MSFT's share price.
Microsoft's Technical Analysis
Next, let's check out MSFT's chart going back some four months and running through Tuesday afternoon:
The first thing you'll see is a cup-with-handle pattern with a $531 pivot, slightly above the $524.65 that Microsoft was trading at Friday afternoon. That's a bullish signal as long MSFT can make a run at the pivot.
That's not all I see, though. Check this other four-month chart out:
This view shows a closing-pennant pattern for the stock.
Now, closing pennants historically tell you that a storm is coming, although as an indicator, they're non-directional. They signal that a violent move is on the way, but can't tell you if it's bullish or bearish.
The first chart suggests that such a move will, in fact, be bullish. But these two charts don't work together, so do we trust one or the other? That's the big question.
In the meantime, Microsoft has been using both its 21-day Exponential Moving Average (or "EMA," marked with a green line in the first chart) and the stock's 50-day Simple Moving Average (or "SMA," denoted with a blue line) for guidance lately.
This suggests that swing traders have not exited the trade, while portfolio managers have not reduced exposure. That's typically a positive unless the stock loses those lines after next week's earnings report. If that happens, you might have a crowded move to the door.
Separately, Microsoft's secondary technical indicators don't offer investors much help at this time.
The stock's Relative Strength Index (the gray line at both charts' tops) is almost perfectly neutral.
However, Microsoft's daily Moving Average Convergence Divergence indicator (or "MACD," marked with black and gold lines and blue bars at both charts' bottoms) is leaning bearish.
The histogram of the 9-day EMA (marked with blue bars) is negative and has been for almost two weeks. That's usually a short-term bearish sign.
Similarly, the 12-day EMA (the black line) is running below the 26-day EMA (the gold line). That's also usually bearish technically.
In fact, the only bullish thing I see in this indicator is that both the 12- and 26-day lines are still in positive territory.
An Options Option
Options investors who want to go long on Microsoft while purchasing downside protection might employ a "buy-write" strategy in this scenario.
This involves purchasing the stock, then selling a covered call against that equity position.
This can reduce net basis (cost), but limits the potential profitability of the investor's Microsoft purchase until the call expires. And the shares could get called away if the short call is assigned.
Here's an example of a buy-write on MSFT:
-- Purchase 100 shares of MSFT at or close to the $522 the stock was trading at when I wrote this.
-- Sell (write) one Oct. 31 call with a $532.50 strike price (the above chart's pivot) for about $9.10.
Investors who want some potential downside protection might also buy a put, which can limit losses until the options trade expires. Example:
-- Buy one Oct. 31 $512.50 put for roughly $8.40.
Investors in this example will have reduced their net basis to $521.30, but will have limited their MSFT stake's potential profitability to 2.2% through the options' Oct. 31 expiration. The trade-off is that these investors will have also capped any losses at 1.7% through expiration as well.
(Moomoo Technologies Inc. Markets Commentator Stephen "Sarge" Guilfoyle was long MSFT and TSLA at the time of writing this column.)
This article discusses technical analysis, other approaches, including fundamental analysis, may offer very different views. The examples provided are for illustrative purposes only and are not intended to be reflective of the results you can expect to achieve. Specific security charts used are for illustrative purposes only and are not a recommendation, offer to sell, or a solicitation of an offer to buy any security. Past investment performance does not indicate or guarantee future success. Returns will vary, and all investments carry risks, including loss of principal. This content is also not a research report and is not intended to serve as the basis for any investment decision. The information contained in this article does not purport to be a complete description of the securities, markets, or developments referred to in this material. Moomoo and its affiliates make no representation or warranty as to the article's adequacy, completeness, accuracy or timeliness for any particular purpose of the above content. Furthermore, there is no guarantee that any statements, estimates, price targets, opinions or forecasts provided herein will prove to be correct.
Options trading is risky and not appropriate for everyone. Read the Options Disclosure Document ( j.moomoo.com ) before trading. Options are complex and you may quickly lose the entire investment. Supporting docs for any claims will be furnished upon request.
Options trading subject to eligibility requirements. Strategies available will depend on options level approved.
Maximum potential loss and profit for options are calculated based on the single leg or an entire multi-leg trade remaining intact until expiration with no option contracts being exercised or assigned. These figures do not account for a portion of a multi-leg strategy being changed or removed or the trader assuming a short or long position in the underlying stock at or before expiration. Therefore, it is possible to lose more than the theoretical max loss of a strategy.
Moomoo is a financial information and trading app offered by Moomoo Technologies Inc. In the U.S., investment products and services on Moomoo are offered by Moomoo Financial Inc., Member FINRA/SIPC.
TradingView is an independent third party not affiliated with Moomoo Financial Inc., Moomoo Technologies Inc., or its affiliates. Moomoo Financial Inc. and its affiliates do not endorse, represent or warrant the completeness and accuracy of the data and information available on the TradingView platform and are not responsible for any services provided by the third-party platform.
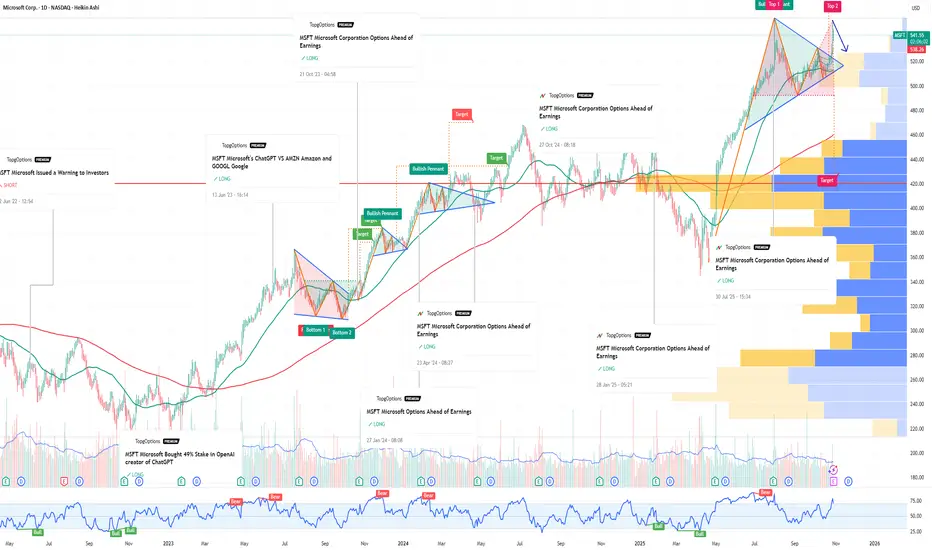
MSFT Microsoft Corporation Options Ahead of EarningsIf you haven`t bought MSFT before the rally:
Now analyzing the options chain and the chart patterns of MSFT Microsoft Corporation prior to the earnings report this week,
I would consider purchasing the 550usd strike price Puts with
an expiration date of 2025-12-19,
for a premium of approximately $26.70.
If these options prove to be profitable prior to the earnings release, I would sell at least half of them.
Why MSFT Could Be a Smart Pick in 2025?MSFT has bullish signals from the multiple moving averages, RSI and volume analysis. However, wave principle asks evidence from the buyers. The wave count suggests that the corrective wave (B) is ongoing, and bears will control the final wave of the primary wave 3.
Wave C will start falling nearby the supply zone and high of the 2nd wave of wave intermediate wave A. Wave C can fall up to 476 which will be the strength for wave primary wave 5. As per the chart, breakout above 540 will be a good signal for bulls to take charge back.
Zones:
Supply zone: 538 - 528
Demand zone: 482 - 476
I will update the chart and details shortly.
MSFT Weekly Outlook (Oct 28–31)MSFT Weekly Outlook (Oct 28–31): “Structure Holding Strong — Can Bulls Reclaim $540 for the Next Leg?”
1. Weekly (1W) — Macro Structure
Microsoft remains firmly in a long-term bullish channel, maintaining higher lows since early 2024. The most recent CHoCH from the mid-2025 correction successfully held above $490, establishing a new structural higher low. Price has now reclaimed momentum, pushing toward the mid-channel resistance near $540–$555.
* Trend Bias: Bullish continuation phase
* Support: $492 → $456 → $400
* Resistance: $540 → $555 → $580
* Momentum: MACD still elevated but flattening — possible early reacceleration phase.
* Stoch RSI: Rebounding from midrange; momentum regaining strength.
💡 Weekly note: The broader uptrend remains clean. Holding above $490 keeps the door open for $555+ retest, with potential acceleration into Q4 if price can close above $540.
2. Daily (1D) — Regaining Control
The daily chart shows a clear BOS confirmation after a multi-week pullback. Buyers defended the $492–$500 demand zone, triggering a structural reversal and push back toward the upper trendline.
* Market Structure: Fresh BOS at $525 → signals bullish continuation.
* Support: $523 → $504 → $492
* Resistance: $540 → $555 → $565
* Indicators:
* MACD histogram flipped positive, confirming renewed momentum.
* Stoch RSI climbing toward upper band — healthy trending behavior.
📈 Daily view: Holding above $523 should lead to a test of $540–$555 next. A daily close above $540 confirms breakout continuation, potentially inviting gamma squeeze into $555–$565.
3. 1-Hour (1H) — Tactical Setup
Intraday chart shows disciplined bullish structure with repeated BOS and demand zones forming around $520–$525. Price is consolidating just below the $534 pivot — a clear inflection point.
* Bias: Intraday bullish while above $523.
* Support: $523 → $520 → $515
* Resistance: $534 → $540 → $550
* Setup Playbook:
* Breakout scalp: Above $534 → target $540–$545, trailing under $528.
* Dip entry: Buy between $523–$525 → target $533–$540.
* Invalidation: Below $520 = pause or short-term fade toward $515–$510.
💬 Scalp insight: The 1H MACD and RSI support an ongoing bullish cycle; however, momentum cooling near $534 suggests a quick retest of $525–$528 before breakout.
4. GEX & Options Sentiment
Based on the GEX overlay:
* Highest Positive NETGEX / Gamma Wall: $540 → $555
* Call Walls: $525 → $540 → $555
* Put Support Levels: $517 → $510 → $502
* IVR: 29.9 (relatively low — supports bullish gamma compression)
* IVx avg: 34.8 (slightly easing, bullish sentiment intact)
* Call Bias: 27.3% — neutral-to-bullish tilt.
🧩 Interpretation:
As long as MSFT remains above $523, options flow favors an upward drift into $540–$555 gamma cluster. Below $520, the momentum could unwind toward the $510–$505 put zone.
5. Suggested Options Scenarios
Bullish (preferred while > $523):
* Play: 530C–540C (0–2DTE) breakout setup.
* Entry: Above $534 breakout confirmation.
* Targets: $540 → $545 → $555
* Stop: Below $520
* Spread Alternative: 530/545 debit spread for defined risk if IV spikes post-breakout.
Dip-Buy Opportunity:
* Play: 525C (1DTE) near $523 retest.
* Target: $534 → $540
* Stop: Below $520
Bearish Hedge (only below $520):
* Play: 515P (1DTE) targeting $510 → $505.
* Stop: Back above $525
Directional Bias
Microsoft is holding strong across all timeframes. As long as $523–$525 support continues to defend, structure favors upside extension into $540–$555.
🎯 Primary Bias: Bullish continuation
⚠️ Invalidation: Breakdown below $520 → potential reversion toward $505 demand
This analysis is for educational purposes only and does not constitute financial advice. Always do your own research and manage risk before trading.

Google, Meta & Microsoft Daily Trade SetupsIn this update we review the recent price action in Google, Meta & Microsoft and identify the next high-probability trading opportunities and price objectives to target. To review today's video analysis, click here!

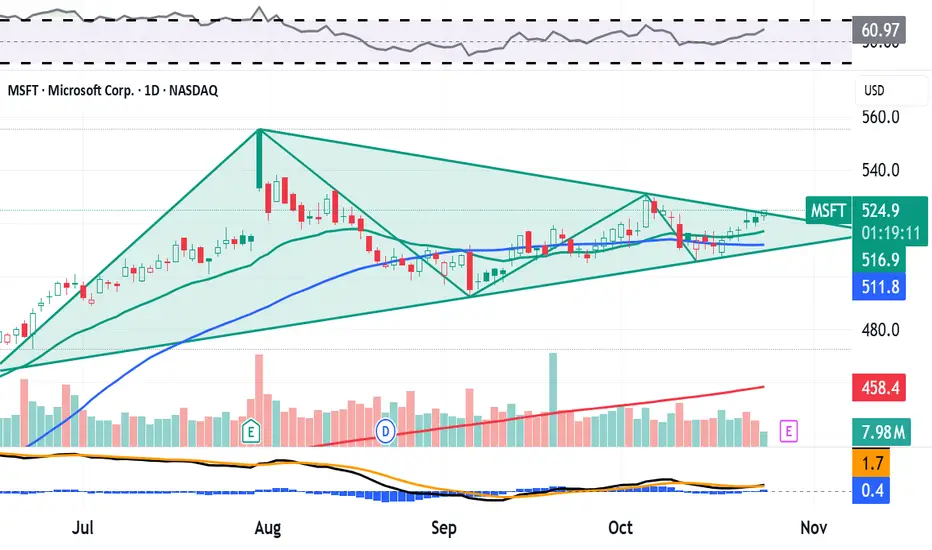
Cup & Handle Heading into EarningsNASDAQ:MSFT is forming quite a large cup and handle within a larger symmetrical triangle after closing the week, bouncing off the 20-day EMA. NASDAQ:MSFT 's bollinger bands are squeezing as well as it heads into earnings this week, along with the rest of the Mag 7- Just some support levels and some RSI-based supply and demand zones to keep an eye on - Bullish Long

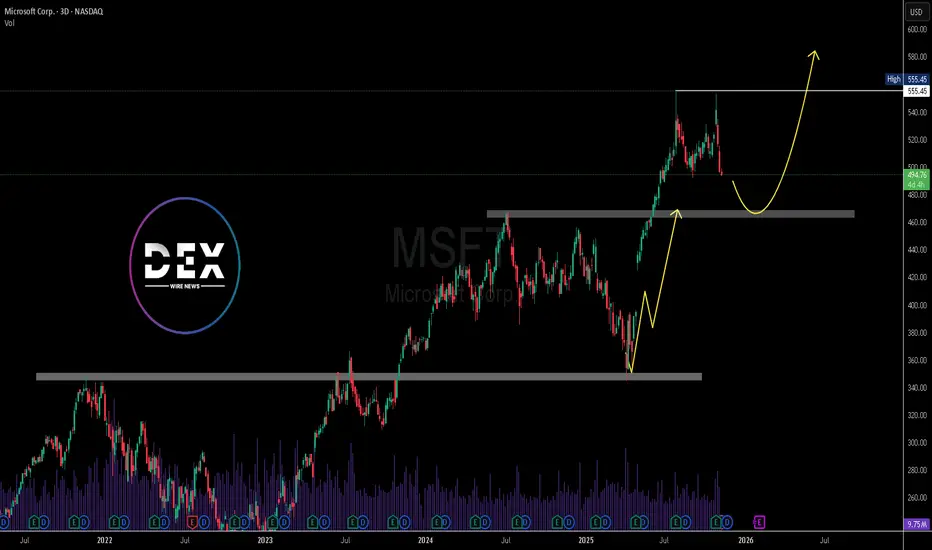
Microsoft Corp.($MSFT) Pullback Forms as AI Momentum Face Test Microsoft Corp. (Nasdaq: NASDAQ:MSFT ) stock slipped 0.34% to $495.43 on Thursday, extending its recent decline from October highs near $555. The retreat reflects broader consolidation in large-cap tech after months of AI-driven gains, with investors reassessing valuations ahead of the company’s next earnings release expected in late January 2026.
The pullback comes as Microsoft’s AI ecosystem continues to evolve rapidly. The company has integrated OpenAI-powered tools across its product lineup, including Microsoft 365, Azure, and GitHub, solidifying its leadership in enterprise AI solutions. However, concerns over slowing cloud revenue growth and competition from Amazon and Google have sparked short-term caution among traders.
Microsoft’s Intelligent Cloud segment remains a core growth driver, generating over $26 billion last quarter. Yet analysts have warned that enterprise clients may delay large-scale AI spending as they evaluate efficiency gains from early deployments. That has prompted expectations for slightly softer Azure revenue growth in the coming quarters.
From a technical perspective, the MSFT chart indicates a potential corrective phase after a strong two-year rally. The price has retreated from resistance around $555, with the next significant support seen near $460, a level that previously acted as a breakout zone. The projected yellow path on the chart suggests a possible retest of that support before a renewed advance toward $580.
Overall, Microsoft’s long-term trend remains bullish, driven by its expanding AI infrastructure, consistent cash flow, and dominant software ecosystem. However, near-term volatility could persist as the market digests regulatory updates and adjusts to a more moderate growth outlook in the AI sector.
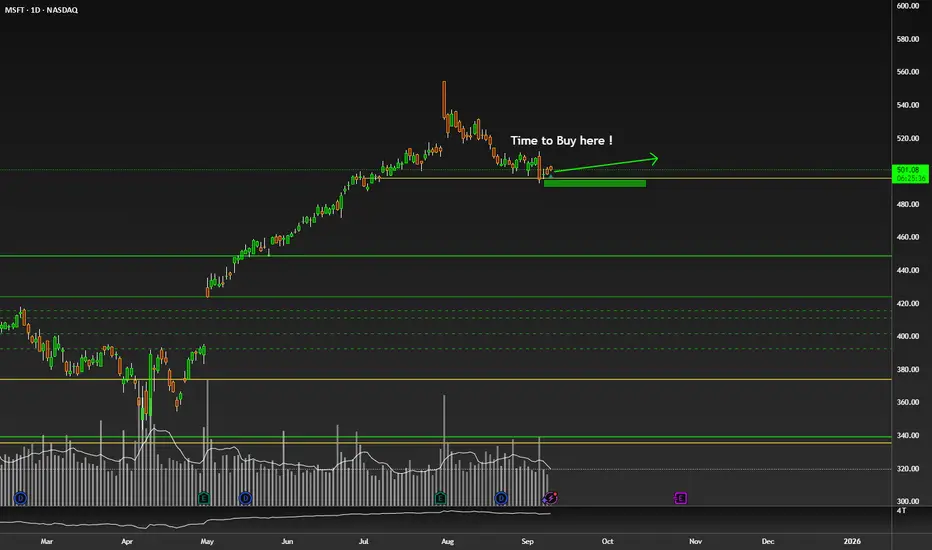
$NASDAQ:MSFT Nice Area to Long or Accumulation !NASDAQ:MSFT Nice Area to Long or Accumulation !
Price Action Tells Every thing !
Cooled already here.
Accumulation place.
nice support area.
Boost if you agree !
Msft monthly chart it's time to sell Microsoft
I am not interesting to buy or go long now
Good luck 4all

Microsoft (MSFT)It's very important that the double top's neckline not be broken. It's hovering around $500.
The market may take a breather, even though the outlook is good and earnings are growing, it has risen too much, too quickly. OpenaAI has created enormous expectations that, based on current figures, will take longer to materialize.
