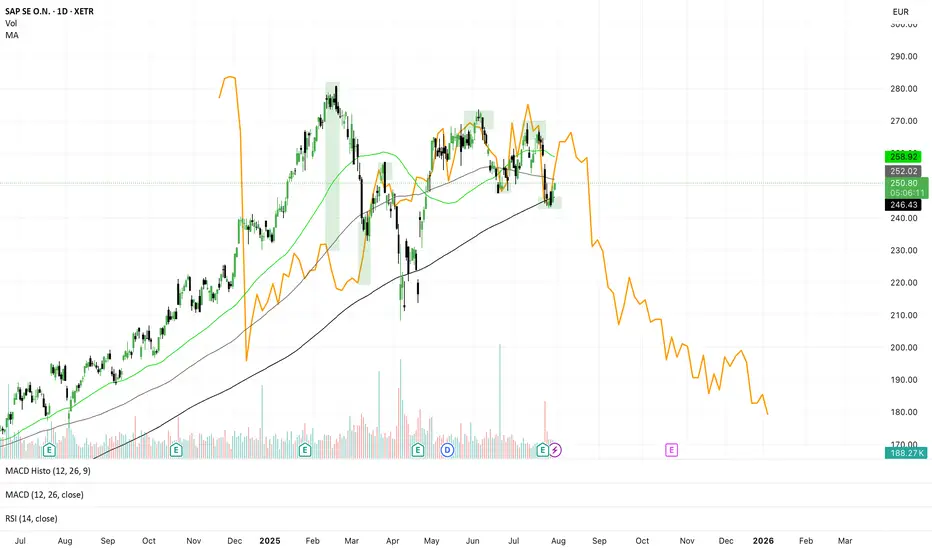
SAP Gann-Method... down potential📈 SAP SE – Gann Projection Signals Major Downside Risk
📅 July 30, 2025 | TF: Daily | Ticker: SAP.XETR
🧠 Concept
Using a historical correction (orange line) from SAP’s past — projected into the future using Gann symmetry — we might be witnessing a repeating time-price pattern. This method suggests t
Key stats
About SAP SE
Sector
Industry
CEO
Christian Klein
Website
Headquarters
Walldorf
Founded
2014
ISIN
CA78437E1088
FIGI
BBG01S9MJN17
Related stocks
SAP - LONG Swing Entry PlanNYSE:SAP - LONG Swing Entry Plan
Entry Zone 1: $283.00 – $282.00
→ Open initial position targeting +8% from entry level.
Entry Zone 2: $274.00 – $273.00
→ If price dips further, average down with a second equal-sized entry.
→ New target becomes +8% from the average of Entry 1 and Entry 2.
Edit

SAP: Macro PotentialPolitical uncertainty and questionable economic policies from the U.S. administration are eroding investor confidence globally, prompting a search for more reliable investment opportunities outside the U.S.
Currently, the performance of European stock markets is outpacing that of the U.S. markets.

25% until the end of the year
If the last two years's trend continues, until the end of the year it may see 25% increase.

SAP NOISE CANCELLATION. Rising wedge finding middle now. expect continued rise after correction. real fall wont be until a retest in a couple of years. hard corrections until we level out. good luck

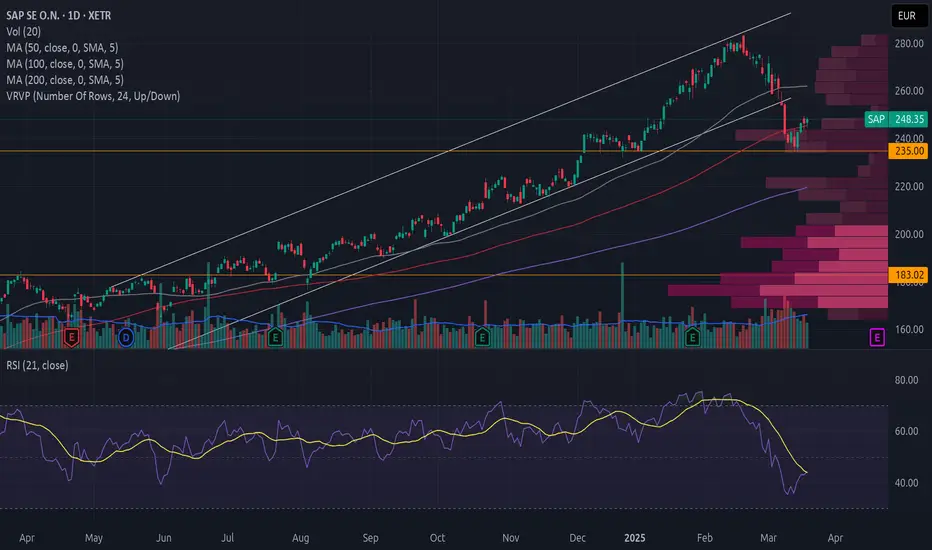
Should You Buy SAP After Its Price Drop?
SAP has broken down from an upward trend with high volume.
The price decline has stalled around the resistance level at 235. The volume profile shows a sharp drop in trading activity at this level when prices approach from both below and above, making this a significant resistance zone.
There are
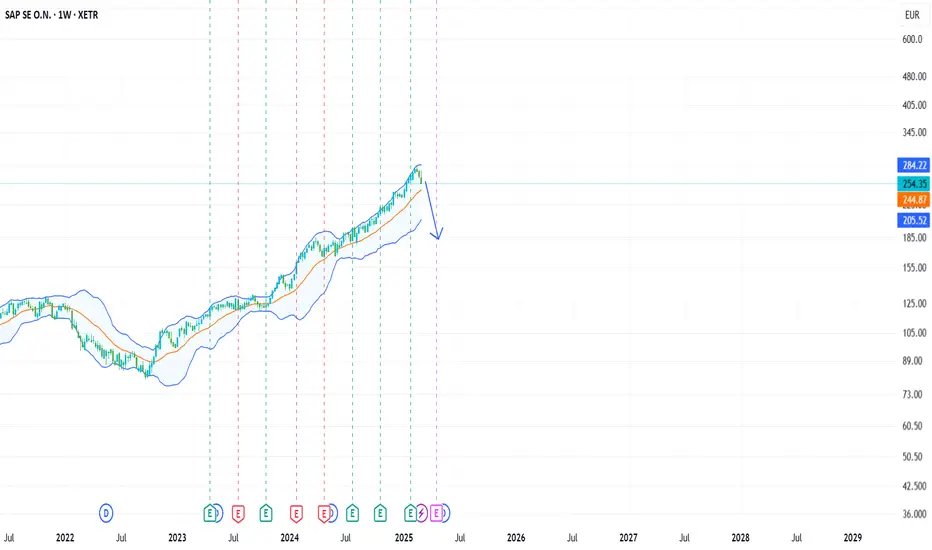
SAP a bit short on a very boring stockNot really worth to short at the moment, since the stock is extreme strong with its buying power for example because of share buying programms for SAP workers. But that means also the stock climbs very slow. (Low risk - low potential)
SAP - could this be the top for the main driver of the DAX ?SAP has the highest market cap in the DAX (315 billion €) and has had an impressive run since the 2022 lows. Price shot up from 80 to 280 in one steep channel.
Looking at the chart since the IPO, you can see a five wave structure that might have come to an end at the upper trendline of the channel
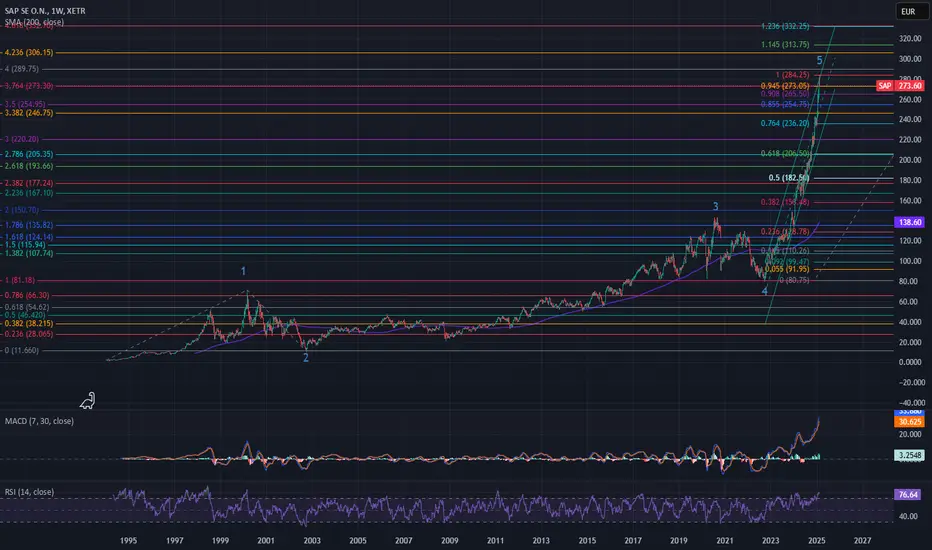

SAPSAP - Monthly from the beginning year 94 - Strong uptrend since '22.
A few companies determine the performance of the German DAX. One of these "tanks" is SAP. The chart seems to be on its way to 310.80 EUR per share, a Fibonacci-Extension in green. This level represents the end of Cycle wave III in

See all ideas
A2G8VT
SAP SE 1.0% 13-MAR-2026Yield to maturity
—
Maturity date
Mar 13, 2026
A2TSTF
SAP SE 1.25% 10-MAR-2028Yield to maturity
—
Maturity date
Mar 10, 2028
SAPM
SAP SE 1.625% 10-MAR-2031Yield to maturity
—
Maturity date
Mar 10, 2031
A2G8VU
SAP SE 1.375% 13-MAR-2030Yield to maturity
—
Maturity date
Mar 13, 2030
SAPF
SAP SE 1.75% 22-FEB-2027Yield to maturity
—
Maturity date
Feb 22, 2027
XS217671566
SAP SE 0.375% 18-MAY-2029Yield to maturity
—
Maturity date
May 18, 2029
XS217671558
SAP SE 0.125% 18-MAY-2026Yield to maturity
—
Maturity date
May 18, 2026
See all SAP0 bonds
Curated watchlists where SAP0 is featured.

Big software stocks: Red pill gains
9 No. of Symbols
See all sparks
Frequently Asked Questions
Depending on the exchange, the stock ticker may vary. For instance, on FWB exchange SAP SE CAD Hedged CIBC CDR stocks are traded under the ticker SAP0.
SAP0 reached its all-time high on Feb 18, 2025 with the price of 17.6 EUR, and its all-time low was 12.2 EUR and was reached on Apr 22, 2025. View more price dynamics on SAP0 chart.
See other stocks reaching their highest and lowest prices.
See other stocks reaching their highest and lowest prices.
No, SAP0 doesn't pay any dividends to its shareholders. But don't worry, we've prepared a list of high-dividend stocks for you.
Like other stocks, SAP0 shares are traded on stock exchanges, e.g. Nasdaq, Nyse, Euronext, and the easiest way to buy them is through an online stock broker. To do this, you need to open an account and follow a broker's procedures, then start trading. You can trade SAP SE CAD Hedged CIBC CDR stock right from TradingView charts — choose your broker and connect to your account.