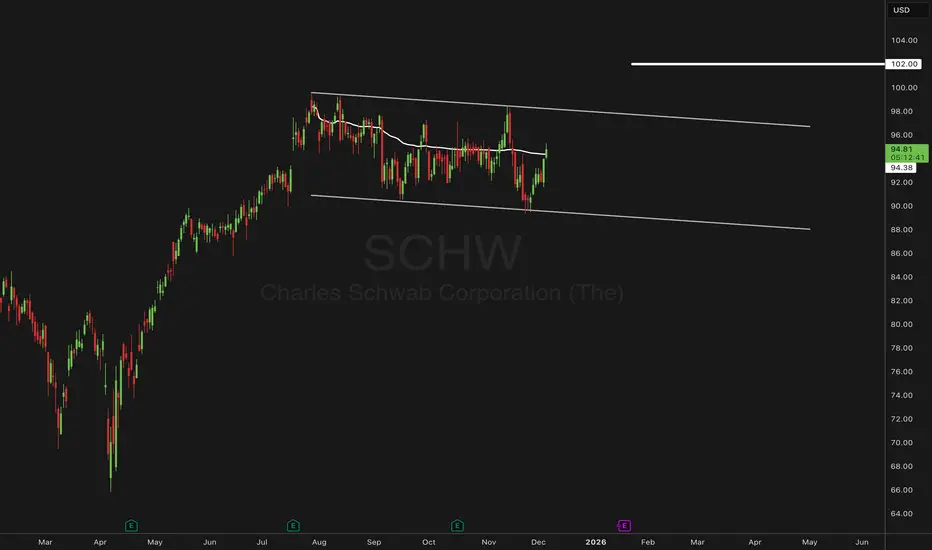
SCHW | Bull-Flag Structure & AVWAP Break with a 102 TargetSCHW has been trading inside a broad bull-flag channel since late summer. This week’s price action broke above the anchored VWAP, a level that has repeatedly acted as a mean-reversion barrier during this consolidation. The breakout shifts focus toward the upper boundary of the flag and the next area of interest near $102.
The $102 zone represents just over a 7% move from breakout levels. This is important because this sits inside the 75th percentile of the stock’s historical return distribution. In other words, it’s a move that is historically frequent enough to be statistically reasonable while still offering meaningful extension. It also remains comfortably within SCHW’s typical monthly standard deviation (~11%), keeping the scenario aligned with the stock’s normal volatility profile.
Scenarios:
If price holds above the anchored VWAP → momentum could extend toward the flag’s upper rail and the 102 zone.
If price slips back below VWAP → the pattern may revert into further range-bound behavior within the existing flag.
$102 is the key upside zone—a statistically reasonable extension and the next decision point if the bull-flag breakout holds.
Trade ideas
SCHW watch $95.31-95.72: Key Resistance zone holding up new ATHSSCHW is testing a key resistance zone at $95.31-95.72
Looking for a Break-n-Retest to start the next leg up.
Next move should go into new All Time HIgh prices.
.
Previous Analsys that caught a PREFECT Dip-Buy
Hit BOOST and FOLLOW for more such PRECISE and TIMELY charts.
=========================================================
.

I Found Where $73M in Volume Got Stuck### Market Structure & Footprint Discovery
Charles Schwab presents a compelling institutional accumulation setup with an extraordinarily rare footprint pattern. Six consecutive trading sessions have established their Point of Control (highest volume node) between $92.11-$92.41, creating what footprint traders recognize as a high-conviction institutional demand zone .
The numbered wave structure reveals critical market mechanics:
- Point 1 → 3: Buyers at Point 2 successfully defended and pushed above Point 1, establishing proven market participants
- Point 2: Now confirmed as institutional accumulation zone
- Point 3 → 4: Natural retracement approaching proven buyers with multiple confluences
### Volume Footprint Intelligence
The granular footprint analysis from September 5-12 exposes sophisticated accumulation patterns:
Six-Session POC Alignment: The horizontal alignment of six black boxes (POC areas) at $92.11-$92.41 represents sustained institutional interest . This phenomenon is exceptionally rare and typically marks major support.
September 9 at 6:30 AM: Price reacted bullishly from imbalance at session low, confirming aggressive buyers defending this zone.
September 11 at 6:30 AM: Stacked bullish imbalances precisely at the POC alignment zone, with Delta showing 24.89K despite selling pressure—classic absorption signature .
Delta Divergence Pattern: Multiple instances of negative delta with price holding or advancing, including -53.22K delta on September 10 with price maintaining support. This indicates smart money absorbing retail selling .
### Multi-Timeframe VWAP Analysis
The VWAP confluence creates a gravitational pull at our target zone:
- Earnings VWAP: Third standard deviation aligns with footprint POC
- Dividend VWAP: Second standard deviation confluence at $92.25
- Monthly VWAP: First standard deviation intersecting target zone
- Previous Flow VWAP: Price pulled back from first deviation, targeting second
This quadruple VWAP confluence combined with footprint POC creates an institutional magnet zone.
### Technical Oscillator Divergences
Multiple indicators confirm accumulation while price makes lower lows:
- OBV: Higher low with Bollinger Band touching second deviation
- RSI: Clear bullish divergence pattern
- MFI: Momentum divergence suggesting buying pressure
- CDV Candles: Escalating pattern showing three returns with progressively higher highs
### Andrews Pitchfork Validation
The pitchfork anchored on three significant pivots shows reversal precisely at Point 4, with CDV candles confirming the turn at median line support.
### Risk Management Framework
Primary Entry: $92.11-$92.41 (POC zone)
Secondary Entry: $91.35-$91.80 (VWAP support)
Stop Loss: $89.71 (below Point 2 structure)
Position Sizing: Risk 1-2% of capital
### Trade Execution Strategy
Entry Tactics:
- Place limit orders throughout $92.11-$92.41
- Monitor delta for absorption confirmation
- Watch for bullish imbalance stacking
- Confirm POC holds on retest
Exit Strategy:
- Trail stop to breakeven at $98
- Secure 40% at T1 ($98)
- Take 30% at T2 ($102)
- Hold 30% for T3 ($108+)
### Probability Assessment
This setup combines exceptional technical factors:
✅ Six-session POC agreement (extremely rare)
✅ Quadruple VWAP confluence
✅ Multiple oscillator divergences
✅ Delta absorption pattern confirmed
✅ Risk/Reward 1:6.2 at full target
✅ Strong analyst support ($108 consensus)
The convergence of footprint intelligence showing six sessions of institutional agreement, combined with VWAP mathematics and divergence patterns, creates a high-probability institutional entry opportunity.
⚠️ Disclaimer: This analysis represents technical observations only. Past volume patterns don't guarantee future price action. Manage risk appropriately.

Charles Schwab Stock Chart Fibonacci Analysis 090825Trading Idea
1) Find a FIBO slingshot
2) Check FIBO 61.80% level
3) Entry Point > 93.5/61.80%
Chart time frame:C
A) 15 min(1W-3M)
B) 1 hr(3M-6M)
C) 4 hr(6M-1year)
D) 1 day(1-3years)
Stock progress:A
A) Keep rising over 61.80% resistance
B) 61.80% resistance
C) 61.80% support
D) Hit the bottom
E) Hit the top
Stocks rise as they rise from support and fall from resistance. Our goal is to find a low support point and enter. It can be referred to as buying at the pullback point. The pullback point can be found with a Fibonacci extension of 61.80%. This is a step to find an entry-level position. 1) Find a triangle (Fibonacci Speed Fan Line) that connects the high (resistance) and low (support) points of the stock in progress, where it is continuously expressed as a Slingshot, 2) and create a Fibonacci extension level for the first rising wave from the start point of the slingshot pattern.
When the current price goes over the 61.80% level, that can be a good entry point, especially if the SMA 100 and 200 curves are gathered together at 61.80%, it is a very good entry point.
As a great help, TradingView provides these Fibonacci speed fan lines and extension levels with ease. So if you use the Fibonacci fan line, the extension level, and the SMA 100/200 curve well, you can find an entry point for the stock market. At least you have to enter at this low point to avoid trading failure, and if you are skilled at entering this low point, with the fibonacci6180 technique, your reading skill of to chart will be greatly improved.
If you want to do day trading, please set the time frame to 5 minutes or 15 minutes, and you will see many of the low points of rising stocks.
If you prefer long-term range trading, you can set the time frame to 1 hr or 1 day
$SCHW - Trade Idea for 8/15DAILY - 3-1 SETUP
WEEKLY - 3-1-2U REV
MONTH - INSIDE CANDLE
QUARTER 3-2U
This is something you could scale into as well depending on the risk you are willing to take.

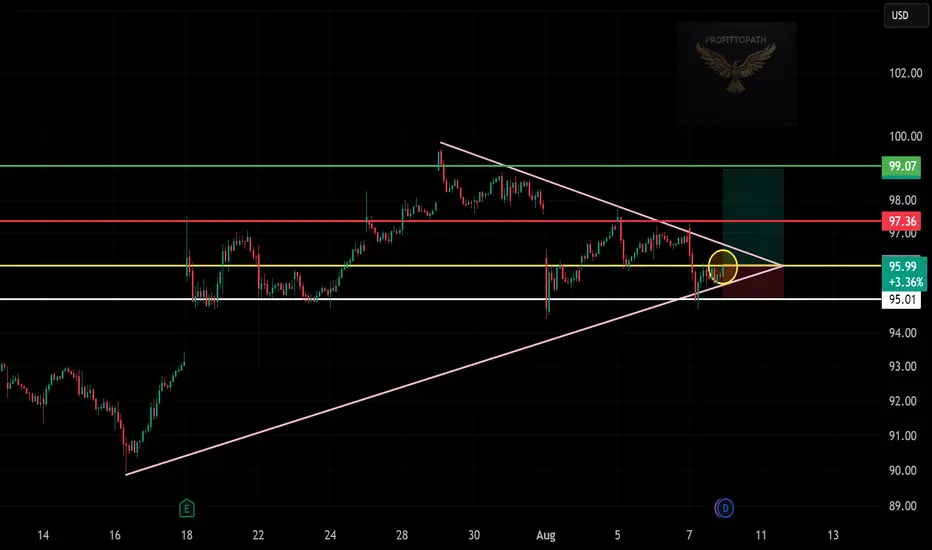
SCHW Long Setup!📈
Price forming bullish breakout from wedge 📊
📍 Entry: ~$95.99
🎯 Target: $99.07
🛑 SL: $95.01
Watching for volume to confirm upside move 🚀
Charls Schwab Long TradeSeems good here, goal is to go for ATH otherwise risk to reward is not worth.
Looks promising but pullback to VAH is possible
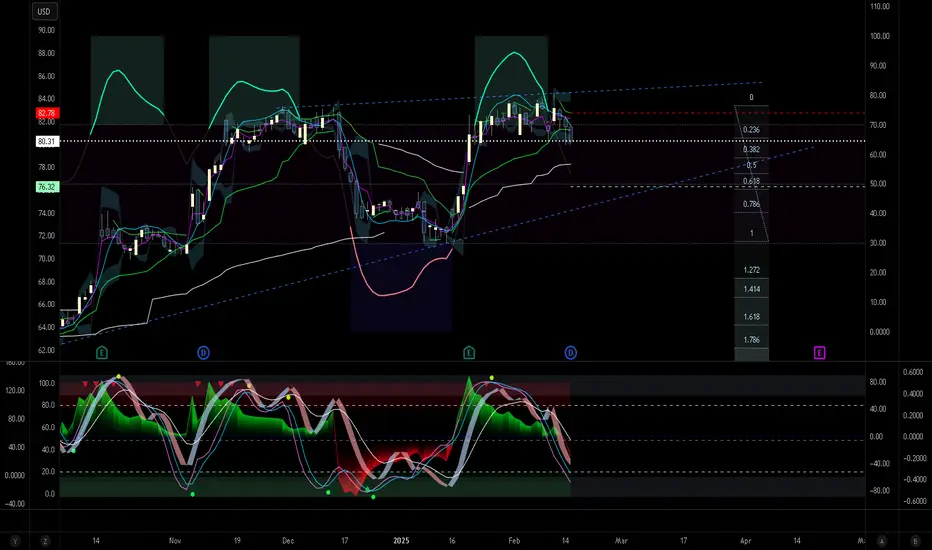
SCHW heads up into $83: major resistance that could mark a TOP?SCHW has been rising with the financials tide after Trump win.
Now testing a major resistance of Golden Genesis + Covid fib.
Looking for a pullback or Break-and-Retest for the next move.
$ 82.54 - 83.55 is the exact zone of interest.
$ 75.74 - 76.03 below is the first strong support.
$ 95.42 - 95.72 is the next major resistance above.
=======================================================

Charles Schwab ($SCHW) Upgraded by Morgan Stanley to Overweight Morgan Stanley has taken new rating actions on financial exchanges and brokers as markets face heightened uncertainty. The investment bank highlighted concerns over economic growth, sticky inflation, and interest rate paths. Recession fears and tariff-induced volatility have also rattled investor confidence.
According to Morgan Stanley, such conditions increase the need for hedging, trading, and risk management by corporations and asset owners. The note added that the recent market sell-off may discourage retail investor activity, especially as portfolio losses and margin calls mount.
Despite these challenges, Charles Schwab (NYSE: SCHW) received an upgrade to Overweight. The firm cited Schwab’s more stable earnings profile and strong fundamentals. Morgan Stanley sees a 20% annual EPS growth for Schwab over the next two years. The bank also noted Schwab’s resilience amid the volatile macro environment.
Technical Analysis
Charles Schwab's stock is showing strength despite the broader market downturn. Price action recently formed an inverted Head and Shoulders pattern. This is aligned with an ascending trendline that dates back several months.
Currently, SCHW is testing a solid horizontal support level that confluences with the trendline near $70. If momentum remains strong, the next potential target is $84, the high from February 2025. The bullish chart formation, combined with Morgan Stanley’s upgrade, supports a possible price surge from the current level.

SCHW $86 Next? Or Double top flush? SCHW to $86 by March 18th? Or flush under $79? Looks like it is bouncing on key levels looking left. Volume is lower than its 30D AVG. $81.80 is the level i will be watching to reject or push through. GL!

Fail to Breakout on Schwab. SCHWThere is probably a discernable Jurik RSX divergence on a higher time chart, as there is one VZO on this 12 hourly. And it would make sense. A good spot for entry here, as MIDAS line cross on the background of price action superior cross of vWAP and US lines. More technicality below- there is a cross of zero line on BB %PCT, and both Ehlers Stochastic RSI and VZO with offset are truly bearish. We might bounce at diagonal trendline painted in blue below.
Buy Trade Strategy for SCHW Banking on Financial Services GrowthDescription:
This trading idea focuses on SCHW (Charles Schwab Corporation), one of the largest financial services firms in the U.S., known for its brokerage, wealth management, and banking solutions. SCHW has established a strong market presence by offering innovative financial products and competitive pricing, which have attracted a growing customer base. The company’s diversified revenue streams, including interest income and asset management fees, provide stability even in volatile market conditions. With ongoing digital transformation and increasing demand for low-cost investment solutions, SCHW is well-positioned for long-term growth.
Despite its solid fundamentals, SCHW is still subject to external market forces, such as changes in interest rates, regulatory developments, and macroeconomic trends, which can impact its performance. As a result, investors should carefully assess the risks and opportunities before entering a position.
Disclaimer:
This trading idea is for educational purposes only and does not constitute financial advice. Trading stocks like SCHW involves risks, including the potential loss of capital. Always conduct thorough research, understand your financial situation, and consult with a financial advisor before making any investment decisions. Past performance is not indicative of future results.

SCHW's Weekly Pour: A Cup, a Handle, and a Bullish Refill?Been tracking SCHW, and this chart is shaping up to be something big—potentially a breakout from a range that’s been developing since early 2022. Price is pressing up against key resistance around $95-$100, and a clean break above this level could confirm a multi-year breakout, opening up the possibility of a much larger trend move. With Fibonacci extensions lining up at $150 and $200, this could be one of those slow-burn setups that eventually pays off in a big way. Let’s break it down.
Fibonacci Extensions and Multi-Year Price Targets
The way this chart is structured, $95-$100 is the final boss. If price convincingly clears that level, it breaks a massive range that’s been in place for over two years. If that happens, $150 (the 161.8% Fib extension) and $200 (the 261.8% extension) are the next major upside targets. These aren’t short-term price points—this is the kind of move that could play out over multiple years. But historically, when a stock coils for this long and then breaks out, the measured move potential is huge.
Moving Averages and Long-Term Trend Shift
Right now, we’ve got price trading above both the 50-week and 200-week moving averages, signaling that momentum has already started to shift. The 50-week MA is curling upwards, and if we see it hold above the 200-week, that would mark a long-term trend shift that typically aligns with sustained upside moves.
Mapping Out the Breakout Scenarios
If we do get a breakout, here’s how I see it playing out:
1️⃣ Break Above $100 → Multi-Year Uptrend Begins – A confirmed break and hold above $100 shifts the entire structure bullish, setting up an eventual run to $150 and possibly $200 over the next couple of years. This would be the full resolution of the pattern that has been developing since early 2022.
2️⃣ Rejection at $95-$100 → Pullback Before Breakout – If price gets stuffed at resistance, we could see a pullback to the $75-$80 zone before another breakout attempt later in 2025. This would act as a final shakeout before the bigger move.
----------------------------------------------------------
All eyes on $95-$100. That’s the level that determines whether this just grinds sideways for another year or finally starts a major new uptrend. If it breaks, we’ve got a clear roadmap to $150 and $200 in the coming years.
Curious if anyone else is watching this. Are we about to see the start of something big, or is there one more fakeout before the real move?
Not financial advice. Just charting things out. Let’s see what happens.

10/11/2024 - Here is a new BUY breakout chosen mechanically: 10/11/2024 - Here is a new BUY breakout chosen mechanically:
Stop @ $61.74
Entry Buy @ $67.54 or greater
Target @ $77.18

$SCHW with a bullish outlook following its earnings #StocksThe PEAD projected a bullish outlook for NYSE:SCHW after a positive over reaction following its earnings release placing the stock in drift B with an expected accuracy of 50%.


$SCHW Schwab is flagging for its next move!Bear flagging on the weekly chart! Worth keeping on the radar for a break lower. (I'm short financials via June 2025 $45 puts)

An opportunity to accumulate SCHW call options exp in Jan 2025TD also announced today that it has sold 40,500,000 shares of common stock of The Charles Schwab Corporation ("Schwab"). The share sale will reduce TD's ownership interest in Schwab from 12.3% to 10.1%. In connection with this sale, TD has agreed not to sell any additional Schwab shares for a period of 45 days, subject to certain exceptions. TD has no current intention to divest additional shares.

8/21/24 - $SCHW - Oppty cost too high >$508/21/24 :: VROCKSTAR :: NYSE:SCHW
Oppty cost too high >$50
- will start by saying, i think these businesses are much more cyclical and slow moving than what i typically look at
- the stock has been pretty dead money esp on it's SPY comp for a few years at this pt
- the key here will be whether the right EPS is $4 or $5 in the coming year ('25 let's say). the street is optimistic we go from $3 to $4, but wall street is always optimistic (keep that in mind).
- if the truth is, these guys somehow re invigorate growth (i have a schwab account btw and really don't enjoy having it but the alternatives, admittedly also suck)... the stock is probably getting interesting if we enter the $50s.
- but for me to pull the trigger i'd like to see something sub 15x and without any degradation of the macro i.e. some "banking" crisis type headline that sends all these things in passive funds without any bids and that's where we can scoop value.
- if you're a patient investor that *needs* some banks/ financials exposure i'd say i'd still prefer NASDAQ:HOOD (but not at current levels) because I think they are ultimately a better UX and beneficiary of a lot of generational flows.
- $62 on $4 of EPS is 15x. needs to prove that's the case in the coming 6 months (i'm not close enough). if we start entering low GETTEX:50S say $50 itself... on something closer to $4...$4.5 in the coming year - now we're talking.
- too many words to say... i think i can do better in this environment and not have the feeling that i need to babysit the position. if i really really wanted to own it, perhaps i'd sell some call options for income. just don't see the catalyst.
V

Charles Schwab Crashed Again Amid Market MeltdownKey Takeaways:
- Multiple investment platforms, including Charles Schwab, experienced technical outages during a significant market sell-off.
- Thousands of login issues were reported, adding to investor frustration during a volatile market period.
- The outages lasted about three hours, impacting user access to accounts via mobile apps and online platforms.
- Market volatility was driven by a weak labor report and concerns over a potential severe economic downturn.
In a turbulent day for the financial markets, Charles Schwab and other major investment platforms faced significant technical issues, leaving investors unable to access their accounts during a critical time. The outages occurred amid a market meltdown, further exacerbating investor frustrations.
Widespread Technical Outages
Starting around 9 a.m. ET, multiple investment platforms, including Charles Schwab, Fidelity, Vanguard, Ameritrade, eTrade, and Robinhood, went offline. According to Downdetector.com, the incident lasted approximately three hours, with nearly 15,000 issues reported for Charles Schwab, 3,500 for Fidelity, 3,000 for Vanguard, and 2,000 for Ameritrade.
Users reported being unable to log in to their accounts via mobile apps or online platforms. This issue was reminiscent of a similar incident Charles Schwab encountered in June when over 5,800 users experienced login problems.
Market Volatility and Investor Impact
The timing of the outages couldn't have been worse. A weak labor report released on Friday triggered a severe market sell-off, leading to what is being termed a stock market “meltdown.” Wall Street’s main indexes tumbled, with the Dow Jones Industrial Average closing down 1,034 points, or 2.6%, after dropping more than 1,200 points at its lowest point of the session. Shares of Charles Schwab fell by 1.7%, slightly better than the broader market decline.
Investors, already on edge due to the market volatility, faced additional stress due to the inability to manage their portfolios during the downturn. The outages left many unable to execute trades or access critical account information during a period of frenzied trading.
Company Responses and Resolution
Charles Schwab (NYSE: NYSE:SCHW ) and other affected platforms were quick to acknowledge the issues. Charles Schwab (NYSE: NYSE:SCHW ) took to X (formerly Twitter) to announce, “A technical issue experienced by some clients has been resolved. We apologize for the inconvenience.” The firm posted an update at 12:38 p.m. ET, confirming that the issue had been resolved.
Fidelity Investments also responded to complaints on social media, assuring users that their login issues had been addressed. Vanguard issued a statement acknowledging temporary issues for some clients on Monday morning, which have since been resolved. Steve Sanders, EVP of marketing and product development at Interactive Brokers, stated that their platform did not experience widespread outages.
Future Outlook and Investor Confidence
While the technical issues appear to have been resolved, investors should not rely on these platforms for real-time access to their accounts and the ability to make timely decisions. Any disruption, especially during market volatility, can lead to significant financial and emotional stress.
Technical Outlook
Despite recent market turbulence and a technical glitch experienced by Charles Schwab stock (NYSE: NYSE:SCHW ), the assets appear to have appreciated by 0.5% as of the time of writing on Tuesday's market trading. The daily price chart illustrates a weak Relative Strength Index (RSI) of 32.71, indicating a potential trend reversal or further price decline.
The chart of Charles Schwab stock (NYSE: NYSE:SCHW ) has exhibited multiple inverse shoulder and head patterns, with the current pattern seemingly in the formation of a shoulder.
Conclusion
The technical outages at Charles Schwab and other investment platforms amid a market meltdown have underscored the importance of reliable access to financial services. As markets remain volatile, ensuring uninterrupted service will be key to maintaining investor confidence. For now, investors can only hope that such incidents are addressed swiftly to prevent future disruptions during critical trading periods.

SCHW LONG (read why)SCHW, after the last earnings season on July 16th, recorded a sharp collapse, losing over 19% in just 4 sessions. The market is saying this stock is overvalued despite above-expected earnings and revenue. The profile volumes you see in the image are completely unbalanced. In just a few ticks, very high volumes were collected for price protection. Today the price touched the floor of a parallel channel and, with momentum given by volumes, the price seems to have resumed the positive trend. Today, taking a long look at this stock is advantageous for the following reasons:
1 good fundamentals: this stock, generous in dividends, has excellent fundamental data and for these reason it is worth holding it for investing.
2 Trading with excellent risk-return ratio: Nonetheless, you would expose yourself to a small loss (subject to choosing the right money sizing) in the face of an ambitious TP.
Friendliness

Almost Guranteed Bounce and MacD cross over on the 3rd STD.
Hit the midline with the calls or puts, 9/10 your a winner NYSE:SCHW

SCHW BUY BUY BUY+++++++++++++++++++++++Way oversold! Buy for a bounce! Not to own but a TRADE! We should retrace to $68.96 and second target is $70.76. They are pausing a share buyback to pay down debt the stock is highly oversold here!
