SNPS - wedgeSNPS - formed a wedge on low volume.
I expect volume to come here next days.
I will be watching for entry after 8EMA recapture.
Synopsys, Inc.
No trades
Trade ideas

Navigating the Chip Maze: Should You Invest in Synopsys?Navigating the Chip Maze: Should You Invest in Synopsys?
Synopsys, a titan in the Electronic Design Automation (EDA) landscape, offers intriguing prospects for investors curious about the semiconductor industry. But before diving in, let's unpack the company, analyze its potential, and explore options – with a strong disclaimer: trading is inherently risky and not suitable for everyone.
Synopsys: Powering the Chip Revolution
Founded in 1986, Synopsys has carved a niche by providing essential tools and services for chip design and verification. Imagine them as the architects and inspectors of the tiny brains powering our devices. Their clients? Tech giants like Apple, Intel, and Samsung, relying on Synopsys for efficient, secure chip development.
Products and Services:
EDA Tools: The bread and butter – software enabling chip design, simulation, and verification.
Silicon IP: Pre-designed building blocks, saving chipmakers time and money.
Software Security and Quality: Tools to identify and fix vulnerabilities in software, crucial in an increasingly interconnected world.
Financials and Performance:
Revenue: $5.3 billion (FY 2023)
Net Income: $1.2 billion (FY 2023)
Ratings: Leader in Gartner's Magic Quadrant for EDA, "100 Best Companies to Work For" by Fortune
So, Buy, Sell, or Hold?
This is where things get tricky. Analysing publicly available information can't guarantee future performance. Several factors could influence Synopsys' stock price:
Overall Semiconductor Market: A booming market benefits Synopsys, but downturns can impact sales.
Technological Advancements: Staying ahead of the curve in EDA is crucial, and continuous innovation is key.
Competition: Other EDA players like Cadence Design Systems pose constant competition.
Options Trading: A Calculated Gamble?
Remember, options involve significant risks. Buying call options bets on a stock price increase, while put options profit from a decrease. With expirations ranging from 1-12 months, you choose your timeframe and risk tolerance. However, options decay in value over time, and misjudgment can lead to substantial losses.
The Verdict: Do Your Research, Proceed with Caution
Synopsys is a prominent player in a growing industry, but the decision to invest ultimately rests on your individual financial goals and risk appetite. Conduct thorough research, understand the risks involved, and never invest more than you can afford to lose. Consider seeking professional financial advice before making any investment decisions.
Risk Warning
Trading stocks and options is a risky activity and can result in losses. You should only trade if you understand the risks involved and are comfortable with the potential for losses.
Risk Warning: Trading is Not for Everyone
It's essential to emphasize that trading stocks and options carries inherent risks. Market volatility, unpredictable events, and human error can lead to significant losses. Therefore, it's crucial to undertake thorough research, understand the underlying risks, and only invest funds that can be comfortably afforded to lose.
------------------------------------
Rating: STRONG BUY
Risk Disclaimer!
The article information and the data is for general information use only, not advice!
---------------------------------------------------------------------
Risk Warning Trading stocks and options is a risky activity and can result in losses. You should only trade if you understand the risks involved and are comfortable with the potential for losses. Risk Disclaimer! General Risk Warning: Trading on the Financial Markets, Stock Exchange and all its asset derivatives is highly speculative and may not be suitable for all investors. Only invest with money you can afford to lose and ensure that you fully understand the risks involved. It is important that you understand how Trading and Investing on the stock exchange works and that you consider whether you can afford the high risk of loss!

SNPS Potential Buy setupReasons for bullish bias:
- Price bounced from trendline
- Price has tested recent resistance turned support
Entry Level: 525.42
Stop Loss Level: 476.00
Take Profit Level 1: 574.84

SNPSSynopsys, Inc. is an American electronic design automation company headquartered in Sunnyvale, California, that focuses on silicon design and verification, silicon intellectual property and software security and quality. Synopsys supplies tools and services to the semiconductor design and manufacturing industry

Synopsys ready to flyI think Synopsys is ready to start a new bullish upside movement getting more streght crossing SMA100
Target will be around 600$ next months

Synopsys Pulls BackSynopsys has pulled back after hitting new highs, and trend followers may take notice.
The first pattern on today’s chart is the four-month consolidation pattern between May and early October. SNPS was mostly trapped below $465 during that time. But it broke out on October 6 and is now pulling back to that level. Has old resistance become new support?
Second is the series of higher weekly lows during the period of consolidation. Those could reflect lurking buyers willing to step in.
Next, a rising trendline has taken shape since mid-August. Prices have also pulled back near that potential support.
Finally, the provider of semiconductor-design software seems to be in a secular uptrend. It broke out to record highs in May, despite the broader market remaining below the peak of early 2022. This could make trend followers anticipate continued momentum, especially with barely two months left in the year.
TradeStation has, for decades, advanced the trading industry, providing access to stocks, options, futures and cryptocurrencies. See our Overview for more.
Important Information
TradeStation Securities, Inc., TradeStation Crypto, Inc., and TradeStation Technologies, Inc. are each wholly owned subsidiaries of TradeStation Group, Inc., all operating, and providing products and services, under the TradeStation brand and trademark. TradeStation Crypto, Inc. offers to self-directed investors and traders cryptocurrency brokerage services. It is neither licensed with the SEC or the CFTC nor is it a Member of NFA. When applying for, or purchasing, accounts, subscriptions, products, and services, it is important that you know which company you will be dealing with. Please click here for further important information explaining what this means.
This content is for informational and educational purposes only. This is not a recommendation regarding any investment or investment strategy. Any opinions expressed herein are those of the author and do not represent the views or opinions of TradeStation or any of its affiliates.
Investing involves risks. Past performance, whether actual or indicated by historical tests of strategies, is no guarantee of future performance or success. There is a possibility that you may sustain a loss equal to or greater than your entire investment regardless of which asset class you trade (equities, options, futures, or digital assets); therefore, you should not invest or risk money that you cannot afford to lose. Before trading any asset class, first read the relevant risk disclosure statements on the Important Documents page, found here: www.tradestation.com .

SNPS will break or bull trap? Last friday is a choppy one but seems like there's a chance for it to break above. Tonight market will definitely the last moment for bulls or bears. What's your bet?

RECTANGLEPrice appears to be in a horizontal trading channel.
This pattern is neutral until broken.
Short is around 1%.
No recommendation.
Synopsys, Inc. provides electronic design automation software products used to design and test integrated circuits. The company offers Digital and Custom IC Design solution that provides digital design implementation solutions; Verification solution that offers virtual prototyping, static and formal verification, simulation, emulation, field programmable gate array (FPGA)-based prototyping, and debug solutions; and FPGA design products that are programmed to perform specific functions. It also provides intellectual property (IP) solutions for USB, PCI Express, DDR, Ethernet, MIPI, HDMI, and Bluetooth low energy applications; logic libraries and embedded memories; processor cores, software, and application-specific instruction-set processor tools for embedded applications; security IP solutions; IP solutions for automotive market; and system-on-chip (SoC) infrastructure IP, datapath and building block IP, and verification IP products, as well as mathematical and floating-point components, and Arm AMBA interconnect fabric and peripherals. In addition, the company offers HAPS FPGA-based prototyping systems; virtual prototyping solutions; and Platform Architect solutions for SoC architecture analysis and optimization, as well as a series of tools used in the design of optical systems and photonic devices. Further, it provides security testing, managed services, programs and professional services, and training that enable its customers to detect and remediate security vulnerabilities, and defects in the software development lifecycle, as well as manufacturing solutions. The company serves electronics, financial services, automotive, medicine, energy, and industrial areas. It has a strategic partnership with Intel Corporation to develop EDA and IP solutions. Synopsys, Inc. was incorporated in 1986 and is headquartered in Mountain View, California.

Short SynopsisSynopsis looks topped out, RSI divergence as confluence.
Short targets are around 375 as TP 1 to 350 as TP 2.
To play it super safe, short to ~418.
Simple setup, good luck!

SNPS Synopsys Options Ahead of EarningsAnalyzing the options chain and the chart patterns of NU Holdings prior to the earnings report this week,
I would consider purchasing the 400usd strike price Puts with
an expiration date of 2023-9-15,
for a premium of approximately $6.40.
If these options prove to be profitable prior to the earnings release, I would sell at least half of them.
Looking forward to read your opinion about it.

$SNPS double insideNASDAQ:SNPS interesting double inside here.
I will be skipping this due to the multiple red volume bars to the left.
I am willing to be patient waiting for better setups.

SNPS Entry, Volume, Target, StopEntry: with price above 468.03
Volume: with volume greater than 2.69M
Target: 511 area
Stop: Depending on your risk tolerance; Based on an entry of 453.70, 232.84 gets you 3/1 Reward to Risk Ratio.
This swing trade idea is not trade advice and is strictly based on my ideas and technical analysis. No due diligence or fundamental analysis was performed while evaluating this trade idea. Do not take this trade based on my idea, do not follow anyone blindly, do your own analysis and due diligence. I am not a professional trader.

SNPS Entry, Volume, Target, StopEntry: when price clears 468.03
Volume: with daily volume greater than 2.7M
Target: 511 area
Stop: Depending on your risk tolerance; 453.70 gets you 3/1 Risk/Reward.
This swing trade idea is not trade advice and is strictly based on my ideas and technical analysis. No due diligence or fundamental analysis was performed while evaluating this trade idea. Do not take this trade based on my idea, do not follow anyone blindly, do your own analysis and due diligence. I am not a professional trader.

SNPS - Upward Move / Right Arm of WThis is the bullish move that completes the right side of the larger W pattern
The most recent W is slightly shaped differently with the middle of the W being higher than the left side
This could be a bullish sign plotting a higher high which supports the first argument
Price labels are the middle of both W's

SNPS - A Synopsis for SynopsysTechnical Indicators have begun to finally cool off for this one, but such a dramatic trip to the clouds often warrants a visit back to the tree tops before ascending into outer space... If the 2 month MACD crosses again and holds, then this stock has likely entered one of these 5 wave corrective structures outlined. There is always the potential for higher highs, but I would caution against any aggressive longs in this stock until the techs can reset much lower. Monthly MACD cross is still in effect. GLTA!

$SPNS with a Bearish outlook following its earnings #Stocks The PEAD projected a Bearish outlook for $SPNS after a Negative over reaction following its earnings release placing the stock in drift C with an expected accuracy of 75%.

SNPS US stock Buying SignalSNPS US stock Buying Signal with three TPs, and buying price on trendline support


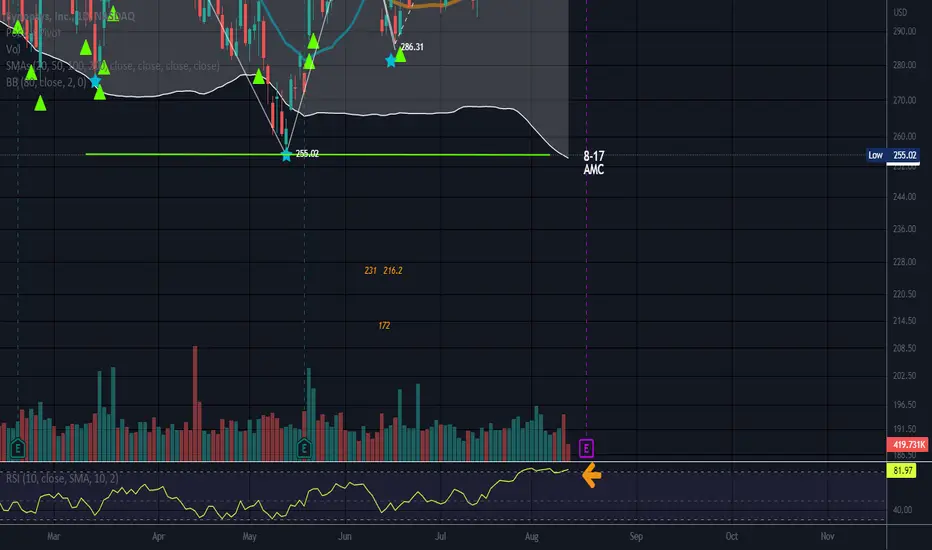
Inverse Head and Shoulders //OverboughtEarnings are 8-17 after market close. Long entry is not usually ideal at overbought levels but we are all different.
SNPS broke the neckline a while back. New ATH 381.70
I suppose the chips bill has energized the semiconductor stocks. On monthly this looks really steep.
This has been overbought for a while with RSI on 80 versus 70. Overbought and oversold conditions can linger for some time, but it does get my attention.
Typical RSI settings are 70 for overbought and 30 for oversold levels.
Price is over the bands set on an 80 DMA which is also an overbought signal.
Overbought is a term used when a security is believed to be trading at a level above its intrinsic or fair value. Overbought generally describes recent or short-term movement in the price of the security, and reflects an expectation that the market will correct the price in the near future.
This will most likely pull back a bit before earnings.
No recommendation
SNPS up
My idea to long Synopsis's, but the best thing that's been written about is how to write fiction, or not to write fiction at all, and not to write for children, not to write for the masses. If you are doing what you love or what you love to do, you can write anything, anywhere and with whom you want. We are the ones who decide what we are interested in and what we can't be interested in. Some choose to write fiction, some don't, that's all.

Can $SNPS continue to lead the tech sector?Notes:
* Very strong up trend on all time frames
* Amazing earnings track record
* Basing for the past ~7 months while the Tech sector and the general market were getting hammered
* Coming off of its 50 day line with higher than average volume
* Coming up on the right side of its base
* Offering a low risk entry
* Showing tonnes of strength and signs of accumulation
* Printed a pocket pivot indicating institutional buying
Technicals:
Sector: Technology - Software - Infrastructure
Relative Strength vs. Sector: 1.48
Relative Strength vs. SP500: 1.42
U/D Ratio: 1.61
Base Depth: 44.77%
Distance from breakout buy point: -14.32%
Volume 20.92% above its 15 day avg.
Trade Idea:
* You can enter now as it's just bouncing off of its 50 day line with higher than average volume
* If you're looking for a better entry you may be able to find one around the $317.73 area
* This stock usually has local tops when the price closes around 12.54% above its 50 EMA
* Consider selling into strength if the price closes 12.34% to 12.74% (or higher) above its 50 EMA
* The last closing price is 5.42% away from its 50 EMA

$SNPS with a Bullish outlook following its earnings #Stocks The PEAD projected a Bullish outlook for $SNPS after a Positive Under reaction following its earnings release placing the stock in drift A with an expected accuracy of 63.64%.

Price is Over Channel/Ws/Sharks, Cyphers & Fib LevelsPrice has broken the top trendline of the channel down.
Many of the stocks have the W pattern in the chart as of late. This one has moved a lot more and much faster than the others with this W that I have been watching.
Valley 2 is lower than valley 1, and the retrace/uptrace leg hit the .382, so when this turned up for the last leg of the W, I then know this could be Cypher or a Shark, and it is a bearish harmonic pattern even though the last leg of the W can be an excellent long.
The Cypher is labeled and measured in a different way than the Shark and is also less common. The Cypher is labeled XABCD and D is calculated using the XC leg or the entire structure and lands close to the .786 of XC. Price has passed the .786 of OX, or the first leg, on it's way up so that is a clue that this is a Shark. The uptrace or second leg of the Cypher should hit the .382 to the .618 range, not much more or much less. So there is a rule for leg 2 which is AB. There is not a rule for the Shark's 2nd leg as long as it does not pass O.
The Shark lands close to the .886 of OX but sometimes hits around the 1.113 of OX. The 1.113 and the .886 are marked. The prior bullish shark (peak 2 is higher than peak1) in this chart hit the 1.113, so it does happen.
If it were to break the right shoulder resistance level, then it is back to the drawing board. Price has touched the .886 on Monday.
The crooked W is called the bearish version of each of these patterns. The crooked M is known as the bullish version, but can feel mighty bearish on the last leg down, just like the bearish version can feel pretty bullish on that last leg up.
The bearish versions have the impulse wave to the downside. To measure crooked Ws, I put the fib table with the 0 at the bottom as I am looking for a level to the upside. For bullish structures or crooked Ms, the 0 goes on top as I am looking for price to pull back on the last leg.
There is also a head and shoulders pattern and SNPS is trying hard to break that right shoulder. Time will tell and unfortunately any pattern, support level, trendline or resistance level can fail.
The Auto-Fib Retracement tool on here is great for nailing a turning point (o:
No recommendation and watching for now. Neutral until price makes a definitive move.
Sorry for the messy chart but I wanted to leave the fib tables on the chart.
If I can't spot the sucker within 30 minutes of sitting down at a table, it could be me )o:
