Blackrock Inc (BLK) | Institutional Footprints Revealed📈 BlackRock (BLK) | Institutional-Grade Supercycle Analysis
Elliott Wave × Market Structure × SMC × Fibonacci × Macro Integration
This is a comprehensive high-timeframe structural map for BlackRock NYSE:BLK , integrating multiple institutional frameworks to define the current Supercycle position and its projected trajectory.
The objective is to identify where we are in the market cycle , where long-term capital will likely reposition , and where the next asymmetric opportunities lie .
1. Supercycle Positioning — Structural Context
BLK has completed a textbook extended Supercycle Wave III , reaching near the 2.618 Fibonacci expansion relative to Wave I .
The magnitude and duration of this wave strongly suggest that the market is now transitioning into Supercycle Wave IV , typically a multi-year corrective phase characterized by liquidity redistribution, volatility clustering, and structural rebalancing.
Wave IV historically aligns with:
Macro capital flow deceleration
AUM contractions during broad equity drawdowns
Repricing of risk premia across institutional portfolios
Rotation from cyclical equity exposure toward defensive allocations
This environment is already manifesting across major indices and B-Tier asset managers.
2. Structural Market Outlook — Wave IV Correction
Wave IV is unfolding through a complex corrective formation (likely W–X–Y) rather than a simple ABC.
This aligns with current market behavior: overlapping price structures, declining momentum, failed breakouts, and liquidity sweeps — all indicative of institutional distribution.
Key corrective targets (Fibonacci Alignment):
0.382 Retracement | $500-450
Structural demand + prior weekly inefficiency + rebalanced liquidity
0.5–0.618 Golden Pocket | $350–$300
High-probability reaccumulation zone used by discretionary and systematic funds
Confluence with multi-year unmitigated demand
These zones carry materially higher probability for macro accumulation and long-duration capital deployment.
3. Smart Money & Orderflow Alignment
The price action around the prior ATH displays:
A clean liquidity sweep above structural highs
Formation of a macro distribution range
Break of structure on the weekly timeframe
Unfilled fair value gaps to the downside, consistent with Wave IV corrective targets
Classic displacement patterns signaling institutional orderflow rotation
This behavior suggests the transition from expansion to correction has already begun, positioning the market in the early-to-mid phase of Wave IV.
4. Macro & Fundamental Confluence
From a macro-fundamental standpoint:
BLK’s earnings sensitivity to equity markets is significant
Periods of elevated volatility materially affect net flows and AUM stability
Regulatory and rate-cycle uncertainty persists
Secular growth drivers remain intact, supporting a strong Wave V recovery phase
The macro environment fully supports a medium-term corrective repricing before a long-term structural continuation.
5. Forward Projection — Supercycle Wave V
Upon completing the corrective leg, BLK enters the next structural expansion: Supercycle Wave V.
Probabilistic Wave V targets:
3.618 Fibonacci Expansion | $3,700–$4,000+
Supported by long-term earnings growth trajectory
Strong confluence with high-timeframe extensions and historical BLK trend behavior
This aligns with typical final-wave macro expansions that drive multi-year secular highs.
6. Executive Summary
Near–mid term (corrective):
Anticipating continuation of Wave IV into $500 → $300 liquidity zones
Expect volatility clusters, complex corrective behavior, and structural retests
Long term (expansion):
Initiation of Supercycle Wave V post-2027/2029 accumulation
Probable macro expansion to the $3.7k–$4k region
Aligns with both structural and fundamental models
This framework provides a clear roadmap for long-horizon investors, wave practitioners, and advanced SMC traders.
If You Found Value
We provide institutional-grade breakdowns combining macro structure, advanced Elliott Wave modeling, liquidity analysis, and high-timeframe confluence mapping.
For deeper insights, premium updates, or multi-asset coverage —
Follow and enable notifications for ongoing institutional-level analysis.
Share this chart if you believe traders deserve deeper, institutional-level insight.
Not financial advice. For educational purposes only. Do your own research.
#BLK #BlackRock #ElliottWave #SmartMoney #MarketStructure #Fibonacci #LongTermInvesting #Stocks #TradingView #WaveAnalysis #Macro #Liquidity #Investing #StockMarket #TechnicalAnalysis
Trade ideas

BLK: more downside potential Price has immediate downside potential if it fails to reclaim the local resistance at 1090. A breakdown below 1050 would increase the odds of continuation toward the next key support levels at 1018 and 985–965.
Alternatively, a sustained break above 1090 would shift probabilities in favor of a larger bounce toward the declining 50-day MA.
Chart:

BlackRock (BLK) – Wave 3 in Motion📢 BlackRock (BLK) – Wave 3 in Motion | Institutional Strength + Fibonacci 3.618 Target Ahead 💥
📅 Timeframe : Monthly (Long-term Outlook)
📍 Current Price: $1,130
🎯 Wave 3 Target: ~$3,710 (3.618 Fibonacci Extension)
🧭 Structure: Wave 3 of a larger 5-wave cycle in progress
🌀 Wave Theory Confluence
BlackRock is currently unfolding a strong impulsive structure as part of a long-term Elliott Wave cycle:
Wave 1: The early-stage rally from 2000 to 2007
Wave 2: A textbook 0.382 Fibonacci retracement during the 2008 financial crisis
Wave 3: The current wave, extended and projected to reach 3.618x the Wave 1 length (~$3,710) — a typical signature of a strong institutional-driven Wave 3 impulse ⚡
Wave 4 & 5: Projected after this major expansion, with intermediate corrections expected
This fractal symmetry suggests BLK is nowhere near a cycle top yet , with significant upside potential over the next several years 📈
📐 Fibonacci Levels & Projections
🔹 Wave 2 respected the 0.382 retracement , a classic spot for shallow corrections during strong trends
🔹 Wave 3 Extension Target sits at 3.618 — ~$3,710 — backed by both Fibonacci math and historical wave behavior
🔹 Mid-channel resistance may create short-term corrections before final push to the target
🧠 Smart Money Concepts (SMC)
✅ Reaccumulation Phases: Price consolidations in 2015–2016 and 2022–2023 reflect institutional reloading zones, not distribution
✅ BOS (Break of Structure): Recent break above 2021 ATH confirms new markup phase 🔥
✅ No major supply zones above, indicating price could expand freely until price discovery finds new resistance closer to the projected 3.618 extension
📊 Price Action Analysis
Clean higher highs and higher lows on the monthly chart
Large-bodied bullish candles show strong trend momentum
Minor corrections respecting prior resistance-turned-support zones = confirmation of demand ✅
Breakout from compression range suggests volatility expansion and strong directional bias
💼 Fundamental Tailwinds
BlackRock remains the world’s largest asset manager , positioned at the heart of global capital flows:
AUM over $9T 📦
Massive institutional & ETF exposure (iShares)
Strong penetration into passive investing & ESG funds
Beneficiary of rate cut cycles and equity bull markets
Strategic leadership in tokenized assets, AI-enhanced portfolio management , and climate investing
These macro and innovation-driven tailwinds align with the explosive potential of Wave 3 , fueled by both capital inflows and earnings expansion 🧮
🎯 Summary
BlackRock is in a textbook macro Wave 3 expansion , with all signs aligning:
✅ Elliott Wave Impulse
✅ Fibonacci Extension to 3.618
✅ Institutional Accumulation Confirmed
✅ Price Action Breakout
✅ Rock-solid Fundamentals
A correction (Wave 4) may develop later around or after $3,700 — but for now, the path of least resistance remains up . Long-term investors and swing traders should monitor retracements for potential add-on positions before price enters Wave 5 later in the decade.
⚠️ Disclaimer: This analysis is for educational purposes only and is not financial advice. Always do your own research and manage risk accordingly. 🛡️
#BlackRock #BLK #ElliottWave #SmartMoney #Fibonacci #TechnicalAnalysis #PriceAction #WaveTheory #InstitutionalTrading #SwingTrade #LongTerm #StockMarket #AssetManagement #Breakout #Wave3 #BullishOutlook #Fundamentals #TradingStrategy #MacroView

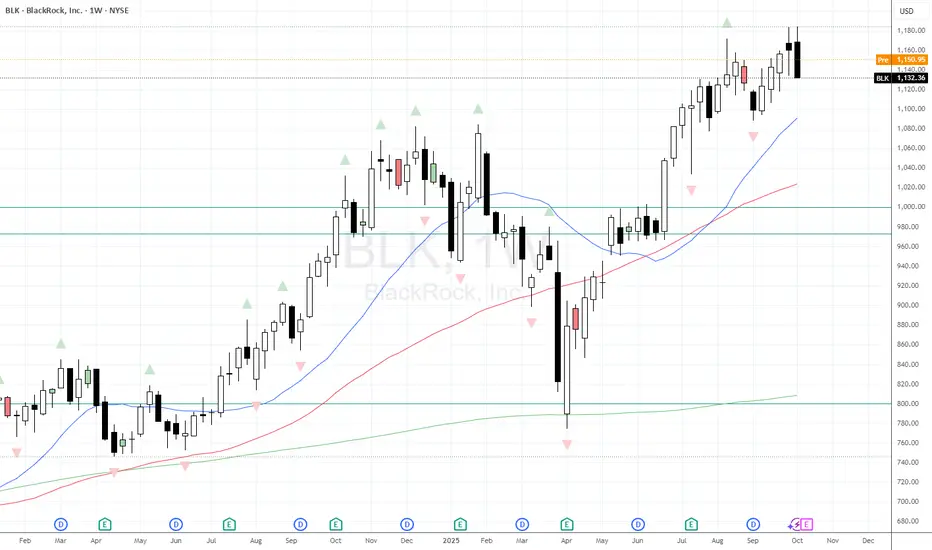
BlackRock (BLK) — holding the trend, targeting $1,200After a strong Q3 report — with Assets Under Management reaching a record $13.46 trillion — NYSE:BLK stock continues to hold within its ascending channel.
Technical setup:
Support: $1,145 – 1,150 (lower boundary of the channel)
Target: $1,200 (upper range / profit-taking zone)
MACD shows a bullish crossover, suggesting upward momentum
Price action is forming a corrective pattern with potential for continuation
If momentum holds, BLK could reach the $1,200 area in the coming weeks.
Fundamentally, the company remains one of the strongest players in the asset-management sector.

$BLK prints bearish Key Reversal Candle before earningsLike most finance companies NYSE:BLK has enjoyed a good few years (generally). What's interesting is that after last Fridays tariff tantrum we saw BLK print a Bearish Key Reversal on the Weekly Chart. these are rare so should always be respected. Does that mean BLK and all finance companies are going to roll-over and collapse? Unlikely. However we have BLK earning tomorrow before the open - if those numbers are poor then perhaps we see a further move lower? Watch and shoot!
BlackRock... Time to take advantage.Yeah that's right, it's time to buy shares of the bad guy's company. Do you really think a firm safeguarding $11 Trillion in assets is going anywhere? I wouldn't guess, which means any dip that comes along is more than likely a gift from the market. With that being said, NYSE:BLK has seen just under a 9% drop from its regional high. So I'd like to thank the market for making my job easy. However, I would like to identify that I am not calling a bottom, but rather being first to buy the dip so I don't regret it later. Let's get into the specifics...
As you can see, BlackRock (along with virtually all other financial institutions) had a fantastic quarterly report which also reflected shareholder optimism. Unfortunately, in the face of economic, foreign, and American financial turmoil. Thankfully, NYSE:BLK experienced a small tumble opening an opportunity for those of us that enjoy buying on discount.
So that's nice considering the uncertainty in the world, but what about strategy, do we just buy and pray or is there a target? Well here it is, split up into a "Buy Zone" (that being a gap fill play) and a "Super Buy Zone" (banking on a 200 EMA rebound). This strategy is illustrated below.
But wait, what about the Fed? That part is even easier, if we get some rate cuts moving forward, then we buy buy and buy again. However if we get rate raises, understand the the market is going to HATE it, so any financial institutions are going to get crushed. Keep your eyes on all important American Economic metrics here ( FRED:FEDFUNDS , FRED:M1V , FRED:RRPONTSYD ), for alternate financial institutions to look for dips see, ( NYSE:MS , NYSE:JPM , NYSE:C , NYSE:BRK.B , NYSE:BX , NYSE:GS , NYSE:ICE )

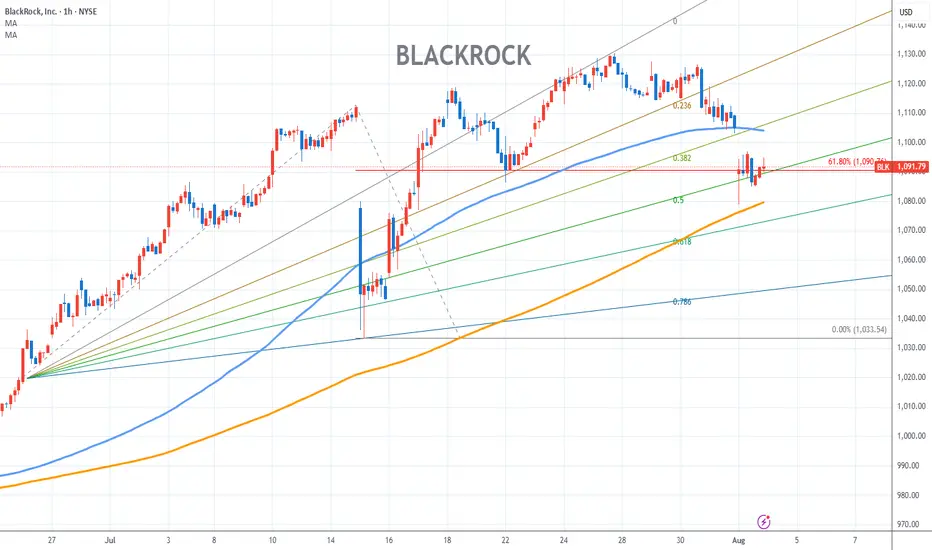
BlackRock Stock Chart Fibonacci Analysis 080125Trading Idea
1) Find a FIBO slingshot
2) Check FIBO 61.80% level
3) Entry Point > 1090/61.80%
Chart time frame:B
A) 15 min(1W-3M)
B) 1 hr(3M-6M)
C) 4 hr(6M-1year)
D) 1 day(1-3years)
Stock progress:C
A) Keep rising over 61.80% resistance
B) 61.80% resistance
C) 61.80% support
D) Hit the bottom
E) Hit the top
Stocks rise as they rise from support and fall from resistance. Our goal is to find a low support point and enter. It can be referred to as buying at the pullback point. The pullback point can be found with a Fibonacci extension of 61.80%. This is a step to find entry level. 1) Find a triangle (Fibonacci Speed Fan Line) that connects the high (resistance) and low (support) points of the stock in progress, where it is continuously expressed as a Slingshot, 2) and create a Fibonacci extension level for the first rising wave from the start point of slingshot pattern.
When the current price goes over 61.80% level , that can be a good entry point, especially if the SMA 100 and 200 curves are gathered together at 61.80%, it is a very good entry point.
As a great help, tradingview provides these Fibonacci speed fan lines and extension levels with ease. So if you use the Fibonacci fan line, the extension level, and the SMA 100/200 curve well, you can find an entry point for the stock market. At least you have to enter at this low point to avoid trading failure, and if you are skilled at entering this low point, with fibonacci6180 technique, your reading skill to chart will be greatly improved.
If you want to do day trading, please set the time frame to 5 minutes or 15 minutes, and you will see many of the low point of rising stocks.
If want to prefer long term range trading, you can set the time frame to 1 hr or 1 day.
BlackrockNice trade to go long here... I have seen tidier C&H setups... But this one looks good for the coming weeks. Worth keeping an eye on

BlackRock Beats EPS Estimates Despite Revenue Miss in Q1 2025 BlackRock Inc. (NYSE: NYSE:BLK ) reported adjusted earnings per share (EPS) of $11.30 for Q1 2025. This beat the Zacks Consensus Estimate of $10.25, marking a 10.24% surprise. In the same quarter last year, EPS was $9.81.
Revenue came in at $5.28 billion, missing the estimate of $5.33 billion by 1%. However, it rose from $4.73 billion a year earlier. The company has surpassed EPS estimates in all four of the last quarters and has topped consensus estimates twice in that span. In the previous quarter, BlackRock posted EPS of $11.93, beating the $11.27 estimate. That represented a surprise of 5.86%.
BlackRock operates in the Financial - Investment Management industry. The market now awaits management’s outlook for future earnings. This will shape short-term price direction. So far in 2025, BlackRock shares have dropped 16.2%. In comparison, the S&P 500 has declined 10.4%.
Technical Analysis
BlackRock rebounded from a strong support zone near $780. This level aligns with the long-term horizontal support level that has held for over 3 years now. The RSI sits at 41, indicating it is nearly oversold. However, a bullish reversal momentum is forming around the support zone.
If the price continues to rise, resistance and target lie at the $1,084.22 recent high. A break above $950 may trigger a run toward the $1,000–$1,084 range. If the price is rejected, it could revisit the $780 support or possibly the ascending trendline sitting below the horizontal support.

BLACKROCK Stock Chart Fibonacci Analysis 031725Trading Idea
1) Find a FIBO slingshot
2) Check FIBO 61.80% level
3) Entry Point > 900/61.80%
Chart time frame: C
A) 15 min(1W-3M)
B) 1 hr(3M-6M)
C) 4 hr(6M-1year)
D) 1 day(1-3years)
Stock progress: C
A) Keep rising over 61.80% resistance
B) 61.80% resistance
C) 61.80% support
D) Hit the bottom
E) Hit the top
Stocks rise as they rise from support and fall from resistance. Our goal is to find a low support point and enter. It can be referred to as buying at the pullback point. The pullback point can be found with a Fibonacci extension of 61.80%. This is a step to find entry level. 1) Find a triangle (Fibonacci Speed Fan Line) that connects the high (resistance) and low (support) points of the stock in progress, where it is continuously expressed as a Slingshot, 2) and create a Fibonacci extension level for the first rising wave from the start point of slingshot pattern.
When the current price goes over 61.80% level , that can be a good entry point, especially if the SMA 100 and 200 curves are gathered together at 61.80%, it is a very good entry point.
As a great help, tradingview provides these Fibonacci speed fan lines and extension levels with ease. So if you use the Fibonacci fan line, the extension level, and the SMA 100/200 curve well, you can find an entry point for the stock market. At least you have to enter at this low point to avoid trading failure, and if you are skilled at entering this low point, with fibonacci6180 technique, your reading skill to chart will be greatly improved.
If you want to do day trading, please set the time frame to 5 minutes or 15 minutes, and you will see many of the low point of rising stocks.
If want to prefer long term range trading, you can set the time frame to 1 hr or 1 day.

Shorting BlackRock Back to Stone Age. BLKEllioticians will have fun with this one, because this is a debatable chart wave-wise. Now what else is going on here technically? Volumes, volatility stochastics and momentum are downgoing. Bollinger Bands are no doubt showing something bearish undergoing as well. US/vWAP cross and resting above candles as well. This is a constellation that can't be not taken seriously.

BlackRock Is About to Explode – Here’s Why I’m Going Long!📊 BlackRock (BLK) – Bullish Setup Ahead of Earnings! 📊
BlackRock ( NYSE: BLK) is setting up for a potential bullish move as it approaches tomorrow's earnings report (before market open). After a healthy pullback, the stock has bounced off a long-term trendline, showing technical signs of a reversal. Here's why I'm taking this trade and what I'm watching going forward:
💼 Trade Setup:
🔹 Entry Price: $964 (current price)
🎯 Take Profit 1: $1,000
🎯 Take Profit 2: $1,050
🎯 Take Profit 3: $1,100
🛡️ Stop Loss: $915 (just below trendline support)
This setup offers a solid risk/reward ratio, with potential upside of up to 14% while keeping the downside risk limited to 5%. The levels are based on both technical resistance zones and previous highs that could act as targets.
📈 Why Am I Bullish on BlackRock?
1️⃣ Technical Reversal
BlackRock has bounced off its long-term trendline, which has been acting as support since mid-2023. The stock is now trading near daily RSI oversold levels, with the Stochastic oscillator crossing upward, both of which point to bullish momentum.
The price action suggests buyers are stepping in, especially ahead of the earnings report. A move above $970-$975 could confirm the reversal and push the price toward my first target of $1,000.
2️⃣ Earnings Catalyst
BlackRock is due to release its Q4 2024 earnings tomorrow before the market opens. Historically, the company has a strong track record of beating estimates. Positive surprises tend to trigger sharp price moves, as asset managers like BlackRock benefit from market recovery and ETF inflows.
Given the recent rally in global markets, there's a good chance BlackRock could report higher-than-expected fee income from its $9.4 trillion in assets under management (AUM).
3️⃣ ETF & Passive Investing Growth
BlackRock’s iShares brand dominates the ETF market, capturing billions in inflows every month. ETFs have been gaining popularity globally, and BlackRock is perfectly positioned to benefit from this trend.
With markets stabilizing and investors returning to risk assets, ETF providers like BlackRock are first in line to benefit.
4️⃣ Fundamentally Strong Company
BlackRock is not just about ETFs. It also generates recurring revenue from its Aladdin platform, a risk management system used by many of the world’s largest institutions. This tech-driven revenue diversifies BlackRock’s business model and makes it more resilient to market downturns.
The company is also shareholder-friendly, with a strong dividend track record and consistent buybacks that reduce the float and boost EPS.
💬 Are you trading BlackRock ahead of earnings? Share your thoughts below! 👇

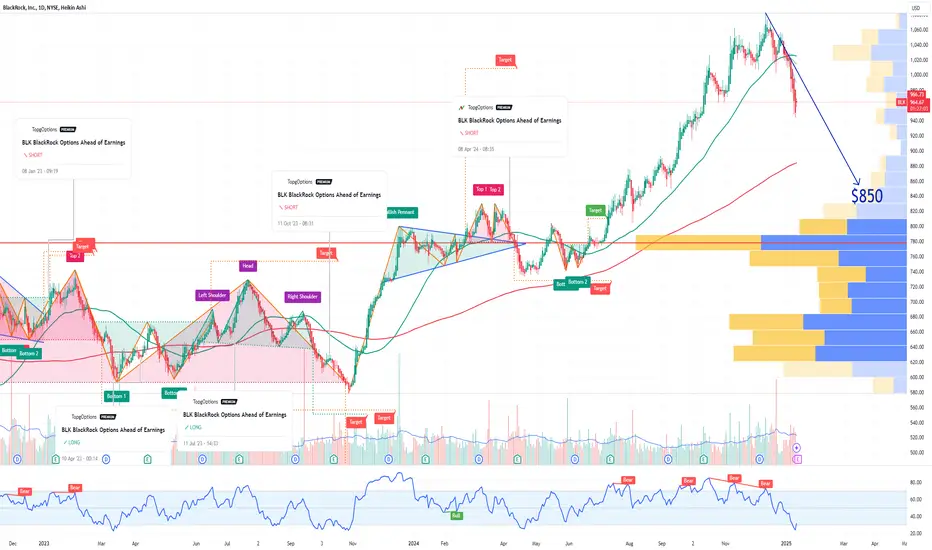
BLK BlackRock Options Ahead of EarningsIf you haven`t bought BLK before the breakout:
Now analyzing the options chain and the chart patterns of BLK BlackRock prior to the earnings report this week,
I would consider purchasing the 850usd strike price Puts with
an expiration date of 2025-3-21,
for a premium of approximately $6.50.
If these options prove to be profitable prior to the earnings release, I would sell at least half of them.
BlackRock ($BLK): Eyeing $914–$874 for ReversalOnce again, our analysis has proven accurate. Following our initial call, NYSE:BLK rallied by 15%, only to retrace by 12%, erasing nearly all gains from the past three months. This serves as a valuable reminder that protecting capital often outweighs chasing setups with lower conviction.
Currently, NYSE:BLK is nearing the level we’ve been monitoring, with tomorrow’s earnings report adding some short-term uncertainty and excitement. Despite this, we believe the correction isn’t yet complete. It’s too early to place an order or even set a limit. We will wait for the earnings release and the subsequent market reaction to reassess the situation.
Our key focus remains on the $914–$874 zone, where we anticipate a potential reversal and the completion of wave (iv).
Once wave (iv) concludes, we expect NYSE:BLK to aim for the previously highlighted targets in our October analysis: $1,057–$1,342. Based on the anticipated completion of wave (iv), the next target for the larger wave ((iii)) aligns with the $1,100–$1,243 range.

2025 Stock Watch 11Jan2025 - $BLKOne to watch for 2025. Expecting reversal and nice upside potential. In oversold territory and nearing long term support zone.
Note: This is not a recommendation or investment advice, just a stock to watch. Do your own research before investing.

What is an ETF? | The Modern Investor’s Secret WeaponWhy ETFs Are Like a Financial Swiss Army Knife ?
Warren Buffett famously stated that 90% of his wife’s inheritance would go into one simple investment: a low cost S&P 500 index fund, likely an ETF (Exchange Traded Fund). ETFs, which now manage over $13 trillion in assets worldwide, combine the benefits of diversification and simplicity by bundling various stocks, bonds, or other assets into a single investment product.
1. Understanding ETFs
ETFs allow you to invest in a collection of assets that often track specific indices, sectors, or asset classes. Key benefits include:
- Diversification: Gain broad exposure without picking individual stocks.
- Liquidity: Trade ETFs like stocks throughout the trading day.
- Transparency: Daily disclosure of holdings ensures clarity about your investments.
Passive investing with ETFs has surged in popularity over active strategies due to lower fees and higher transparency
2. The Impact of Fees
While ETFs are cost effective, they do charge fees (expense ratios).Even small differences in fees can compound significantly over time, reducing long term returns:
- A 0.05% fee might cost $6K over 20 years on a $100K investment growing at 10% annually.
- A 1.00% fee could cost $112K over the same period.
Thus, keeping costs low is critical, especially for long-term investors.
What qualifies as “low cost”?
- Under 0.10%: Very low, often for funds tracking major indices.
- 0.10%–0.25%: Still affordable, typically for niche or strategy-focused ETFs.
- Above 0.50%: High; these funds require careful evaluation to justify their costs.
3. Leading ETF Providers
Major ETF providers dominate the industry:
- BlackRock (iShares): $3.2 trillion AUM, 452 funds, 0.30% average fees.
- Vanguard: $3 trillion AUM, 86 funds, 0.09% average fees, known for reinvesting profits to lower costs.
- State Street (SPDR): $1.5 trillion AUM, 158 funds, 0.27% average fees, creator of the first US-listed ETF (SPY)
4. Top ETFs by Popularity
Some ETFs hold significant assets due to their simplicity, reliability, and low fees :
- S&P 500 funds (SPY, VOO, IVV): Track the largest US companies
- Total US Market (VTI): Covers small, mid, and large-cap US stocks
- Thematic Funds (VUG, VTV): Focus on growth or value stocks
- Nasdaq 100 (QQQ): Heavy on tech companies like Apple and Microsoft
- Bond ETFs (BND, AGG): Represent the US investment-grade bond market
These ETFs serve as essential building blocks for diversified portfolios
5. Concentration in US Markets
US indices like the S&P 500 and Nasdaq 100 are increasingly dominated by a handful of companies:
- The top 10 stocks make up 39% of SPY and 52% of QQQ.
- Companies like Apple, Microsoft, and Amazon account for 34% of the S&P 500.
While this concentration can amplify gains in bull markets, it also increases vulnerability during downturns.
6. Exploring Specialized ETFs
Beyond broad-market funds, ETFs can target specific regions, sectors, or investment strategies. Choosing the right ETF mix depends on your financial goals, time horizon, and risk tolerance. For simplicity, Warren Buffett recommends sticking to an S&P 500 index fund, while globally diversified options like VT are also available.
Final Takeaway
ETFs have revolutionized investing with their low costs, transparency, and accessibility. Whether you're a beginner or a seasoned investor, understanding what's inside the ETF and how it aligns with your strategy is key to building a successful portfolio.

BlackRock: Top Confirmed!Just shy of the lower edge of our Target Zone, BlackRock recently established its high at $1,082.45, completing the beige wave b. The Target Zone has since been deactivated. With this milestone reached, we now anticipate a prolonged decline as part of the beige wave c. This development aligns with the overarching correction of the blue wave (II), which began in November 2021 and is defined by a subordinate abc-structure. From the $1,082.45 high, we primarily expect a sustained price decline. However, this level now serves as a critical resistance. In the context of our 36% likely alternative scenario, we must allow for the possibility of a new wave alt.b high above this mark.

BlackRock, Inc. is about to benefit from the bitcoin rally.Though BlackRock is late to the bitcoin race, it's getting ready to be the goto place for institutional bitcoin adoption. This will open the company to a different crop of investors and we are about ready to see their stock price soar like bitcoin recently.
The recent CRYPTO:BTCUSD rally was due to some speculation on the approval of bitcoin ETF.
What do we think will happen to NYSE:BLK price if the ETF is approved?
Trade set up
Entry price: 605.82
Stop loss: 454.51
Target price: 913.97
If this idea was helpful, like, share and comment below.


$BLK monthly chart, Crab harmonic setup
Crab Harmonic Setup.
Currently 1,036.00
PRZ = 1,263.64
1.902 Special Situation Fib = 1,397.13
HOP / SLZ = 1,443.20
Other Key Resistance Levels:
BC min = 1,092.21
BC ideal = 1,191.12
BC max = 1,281.68
Once we achieve PRZ, will then evaluate for the retracement setup.

BLK H1 Long 52 weeks High BrokenBuy Entry @ 884.51
S/L @ 854.14
T/P @ 915.02
R.R.R. @ 1/1
Pure Price Action analysis based on Breakout of target level.
The 52 weeks High has been broken. Higher highs expected !

$BLK with a bullish outlook following its earnings #StocksThe PEAD projected a bullish outlook for NYSE:BLK after a positive under reaction following its earnings release placing the stock in drift A with an expected accuracy of 64.29%.

BLK 1K plusNYSE:BLK
Weekly BULLISH RECTANGLE since Dec '23. ETH and BTC ETFs, I BELIEVE, are making for up BULLISH price action. I declare it a BUY and HODL. PRICE TARGET of 983.
