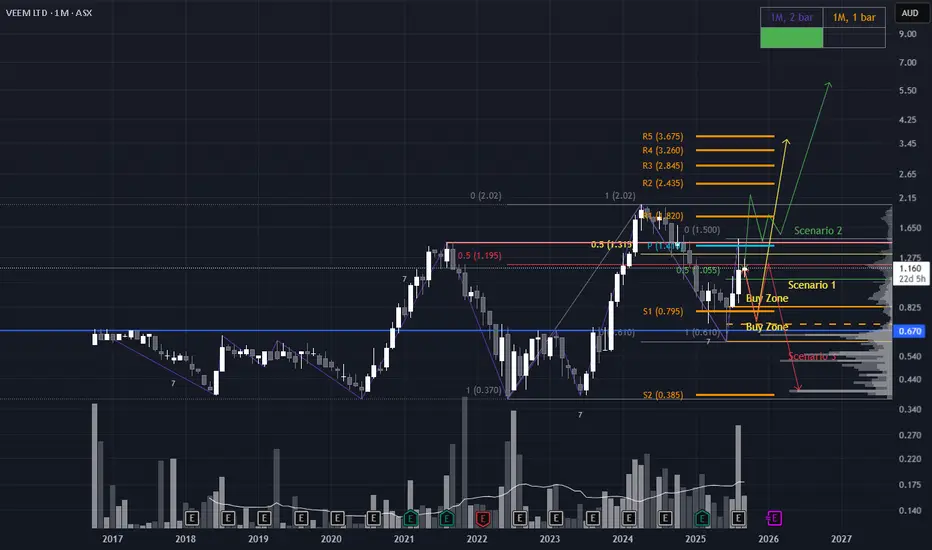
Three Paths for VEEM: Pullback, Breakout, or BreakdownScenario 1 (yellow line): Strategic Pullback to Value Zone
Price retraces to the ~$0.67 region, aligning with a Low Volume Node (LVN) and the Fair Value Gap from the June candle. A bullish reversal candle in this zone would signal a high-probability long setup, suggesting accumulation at a key struc
Next report date
—
Report period
—
EPS estimate
—
Revenue estimate
—
0.0124 EUR
1.69 M EUR
38.28 M EUR
72.84 M
About Veem Ltd.
Sector
Industry
CEO
Trevor Raman
Website
Headquarters
Canning Vale
Founded
1980
Identifiers
2
ISIN:AU000000VEE3
Veem Ltd. engages in the provision of stabilization systems and propulsion products and services to marine, defence, and mining industries. The company was founded by Voyka Miocevich and Elizabeth Elsie Miocevich in 1968 and is headquartered in Canning Vale, Australia.
Related stocks
An aggregate view of professional's ratings.
Neutral
SellBuy
Strong sellStrong buy
Strong sellSellNeutralBuyStrong buy
Neutral
SellBuy
Strong sellStrong buy
Strong sellSellNeutralBuyStrong buy
Neutral
SellBuy
Strong sellStrong buy
Strong sellSellNeutralBuyStrong buy
Displays a symbol's price movements over previous years to identify recurring trends.
Frequently Asked Questions
Depending on the exchange, the stock ticker may vary. For instance, on FWB exchange Veem Ltd. stocks are traded under the ticker VEV.
We've gathered analysts' opinions on Veem Ltd. future price: according to them, VEV price has a max estimate of 1.13 EUR and a min estimate of 0.62 EUR. Watch VEV chart and read a more detailed Veem Ltd. stock forecast: see what analysts think of Veem Ltd. and suggest that you do with its stocks.
Yes, you can track Veem Ltd. financials in yearly and quarterly reports right on TradingView.
Veem Ltd. is going to release the next earnings report on Feb 19, 2026. Keep track of upcoming events with our Earnings Calendar.
VEV earnings for the last half-year are 0.01 EUR per share, whereas the estimation was 0.01 EUR, resulting in a 0.71% surprise. The estimated earnings for the next half-year are −0.01 EUR per share. See more details about Veem Ltd. earnings.
Veem Ltd. revenue for the last half-year amounts to 19.59 M EUR, despite the estimated figure of 21.49 M EUR. In the next half-year revenue is expected to reach 14.09 M EUR.
VEV net income for the last half-year is 1.12 M EUR, while the previous report showed 608.49 K EUR of net income which accounts for 83.52% change. Track more Veem Ltd. financial stats to get the full picture.
EBITDA measures a company's operating performance, its growth signifies an improvement in the efficiency of a company. Veem Ltd. EBITDA is 5.00 M EUR, and current EBITDA margin is 13.16%. See more stats in Veem Ltd. financial statements.
Like other stocks, VEV shares are traded on stock exchanges, e.g. Nasdaq, Nyse, Euronext, and the easiest way to buy them is through an online stock broker. To do this, you need to open an account and follow a broker's procedures, then start trading. You can trade Veem Ltd. stock right from TradingView charts — choose your broker and connect to your account.