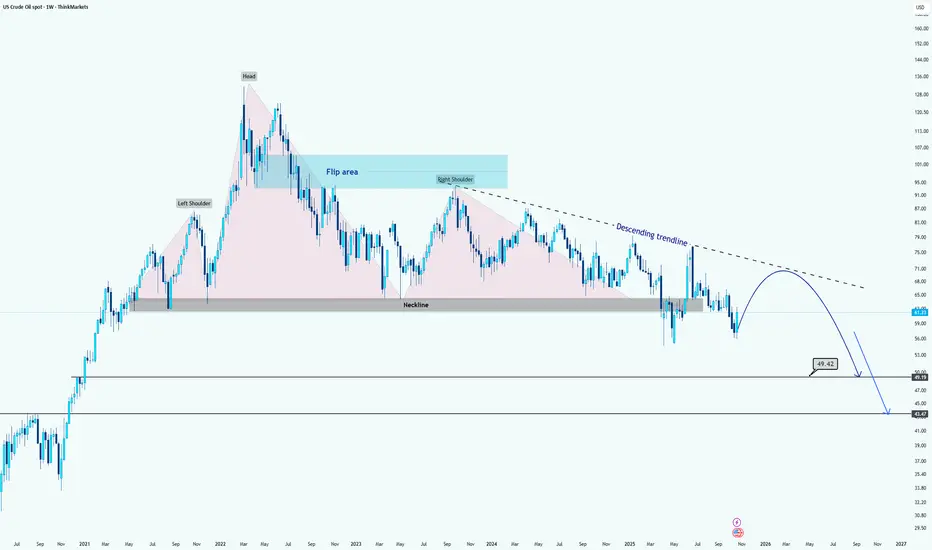
WTI Crude Oil Forms Major Head and Shoulders BreakdownHi guys.
WTI has formed a massive Head and Shoulders pattern on the weekly timeframe, signaling a potential long-term bearish reversal structure.
After the right shoulder completed, price decisively broke below the neckline around the $67–$70 range, confirming the pattern breakdown. This neckline
About U.S. DOLLAR / WTI CRUDE OIL
Crude Oil is a naturally occurring liquid fossil fuel resulting from plants and animals buried underground and exposed to extreme heat and pressure. Crude oil is one of the most demanded commodities and prices have significantly increased in recent times. Two major benchmarks for pricing crude oil are the United States' WTI (West Texas Intermediate) and United Kingdom's Brent. The differences between WTI and Brent include not only price but oil type as well, with WTI producing crude oil with a different density and sulfur content. The demand for crude oil is dependent on global economic conditions as well as market speculation. Crude oil prices are commonly measured in USD. Although there have been discussions of replacing the USD with another trade currency for crude oil, no definitive actions have been taken.
USOIL Symmetrical triangle buying from key support📊 USOIL Update (1H Timeframe)
🟢 Symmetrical Triangle Breakout Setup!
Price holding strong at the key support zone – $60.000 ✅
🎯 Technical Targets:
1️⃣ $60.800
2️⃣ $61.800
3️⃣ $62.400
🧭 Plan:
Looking for buying opportunities from the support zone as long as $60.000 holds.
⚠️ Risk Management is Ke

Oil: Key Fibonacci Zone to watch forPrice has been in a clear downtrend, with sellers firmly in control, driving a series of lower lows and lower highs. However, after a strong bearish leg, momentum began to slow, candles started showing long wicks and smaller bodies, signaling that selling pressure might be fading.
If price continue
Can WTI’s 8% Rally Hold After Trump-Putin Summit Collapse?WTI just staged its biggest two-day rally since June, as hopes for a Trump-Putin summit were dashed, leading to new US sanctions on Russian oil exports.
Here’s what’s fuelling the move and what traders should watch next:
- US sanctions on Russia’s top oil producers after failed Budapest summit tr

USOIL: Bears Are Winning! Short!
My dear friends,
Today we will analyse USOIL together☺️
The in-trend continuation seems likely as the current long-term trend appears to be strong, and price is holding below a key level of 61.394 So a bearish continuation seems plausible, targeting the next low. We should enter on confirmati

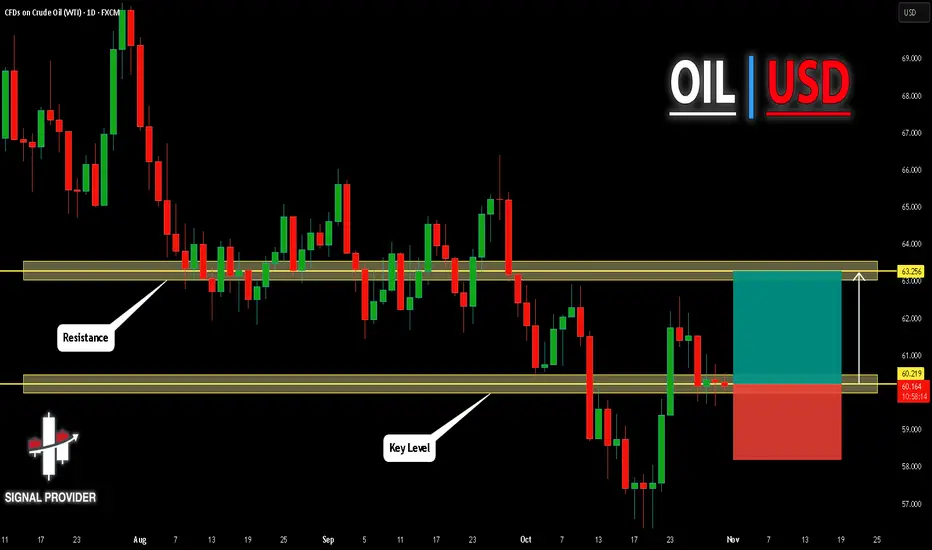
USOIL Is Very Bullish! Long!
Please, check our technical outlook for USOIL.
Time Frame: 1D
Current Trend: Bullish
Sentiment: Oversold (based on 7-period RSI)
Forecast: Bullish
The market is approaching a significant support area 60.219.
The underlined horizontal cluster clearly indicates a highly probable bullish movement
WTI OIL Strong long-term rebound incoming.Over a month ago (September 17, see chart below), we gave a strong Sell Signal on WTI Oil (USOIL) as the price was again rejected on its 1W MA50 (blue trend-line) and was headed towards the inner Higher Lows trend-line, easily hitting our $59.50 Target in the process:
Yet again we consult the m

Will oil continue to rise? Yes, definitely.
Hi my Dears
Following recent trade policies, it seems that there is still room for oil to grow and we should see oil prices rise. The first price target we can hope for is $63.
Do you think it could happen?

WTI OIL 1D MA50 rejection. Sell Signal.Last time (October 14, see chart below) we took a look on WTI Oil (USOIL), we gave a Buy Signal right at the bottom of its 3-month Channel Down, which eventually hit our 62.00 Target:
This time we have a Sell Signal as the price and the Channel's Bullish Leg got rejected on its 1D MA50 (blue tr

Today, both bulls and bears have opportunities in crude oil.
Yesterday's public announcement of buying short positions above 62 was a correct bearish strategy. Crude oil fell as expected, as everyone has witnessed! The daily closing price formed a hammer pattern with a long lower shadow. This pattern signals that crude oil has stabilized. Support below is ex

See all ideas
Displays a symbol's price movements over previous years to identify recurring trends.