DELLDELL has pulled back sharply from the September peak & remains below its 50d MA, so trend pressure remains downward heading into earnings since price rejected off it cleanly earlier in November
This makes earnings more binary since support is more vulnerable on a miss
RSI ~38 is still washed out, so there is room for a reversal & stochastics turning up which suggests early bullish divergence
Price is under the short-term trend, but momentum is turning up
This combination tends to produce violent post-earnings moves because a trend-down with momentum curling means the catalyst decides the direction
Upside potential is cleaner into earnings because price sits far beneath the 50d MA which means a good print results in an immediate reclaim attempt of $138-$144 since shorts covering into a 50d MA breakout creates a slingshot move; however, the downside is no longer cushioned by a long-term MA so a bad print may result in a fast flush through $124 & sellers will push for $115-$118
The implied earnings setup shows a bullish break could open the path back to $150-$155 making the 50d MA support again, but a miss, shows bearish continuation where price loses $124 with a straight shot to $115-$118
NASDAQ:QQQ AMEX:SPY
Trade ideas

Dell Has Lost Some 25% in Recent Weeks. What Its Chart Says HereDell Technologies NYSE:DELL has fallen some 25% in just three weeks after hitting an 18-month high earlier this month, and the stock has trailed the S&P 500 SP:SPX in almost every timeframe from one month to five years. Let's check out the computer-hardware and enterprise-solutions firm's chart and fundamentals ahead of this week's Q3 earnings release.
Dell's Fundamental Analysis
DELL is set to report fiscal Q3 results after the bell on Tuesday, with the Street looking for $2.48 in adjusted earnings per share on $27.3 billion of revenue.
That would represent a 15.3% gain from the $2.15 in adjusted EPS that DELL recorded in the year-ago period, as well as about a 12% increase from the $24.4 billion in sales it saw in fiscal Q3 2025.
However, analysts are split on how DELL is doing. Seven of the 22 sell-side analysts that I can find that cover the stock have revised their earnings estimates higher since the quarter began, while 10 have cut their estimates and five have made no changes.
But perhaps most significantly, Morgan Stanley analyst Erik Woodring -- who last week downgraded Dell and a plethora of other tech stocks in a single day -- gave DELL a double downgrade.
Woodring, who's rated at five stars out of a possible five by TipRanks, cut the stock from "Overweight" (a buy-equivalent rating) all the way down to "Underweight" (a sell-equivalent).
Making matters worse, the analyst reduced his DELL target price to $110 from a previous $144 at a time when the stock had closed the session before at $133.76. (TipRanks listed analysts' consensus 12-month Dell price target at $167.14 at last check vs. the $127.36 the stock was trading at Monday afternoon.)
DELL fell 8.4% on Woodring's double downgrade, but soon made contact with its 200-day Simple Moving Average (or "SMA") and showed signs of bottoming out. Still, that's certainty not what the stock needed going into earnings.
Dell's Technical Analysis
Now let's look at DELL's chart going back some five months and running through Wednesday afternoon:
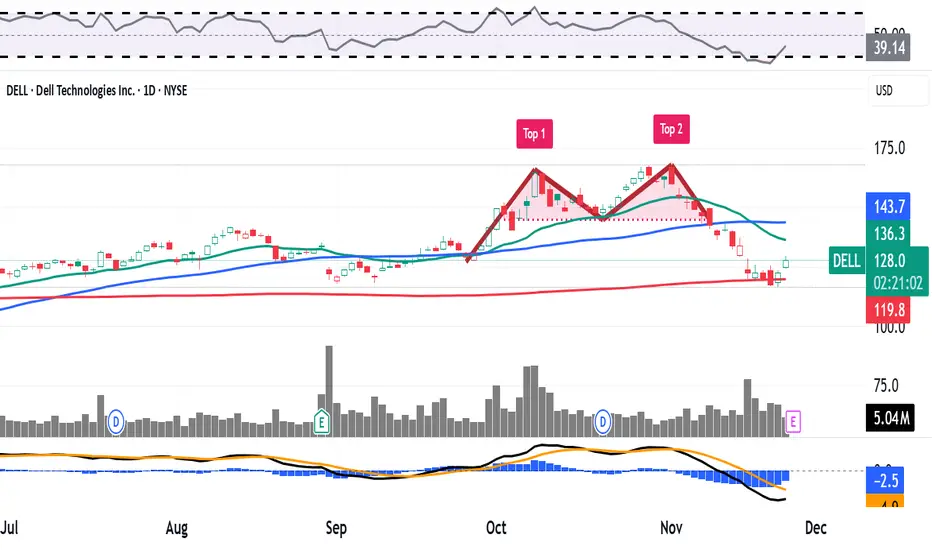
Readers will see that DELL rallied in mid- to late September, then sold off, then rallied again and then sold off again.
By November, the stock had developed a double-top pattern of bearish reversal, as denoted by the two red boxes and pink-shaded triangles at the chart's right.
This pattern had a $145 downside pivot that was triggered recently, then DELL gave up its 50-day SMA (marked with a blue line) shortly thereafter.
Next, the stock suffered what some call a "mini death cross or "swing trader's death cross."
That's when a stock's 21-day Exponential Moving Average (or "EMA," marked with a green line above) crosses below the 50-day SMA. Technicians generally see this as a negative for a stock's price.
But DELL finally appeared to find support at its 200-day SMA (the red line above) after some air had been let out of the balloon.
Is there any more help to be found here for the stock? Let's look at DELL's secondary technical indicators for some signs.
On one hand, the stock's Relative Strength Index (marked with a gray line at the chart's top) has sunk into technically oversold territory.
However, DELL's daily Moving Average Convergence Divergence indicator (or "MACD," marked with black and gold lines and blue bars at the chart's bottom) is about as bearish looking as daily MACDs can get.
For instance, the histogram of the stock's 9-day EMA (marked with blue bars) is deep into negative territory. Meanwhile, the 12-day EMA (the black line) is running below the 26-day EMA (the gold line), and both of those lines are below zero. These are all bearish technical signals.
An Options Option
Options traders who are somewhat bullish on DELL but not confident enough to lay out a ton of money for an equity stake might choose to employ a so-called "ratio-call spread" based on the stock's technical support indicators.
This involves buying a call at the same time as selling multiple higher calls with the same expiration date.
Here's an example:
-- Long one DELL $120 call with a Nov. 28 expiration (i.e., after this week's earnings come out). This cost about $6.40 at recent prices.
-- Short two Nov. 28 DELL $144 calls for roughly $0.80 apiece.
Net Debit: $4.80.
This trader would break even if DELL rises to $124.80 at expiration vs. Thursday's close at $119.38.
If the stock rises above $120, then the person would wind up long 100 DELL shares at a $124.80 net cost basis.
Conversely, should the shares be at or below $120 at expiration, the trader would be out the $4.80 net debit.
The options trader's theoretical maximum gain would be $19.20 and would occur at $144, the strike price of the two short calls.
If the stock is above $144 at expiration, the trader would end up short 100 shares of DELL with the potential for unlimited loss.
Meanwhile, any increase in the stock price beyond $144 would start to eat into the gain made on the long call until this trade reaches its upper breakeven level at $163.20.
(Moomoo Technologies Inc. Markets Commentator Stephen "Sarge" Guilfoyle had no position in DELL at the time of writing this column.)
This article discusses technical analysis, other approaches, including fundamental analysis, may offer very different views. The examples provided are for illustrative purposes only and are not intended to be reflective of the results you can expect to achieve. Specific security charts used are for illustrative purposes only and are not a recommendation, offer to sell, or a solicitation of an offer to buy any security. Past investment performance does not indicate or guarantee future success. Returns will vary, and all investments carry risks, including loss of principal. This content is also not a research report and is not intended to serve as the basis for any investment decision. The information contained in this article does not purport to be a complete description of the securities, markets, or developments referred to in this material. Moomoo and its affiliates make no representation or warranty as to the article's adequacy, completeness, accuracy or timeliness for any particular purpose of the above content. Furthermore, there is no guarantee that any statements, estimates, price targets, opinions or forecasts provided herein will prove to be correct.
Options trading is risky and not appropriate for everyone. Read the Options Disclosure Document ( j.moomoo.com ) before trading. Options are complex and you may quickly lose the entire investment. Supporting docs for any claims will be furnished upon request.
Options trading subject to eligibility requirements. Strategies available will depend on options level approved.
Maximum potential loss and profit for options are calculated based on the single leg or an entire multi-leg trade remaining intact until expiration with no option contracts being exercised or assigned. These figures do not account for a portion of a multi-leg strategy being changed or removed or the trader assuming a short or long position in the underlying stock at or before expiration. Therefore, it is possible to lose more than the theoretical max loss of a strategy.
The Analyst Ratings feature comes from TipRanks, an independent third party. The accuracy, completeness, or reliability cannot be guaranteed and should not be relied upon as a primary basis for any investment decision. The target prices are intended for informational purposes only, not recommendations, and are also not guarantees of future results.
Moomoo is a financial information and trading app offered by Moomoo Technologies Inc. In the U.S., investment products and services on Moomoo are offered by Moomoo Financial Inc., Member FINRA/SIPC.
TradingView is an independent third party not affiliated with Moomoo Financial Inc., Moomoo Technologies Inc., or its affiliates. Moomoo Financial Inc. and its affiliates do not endorse, represent or warrant the completeness and accuracy of the data and information available on the TradingView platform and are not responsible for any services provided by the third-party platform.
DELL Earnings Alert: High-Conviction Bearish Signal DELL QuantSignals V3 Earnings | 2025-11-25
DELL Earnings Signal | 2025-11-25
• Direction: BUY PUTS | Confidence: 60%
• Entry Plan: Pre-Earnings Close | Expiry: 2025-11-28
• Strike Focus: $117.00
• Entry Range: $1.34
• Target 1: $2.62
• Stop Loss: $0.79
• Implied Move: $9.88 (7.8%)
• 24h Move: +2.20%
• Flow Intel: Bearish (High P/C Ratio) | PCR 1.90
• ⚠️ MODERATE RISK WARNING: Consider reducing position size due to moderate confidence level.
• Earnings Date: 2025-11-25 | Estimate: N/A
⚖️ Compliance: Educational earnings analysis for QS Premium members only. Not financial advice.
🎯 TRADE RECOMMENDATION
Direction: BUY PUTS
Confidence: 60%
Conviction Level: MEDIUM
🧠 ANALYSIS SUMMARY
Katy AI Signal: Neutral-to-bearish. Forecast shows early volatility followed by a sustained decline.
• Current Price: $126.22
• Predicted Price (Nov-26 15:35): $111.57 (-11.61%)
• Resistance: $127.38
• Trend: Downward after earnings
Technical Analysis:
• Strong bearish confirmation across timeframes (100%)
• RSI oversold at 23.9 (bounce risk)
• Predicted drop toward $111–113 zone
• Volume 0.6× average → weak participation
News Sentiment:
• Mixed expectations
• AI pipeline hype vs. margin concerns
• Forecast revisions indicate uncertainty
• Historical beat rate 50%, average surprise -1.2% → downside risk
Options Flow:
• Strong bearish pressure (PCR 1.90)
• High volume at $109 puts → institutional bearish stance
• Implied move 7.8% → high volatility expected
Risk Level: MEDIUM–HIGH
Use strict stop loss due to RSI and earnings volatility.
💰 TRADE SETUP
Expiry: 2025-11-28 (3 days)
Strike: $117.00 (-0.195 Delta)
Entry Price: $1.31–$1.38
Target 1: $2.62
Target 2: $3.93
Stop Loss: $0.79
Position Size: 3% of portfolio
⚡ COMPETITIVE EDGE
Why This Trade Works:
• Katy AI prediction aligns with bearish flow + bearish technicals
• 3-day expiry captures post-earnings move efficiently
• Balanced delta improves risk/reward
• Stop loss protects against earnings surprise or RSI bounce

DELL - Another Earnings SetupHello Everyone, Followers,
DELL is another one that will release their financial reports on Tuesday next week. Here is my view on it.
DELL is coming into earnings with a sharp pullback after the big run earlier this quarter. Price dropped from the 160s and is now trying to stabilize around 122.51, right on a key Fib level and right above the long-term yellow trendline support.
DELL currently trades below all three major MAs (20-50-100) and just above of 200 MA— earnings will be the catalyst to determine whether this breakdown reverses or accelerates.
🔹 Trend Structure
DELL has broken below the ascending trendline for the first time since summer, but price is sitting on the lower trendline of the longer-term channel. This is a natural reaction area.
A close back above 124.40 - 124.50 may indicate a potential reversal.
🔹 Scenarios
Bullish Case
Reclaim 124.4
Push toward 132 → 141.50 - 142.00
Strong earnings could target 158.00, but only if volume confirms
Bearish Case
Reject at 124.4
Fall back toward 110 → 103
Break of 103 opens a deeper correction
🔹 Outlook
DELL is in a technical decision zone ahead of earnings. Buyers want to defend the long-term trendline, but momentum remains weak and the MA structure is stacked against the bulls.
A reclaim above the 124–130 range would be the first real sign of stabilization.
🔹 My Plan
Above 124.4: I’ll watch for a bounce toward 130–141.4.
Below 120: I’ll stay patient and wait for the 103 area to consider new entries.
No chasing here — earnings will decide the direction.
If you enjoy and like clean, simple analysis — follow me for more.
This is just my thinking and it is not invesment suggestion , please do not make any decision with my anaylsis.
Have a lovelly Sunday to all and Good Start a Week.
#DELL #SPX500 #Earnings

Dell Remains Bullish, Expands AI Reach With New D&H PartnershipDell Technologies continues to strengthen its position in the accelerating enterprise AI cycle, supported by new distribution partnerships and major AI-infrastructure contracts. Last week, D&H Canada announced a new agreement authorizing it to distribute Dell’s endpoint devices and PowerEdge servers, while also giving partners access to Dell’s professional services for digital-transformation projects.
While this partnership broadens Dell’s channel reach, the deeper story remains the company’s rapidly expanding AI-server footprint. Demand for Dell’s AI-optimized infrastructure continues to outpace supply, contributing to a growing order backlog and reinforcing the company’s emerging leadership in enterprise AI deployment. The standout catalyst is Dell’s newly secured US$5.8 billion AI server contract, a deal that directly addresses near-term revenue visibility and signals sustained institutional demand.
However, to be a Dell shareholder today, investors must accept that AI growth needs to compensate for ongoing softness in traditional server and PC segments. The rapid expansion in AI-infrastructure orders can temporarily compress margins, especially as Dell scales production and delivery. Still, these pressures are likely cyclical rather than structural, with higher-value enterprise solutions expected to re-expand margins over time.
Technical Outlook
The chart shows Dell pulling back sharply from the $168 zone and retesting a long-term ascending trendline — a key technical support level that has historically triggered strong rebounds. Price is now hovering around the $134 region, aligning with the dotted trendline that has supported multi-quarter rallies.
If this level holds, DELL could set up a bullish reversal back toward the $168 recent high and beyond, with a broader extension to $180+ over the next cycle. A breakdown, however, exposes the stock to lower support zones.
Overall, Dell remains one of the most leveraged large-cap plays on enterprise AI infrastructure, with strong catalysts and constructive long-term technicals.

DELL: Unveiling Over 20% Undervaluation DELL: Unveiling Over 20% Undervaluation – SWOT and Intrinsic Value Deep Dive
Introduction
📊 As of October 27, 2025, Dell Technologies Inc. (DELL), a leading provider of IT hardware, software, and services with a focus on servers and storage, is capitalizing on AI-driven growth within the technology sector amid broader market volatility. Macroeconomic factors, including surging demand for AI infrastructure and data center expansions, have propelled positive investor sentiment despite recent fluctuations. Sector dynamics feature exploding AI server sales and enterprise upgrades, with public data indicating quarterly revenue growth of 19% year-over-year, positioning DELL for sustained momentum in a growth-oriented environment. This overview draws from verifiable metrics without endorsing any trading action.
SWOT Analysis
Strengths 💹
DELL boasts a strong brand reputation valued at billions and competency in mergers and acquisitions, enabling market expansion. Robust financials include adjusted EBITDA of $10.14B trailing twelve months and a profit margin of 4.77%, supported by diversified offerings in AI servers and storage solutions. Global presence and product customization further enhance operational efficiency, with operating cash flow at $7.48B.
Weaknesses ⚠️
Overdependence on the technology sector exposes DELL to cyclical downturns, while limited diversification and fewer physical points of sale hinder retail reach. High leverage is evident with total debt at $29.52B and negative book value per share of -$4.10, potentially amplifying risks in interest rate environments. Recent earnings surprises show variability, with a -8.38% miss in one quarter.
Opportunities 🚀
DELL is well-positioned for AI-driven growth, with analysts forecasting AI server sales surges and compounded annual revenue growth of 7-9% over the next four years. Undervalued metrics like a forward P/E of 13.11 and PEG ratio of 0.83 offer appeal, alongside opportunities in IoT and data storage demand. Projected revenue of $107.82B for fiscal 2026, up 12.82%, is driven by data center refresh cycles and enterprise AI adoption.
Threats 🛑
Intense competition in AI and cloud markets from rivals like HP and IBM could erode market share, while regulatory changes and supply chain disruptions pose risks. Geopolitical tensions and economic slowdowns may impact global operations, with beta of 1.13 indicating higher volatility relative to the market.
Intrinsic Value Calculation
💰 In value investing, estimating intrinsic value assesses mispricings, incorporating a margin of safety for factors like negative book value. Given DELL's negative book value (-$4.10 per share) due to leverage and buybacks, we adjust the book weight to 0 and emphasize earnings: Intrinsic Value = (Book Value per Share × Weight) + (Forward EPS × Growth Multiplier), where the multiplier (e.g., 20) reflects conservative capitalization for tech growth based on sector averages and 17% projected growth.
Using recent data: Book Value per Share = -$4.10, Forward EPS = $9.55. Assume a 17% growth rate from analyst estimates, supporting the multiplier for sustainability.
Calculation:
- Book component: -$4.10 × 0 = $0
- Earnings component: $9.55 × 20 = $191
- Intrinsic Value ≈ $0 + $191 = $191
Compared to the current price of approximately $158, DELL appears undervalued by over 20%, providing a substantial margin of safety (e.g., 30-50% discount recommended to offset risks like high debt). 📉 Debt flags are significant with $29.52B total debt, but strong earnings momentum (17.97% growth for 2027) supports long-term sustainability if managed. Annotate intrinsic value lines in green on the chart, with current price in red for visual comparison.
Entry Strategy Insights
🔍 Institutional investors often identify bottom-extreme zones, such as oversold conditions near historical supports, for unleveraged, long-term positions. A dollar-cost averaging framework allows gradual scaling during dips, using non-repainting price action signals to confirm reversals without bias. For DELL, monitor zones around 50-day moving averages amid AI growth trends, prioritizing fundamentals like revenue momentum over short-term noise.
Risk Management
⚠️ Position sizing at 1-5% of portfolio capital limits drawdowns. Diversify across tech and hardware sectors to reduce exposure to AI-specific risks, with long-term holds aligned to projected growth in server demand. Track leverage metrics in quarterly filings, establishing exit criteria for deteriorating macros or competition intensifying.
Conclusion
This analysis underscores DELL's strengths in AI infrastructure and financial growth, countered by leverage concerns, with opportunities in emerging tech trends. The intrinsic value calculation indicates notable upside for value investors, but always verify independently using latest filings and consult professionals.
This is educational content only; not financial advice. Always conduct your own due diligence.
DELL - Inverted H&S An example of an inverted H&S pattern on the daily timeframe for DELL
As we are approaching the end of the right shoulder (a bullish phase), I expect price to continue up
I expect this scenario over resistance at the green line that price is currently testing.

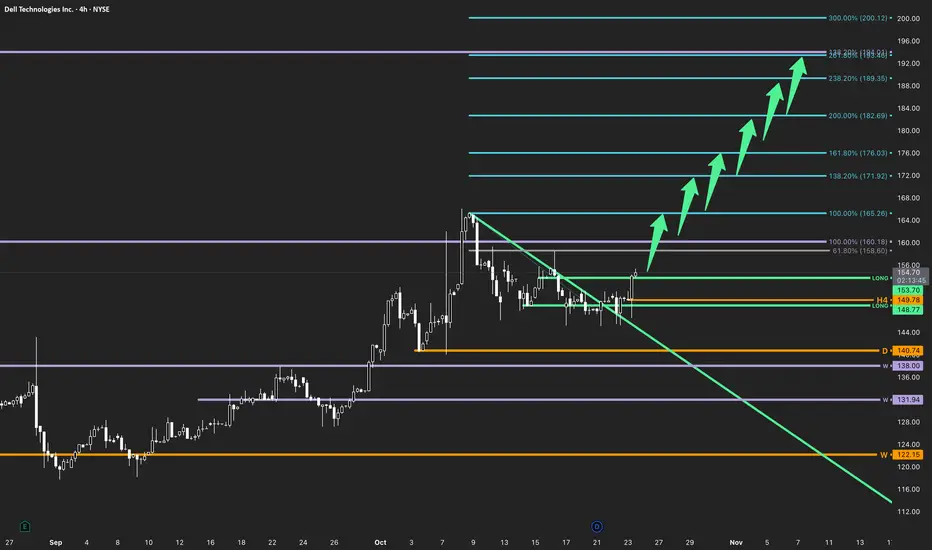
DELL | Multi-Timeframe Expansion SetupThe Market Flow | Oct 23, 2025
Technical Overview
Weekly: Structure remains bullish, with price holding above the active pivot at 138.00 . Weekly Fibonacci 138.2% extension aligns with the medium-term upside path toward 192.84 .
Daily: The daily countertrend originating from the recent weekly high has been broken, confirming early structural reversal within a corrective phase. Momentum is shifting back into alignment with the higher timeframe trend.
H4: Countertrend break above descending structure and trigger zone at 153.70 establishes the start of a new expansion phase. Clean Fibonacci projection targets stand at 165.26 , 171.92 , 176.03 , 182.69 , 189.35 , and 193.46 .
Trade Structure & Levels
• Bias: Long above 140.74 (active Daily pivot)
• Trigger = 153.70 (H4 breakout)
• Primary Invalidation = 149.78 (H4 pivot)
• Secondary Invalidation = 140.74 (Daily pivot)
• Path → 165.26 → 171.92 → 176.03 → 182.69 → 189.35 → 193.46
• Phase: Countertrend Break → Early Expansion
Risk & Event Context
• Next earnings report due early December.
• Broader tech sector resilience may support momentum continuation into Q4.
• Watch volatility around 160.00–165.00 where overlapping Fibonacci zones may cause short-term pauses.
Conclusion
All active timeframes confirm bullish alignment, with a confirmed countertrend break on H4 signaling early expansion. Maintaining above the daily pivot at 140.74 sustains the long bias toward higher Fibonacci extensions.
Disclaimer
This analysis is for informational purposes only and does not constitute investment advice, an offer, or a recommendation. Market conditions and price behavior may change without notice. Past performance is not indicative of future results. Always conduct your own research or consult a licensed financial advisor before making investment decisions.
DELL - The Long Climb=======
Volume
=======
- slight increase
==========
Price Action
==========
- Latest downtrend line broken and supported pullback way above line
- Rounded bottom
- Change of trend observed
=========
Oscillators
=========
- Ichimoku
>>> price above cloud
>>> green kumo
>>> base + conv + lagging above clouds
- MACD bullish
- DMI bullish
- StochRSI, bullish
=========
Conclusion
=========
- short to long term swing
- price may reverse at current level, to enter spot or wait for pullback.

DELL | New All Time Highs Incoming | LONGDell Technologies, Inc. is a technology company, providing customers with a broad and innovative solution portfolio to help customers modernize their information technology (IT) infrastructure, address workforce transformation, and offer critical solutions that keep people and organizations connected. It operates through the following segments: Infrastructure Solutions Group (ISG) and Client Solutions Group (CSG). The ISG segment includes servers, networking, and storage, as well as services and third-party software and peripherals that are closely tied to the sale of ISG hardware. The CSG segment includes designs for commercial and consumer customers of desktops, thin client products, and notebooks. The company was founded by Michael Saul Dell in 1984 and is headquartered in Round Rock, TX.

Dell Stock Idea – Bullish Outlook With Layered Entries💰 Dell Technologies INC: The Great Stock Market Heist Plan (Swing/Day Trade) 💰
🎯 Asset: Dell Technologies INC (DELL)🎭 Vibe: Bullish Bandits on the Move! The Simple Moving Average (SMA) is flashing green, confirming a buy trend, and the big institutional players are piling in. Time to join the heist with the market's heavy hitters! 🚀
📜 The Heist Plan: Bullish Breakout with a Thief’s Flair
🔍 Why DELL?The SMA is screaming "BUY," and institutional buyers are sneaking in like pros. We’re tailing the big players with a slick Thief Layering Strategy to maximize our loot. Here’s how we execute this caper:
Entry: 🕵️♂️ Thief Layering StrategyDeploy multiple buy limit orders to stack the deck in your favor:
🎯 $120.00
🎯 $122.00
🎯 $124.00
🎯 $126.00
Pro Tip: Add more layers based on your risk appetite and market conditions. Be the sneakiest thief in the game! 😎
Stop Loss (SL): 🚨 $118.00Set this SL after the breakout at the mentioned price levels to protect your stash. Dear Ladies & Gentlemen (Thief OGs), adjust your SL based on your strategy and risk tolerance. This isn’t a one-size-fits-all heist—own your escape plan! 🏃♂️
Targets: 🤑 Police Barricade Ahead!Watch out for strong resistance and overbought zones where traps lurk. Escape with your profits at:
Primary Target: $134.00
Secondary Target: $142.00Note: Dear Thief OGs, these are suggested targets. Grab your loot when it feels right—your heist, your rules! 💸
⚠️ Thief’s Code of Honor
Dear Ladies & Gentlemen (Thief OGs), I’m not here to dictate your SL or TP. This is your heist—make your moves and take your profits at your own risk. Stay sharp, stay safe, and don’t get caught! 😜
🔗 Related Pairs to Watch
To make this heist even smoother, keep an eye on these correlated assets (all in USD):
HP Inc. ( NYSE:HPQ ): Moves in tandem with DELL as a tech hardware peer. If HPQ is pumping, it’s a good sign for DELL’s bullish run.
NVIDIA ( NASDAQ:NVDA ): Tech giant with strong correlation to DELL due to AI and data center trends.
NVDA’s strength could fuel DELL’s breakout.
S&P 500 Index ( AMEX:SPY ): DELL often rides the broader market wave. If SPY is bullish, it’s a tailwind for our heist.
Key Correlation Insight: DELL’s performance is tied to tech sector momentum and institutional buying in AI/data center stocks. Watch NVDA and HPQ for confirmation of DELL’s bullish trend, and keep SPY on your radar for market sentiment.
🛠️ Why This Setup Works
✅ Technical Confirmation: The SMA signals a clear bullish trend, giving us the green light.
✅ Institutional Backup: Big players are entering, so we’re riding their coattails.
✅ Layered Entries: Multiple limit orders reduce risk and increase flexibility.
✅ Defined Escape Plan: Clear SL and TP levels keep us ahead of the market’s “police.”
📝 Disclaimer
This is just a fun vibe and not financial advice! Trading is risky, and you should always do your own research and consult with a professional before making any moves. Stay sharp, Thief OGs! 😎
✨ If you find value in my analysis, a 👍 and 🚀 boost is much appreciated — it helps me share more setups with the community!
#TradingView #DELL #StockMarket #SwingTrading #DayTrading #Bullish #ThiefStrategy #TechnicalAnalysis
Downtrend in Dell?Dell Technologies has lagged the market for months, and some traders may see further downside in the maker of computer hardware.
The first pattern on today’s chart is the bearish gap on August 29 following quarterly results. While earnings and revenue beat estimates, investors focused on weaker margins amid higher costs and intense competition for AI servers.
Second is the August 21 closing price of $127.83, where DELL stalled last week. Has old support become new resistance?
Third, MACD is falling and the 8-day exponential moving average (EMA) is below the 21-day EMA. Those signals may reflect short-term bearishness.
Next, the stock is back under its 50-day simple moving average and has remained below a bearish gap from November. Those points may reflect weakness in the intermediate and long term.
TradeStation has, for decades, advanced the trading industry, providing access to stocks, options and futures. If you're born to trade, we could be for you. See our Overview for more.
Past performance, whether actual or indicated by historical tests of strategies, is no guarantee of future performance or success. There is a possibility that you may sustain a loss equal to or greater than your entire investment regardless of which asset class you trade (equities, options or futures); therefore, you should not invest or risk money that you cannot afford to lose. Online trading is not suitable for all investors. View the document titled Characteristics and Risks of Standardized Options at www.TradeStation.com . Before trading any asset class, customers must read the relevant risk disclosure statements on www.TradeStation.com . System access and trade placement and execution may be delayed or fail due to market volatility and volume, quote delays, system and software errors, Internet traffic, outages and other factors.
Securities and futures trading is offered to self-directed customers by TradeStation Securities, Inc., a broker-dealer registered with the Securities and Exchange Commission and a futures commission merchant licensed with the Commodity Futures Trading Commission). TradeStation Securities is a member of the Financial Industry Regulatory Authority, the National Futures Association, and a number of exchanges.
TradeStation Securities, Inc. and TradeStation Technologies, Inc. are each wholly owned subsidiaries of TradeStation Group, Inc., both operating, and providing products and services, under the TradeStation brand and trademark. When applying for, or purchasing, accounts, subscriptions, products and services, it is important that you know which company you will be dealing with. Visit www.TradeStation.com for further important information explaining what this means.

DELL - LONG Swing Entry PlanNYSE:DELL - LONG Swing Entry Plan
E1: $ 119.00 – $ 116.00
E2: $ 109.00 – $ 110.00
AD: $ 98.00 – $ 97.00
___________________________
TP 1 - $ 127.00 - 8%
___________________________
Entry 1
→ Open initial position targeting +8% from entry level.
Entry 2
→ If price dips further, average down with a second equal-sized entry.
→ New target becomes +8% from the average of Entry 1 and Entry 2.
Average Down
→ If reached, enter with double the initial size to lower the overall cost basis.
→ Profit target remains +8% from the new average across all three entries.
Risk Management:
Stop Loss:
Risk is capped at 12% below the average entry price (calculated across all executed positions including the Edit Zone).
________________________________
Position Sizing Approach:
Entry 1: 1x
Entry 2: 2x
Entry 3: 2x (E1+E2)
Average Down Zone: 2x (E1+E2+E3)
→ Total exposure: 4x
→ Weighted average determines final TP and SL calculations.
______________________________________
Legal Disclaimer
The information provided in this content is intended for educational and informational purposes only and does not constitute financial, investment, or legal advice or recommendations of any kind. The provider of this content assumes no legal or financial responsibility for any investment decisions made based on this information. Users are strongly advised to conduct their own due diligence and consult with licensed financial advisors before making any financial or investment decisions.
Sharia Compliance Disclaimer: The provider makes no guarantees that the stocks or financial instruments mentioned herein comply with Islamic (Sharia) principles. It is the user’s responsibility to verify Sharia compliance, and consultation with a qualified Sharia advisor is strongly recommended before making any investment decisions

DELL eyes on $116.10: Golden Genesis fib will determine TrendDELL has been a sleepy stock with mixed earnings.
Now testing a proven Golden Genesis at $116.01
Look for a Break-and-Retest to start an Uptrend.
.
See "Related Publications" for other plots ---------------------->>>>>>>
This one in particular is caught the BOTTOM exaclty:
===================================================
.

Dell, bullish, ascending triangleNYSE:DELL looks ready to go
4 weeks of tight price action with higher lows
AI infra has been hot and dell is a key player
nuff said

DELL : Bullish after correctionwithin a 1 or so I expect a Pull back correction (1-2 weeks) than a continuation of Dells bullish momentum , May be an opportunity to add to you position. There no telling exactly how far down a larger scale wave -2 correction may go , ( Best case 105/ Worst case 85 ), . Need to wait and analyze the wave structure as it corrects.

DELL confirms bull flag breakoutDell has been in this bull flag for the past year; it finally broke out and is now eyeing new all-time highs. I'm waiting to see if Dell comes down to test the top of the channel as support, if so that would be a great entry opportunity.

DELL: Bullish Channel Breakout Targeting Prior HighsOverview:
Dell Technologies ( NYSE:DELL ) has exhibited significant price action over the past year. After a strong uptrend culminating in a multi-month high around the Target 145 zone in late 2024, the stock underwent a substantial correction. However, since its April lows, NYSE:DELL has initiated a robust recovery within a well-defined ascending channel, demonstrating clear bullish momentum.
Key Price Action & Patterns:
Prior Uptrend & All-Time High Test (August - December 2024): The initial phase of the chart shows NYSE:DELL in a strong ascending channel, culminating in a peak within the Target 145 zone. This zone represents a significant historical resistance level, being the prior peak before the subsequent decline.
Corrective Phase & Bearish Channel (December 2024 - April): Following the rejection at the 145 zone, NYSE:DELL entered a steep downtrend, breaking below key support levels and declining into April.
Bullish Reversal & Ascending Channel (April - Present): From its April lows, NYSE:DELL has embarked on a powerful recovery, forming a clear ascending channel. This pattern is characterized by a series of higher highs and higher lows, indicating sustained buying pressure.
Critical Levels & Current Status:
105 (Lower Teal Zone): This level has acted as a crucial support point within the current ascending channel, marking a significant higher low in the ongoing recovery phase. It represents a strong demand zone.
115 (White Line): This horizontal line served as an intermediate resistance level in late May/early June before being decisively breached. It now technically functions as immediate support, offering a potential retest level on any pullback within the current uptrend.
125 (Current Teal Zone): This is a highly significant pivot zone. It previously acted as major support in late 2024 before the breakdown and later as resistance during the early stages of the recovery. The recent price action shows a decisive breakout above this 125-resistance zone, signifying strong bullish conviction.
Target 145 (Upper Teal Zone): As the prior multi-month high, this zone remains the primary overhead resistance and potential upside target following the breakout from the 125 level. The dotted line projection illustrates a common post-breakout scenario, where price might retest the breakout level (125, now as support) before potentially moving towards the 145 targets.
Technical Outlook:
The recent breakout above the 125 resistance is a strong technical development, confirming the strength of the current uptrend within the ascending channel. This move suggests that buyers are in control and are aiming for higher price levels. The immediate focus shifts to the validation of the 125 level as new support, followed by a potential advance towards the Target 145 zone. Continued price action within the ascending channel and above 115 would reinforce the bullish bias.
Disclaimer:
The information provided in this chart is for educational and informational purposes only and should not be considered as investment advice. Trading and investing involve substantial risk and are not suitable for every investor. You should carefully consider your financial situation and consult with a financial advisor before making any investment decisions. The creator of this chart does not guarantee any specific outcome or profit and is not responsible for any losses incurred as a result of using this information. Past performance is not indicative of future results. Use this information at your own risk. This chart has been created for my own improvement in Trading and Investment Analysis. Please do your own analysis before any investments.

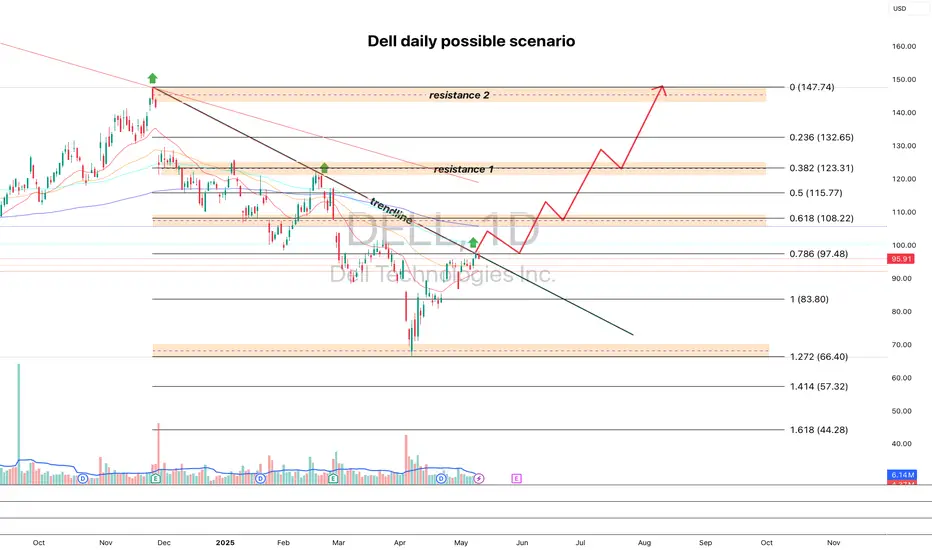
DELL looks good for pump dailyI'm watching DELL for a breakout of the trendline and a cross above the 100 MA — targeting a move toward 108.22, followed by a retest of the breakout and further upside targets at 123.31 and 147.74.
Fundamentally, the company looks strong, and the next earnings report is expected on May 29.
If you like the analysis, hit that rocket 🚀
What could be the target for DELL?DELL can easily go up +25% in the next 2 months and 50% in the next 6 months.

Dell on WatchLong or short position could be setting up.
I see two potential patterns forming.
1. Long: Inverse Head and Shoulders (orange)
2. Short: Diamond top (purple)
Price also bounced off Daily 20 EMA

Dell- Upside momentum is backNYSE:DELL . Despite weaker earning expectations, Dell managed to stay afloat and consolidate into a potential bullish flag. We think that there is still short-term upside expectation as the doji candle managed to stay above the 9-period conversion line. Furthermore, based on the Elliott wave theory, the stock is likely to end its ABC corrective three wave structure as momentum is back to the upside and stock has broken above the intermediate downtrend line of wave B to wave C.
Meanwhile, MACD is showing long-term positive momentum, along with mid-term stochastic.
Target wise we expect Dell to reach 140.00 region to fill the bearish gap. Any correction we will be looking at 100.00 psychological support to stage a rebound.
