VNOM LongLong term uptrend - Energy play
Holding 2014 high price of $36.
Double bottom at this level.
Confirmation low is consolidating.
Sellers unable to push price below it for now.
Dragon pattern, breakout of the spine.
Fib level targets
TP1 - 0.618
TP2 - 0.786
TP3 - 1.272
Exit if stop is reached.
Trade ideas

Viper Energy, Inc.
Uptrend: The chart shows a clear uptrend from May to July 2024, followed by a pullback in August. Recently, the price seems to have bounced back and is now moving upwards again.
Current Resistance: The price is approaching the resistance zone around $47-$48, which coincides with previous highs.
Support Levels: Major support appears near $42 and $44 levels, based on recent lows.
The chart displays Bollinger Bands. Currently, the price is testing the upper Bollinger Band, indicating potential resistance and possible overbought conditions in the short term.
The middle band (20-period moving average) may act as a support during pullbacks, currently around the $44-$45 region.
The recent spike in volume signals increased buying interest, often a positive sign when the price is moving upwards. This suggests that buyers are stepping in as the price breaks out from the recent consolidation.
There is a large bullish candlestick in the latest session, suggesting strong buying interest.
Bullish: The overall outlook appears bullish based on the moving averages, volume, and price action. The next key hurdle is the resistance around $47-$48. If the price breaks through this level with continued volume support, it could signal further upside.
Potential Pullback: If the price cannot break through resistance, a pullback to the middle Bollinger Band (~$44) is possible, offering a potential buying opportunity.

VNOM testing key resistanceViper Energy (VNOM) presently testing key resistance, able to absorb weekly buying pressures.
From here, (VNOM) is susceptible to falling back to recent support, eliciting losses of 10% over the following 1 - 2 months, and potentially losses of 20 - 30% over the following 3 - 5 months.
Inversely, a weekly settlement above elicited resistance would signal bullish continuation through Q1 where gains of 20% would be expected over the following 3 - 5 months.

$VNOM - 10% DividendThis guy has a 10% Dividend with expected sales growth over the next 5 years! Dividends paid quarterly. On my permanent watch list for the fundamental watch looking for some possible dips to take advantage of the dividends,

BREAKING DIVERGENCEBullish momentum has build up during today's session, confirming the positive divergence over fibonacci level, now longs should have a 1.6 R/R

VNOM bearish or breakoutVNOM is at the resistance zone and forms a bearish pin bar. Could retest the nearest support upon breaking low.

Viper Energy Announces Increased Authorization of Common Unit ReVNOM: Viper Energy Partners LP
2021-11-15 16:01:00
Viper Energy Partners LP, a Subsidiary of Diamondback Energy, Inc., Announces Increased Authorization of Common Unit Repurchase Program

Viper Energy Partners (VNOM) - HODLING LONG & STRONGViper Energy Partners (VNOM) - Long this hydrocarbon producer starting Spring 2021 on anticipated inflationary pressures driving hydrocarbon energy such as oil and natural gas higher, along with legacy hydrocarbon ("fossil fuel") exploration & production companies higher. Now riding the global energy "crisis"" wave much higher yet still. Ultimate price target on the underlying oil and natural gas as well as the shares of oil and natural gas production companies remains as of yet unknown given emergent global energy situation continuing to unfold!
See description (below) for further details...


potential breakout/ watch $15Viper Energy Partners LP engages in the acquisition of oil and natural gas properties. It owns, acquires, and exploits oil and natural gas properties in North America.
Please note: I'm just sharing my view. its not a recommendation for buying or selling.

VNOM BIDEN ClampOil Looking Good again under Biden Admin Regulations to drive price up. keep thing a bit tapered down. good for overall energy sector for now.. until.. he unleashes Iran back onto the market sending price back down..
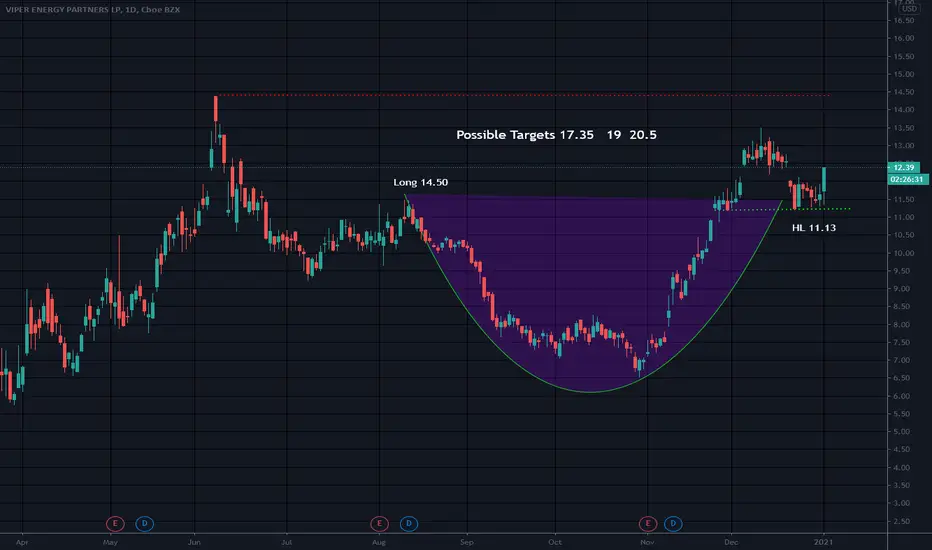
well hoping he has more on his to do list then cozying up with our Enemy. maybe oil reaches 60. looking for pullback to MA then a move to hopefully break to 14.50.

Cup and HandlePattern valid over long entry level..
Mid cup is 10.45 Handle low is 11.13 Cup low is 6.52 Cup depth is 7.86
Not a recommendation.
Cup and HandleBroke out of C&H pattern..over long entry level..Intra-year C&H pattern
Mid cup is 9.00 and there is support there as well as the handle low (HL)
Not a recommendation

Viper Energy Partners LP, a Subsidiary of Diamondback Energy, InVNOM: Viper Energy Partners LP
2020-11-09 16:01:00
Viper Energy Partners LP, a Subsidiary of Diamondback Energy, Inc., Announces Authorization of a Common Unit Repurchase Program

BB BREAKOUTHedge Funds love this one Great Volume Today .BB BREAK on Daily Talk of earnings surprise.room up to EMA at 10.70. im buying calls tomorrow...

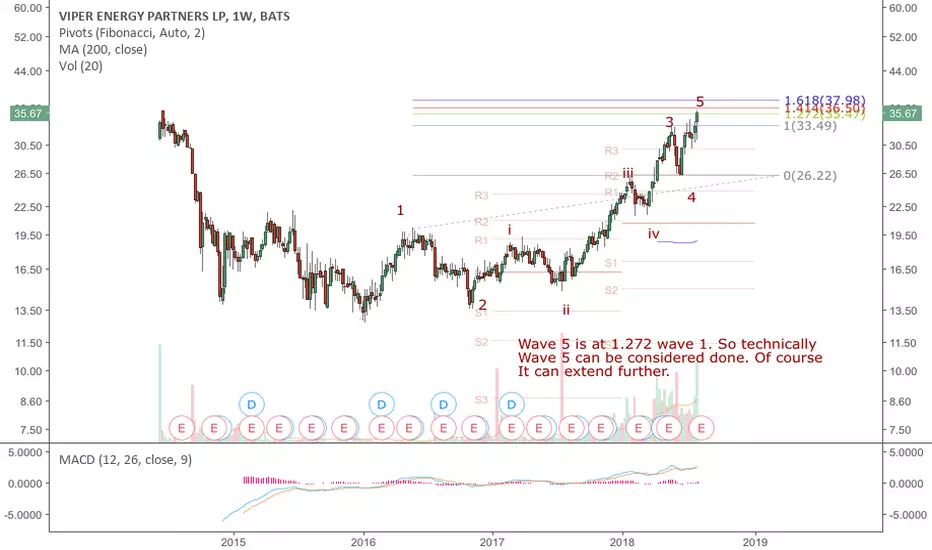
VNOM Projection AnalysisNASDAQ:VNOM "Viper Energy Partners LP owns, acquires, and exploits oil and natural gas properties in North America. As of December 31, 2019, it had mineral interests in 24,304 net royalty acres in the Permian Basin and Eagle Ford Shale with estimated proved oil and natural gas reserves of 88,946 thousand barrels of crude oil equivalent. Viper Energy Partners GP LLC operates as the general partner of the company. The company was founded in 2013 and is based in Midland, Texas. Viper Energy Partners LP is a subsidiary of Diamondback Energy, Inc."
PEG: 0.46, Quick Ratio: 5.4, Next Year Earnings are expected to increase 80%+. Dividend 20%+, However, not sustainable as Payout is over 200%! Risk/Reward is Great, if one can stand a 27% risk vs 50%+ reward. Bullish


Easy Buy down here with a stop on VNOMRetesting range lows as oil get's hammered...worth a watch down here as this has been a strong name over the last few years.
