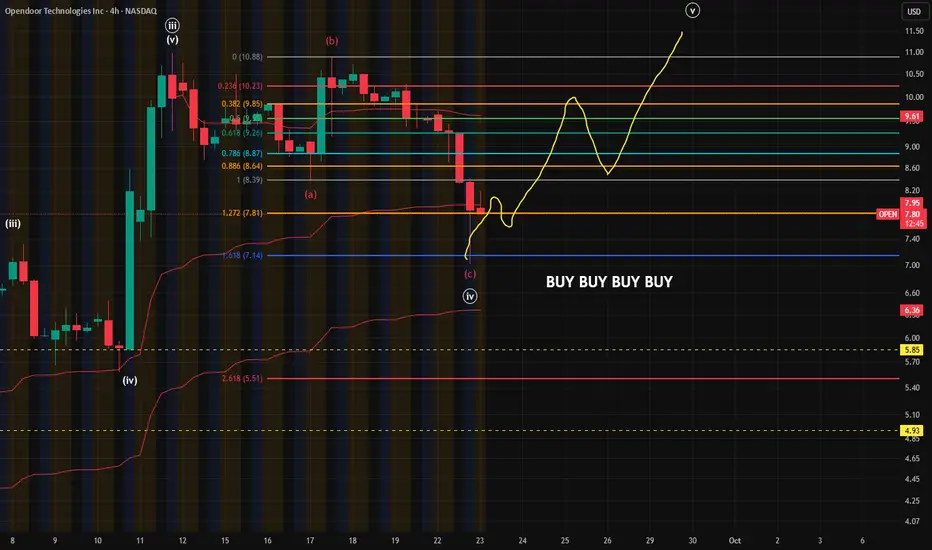
Buying OPEN on the openOPEN has been on my watchlist, and I was waiting for a clearer picture. This wave-count I'll admit is not the best and in-fact may be a little forced, part of my immediacy to buy is I've been waiting for a pullback greater than 20% to buy into. Basically, what I'm saying is; solid chance I'm too early for this entry, but with the 1.618 extension touch in pre-market, I'm buying into this on the open.
Wave-Count Confidence: Average
25M trade ideas
OPEN HIGH PROBABILITY SETUP SOON!!!🚨 OPEN HIGH PROBABILITY BUY SETUP 🚨
* Here We Can See Clearly The Next Potential Move For OPEN Coming Hours/Days.
* Keep Your Eyes Close On Your Trading Positions.
* Happy PIP Hunting Traders.
FXKILLA.

$OPEN: The Rhythm of the Market - The Exhalation After the InhalGreetings, fellow traders.
We navigate the markets not as a series of disconnected events, but as a continuous, flowing rhythm. There is the inhale—the expansion, the breakout, the euphoria. And there is the exhale—the contraction, the consolidation, the reversion. After a successful ride on the inhalation of NASDAQ:OPEN , it is wise to pause, observe, and listen to what the chart is telling us now. It seems the market's breath is beginning to turn.
The Technical Landscape
The recent ascent in NASDAQ:OPEN has been powerful, a testament to the bulls' conviction. However, no trend moves in a straight line forever. We are now seeing signs of potential exhaustion—clues that the bears are beginning to stir and fatten up for winter.
RSI Divergence: Notice on the daily chart how price has pushed to new highs, yet the Relative Strength Index (RSI) is failing to confirm, printing lower highs. This is a classic bearish divergence, suggesting that the momentum behind the rally is waning.
MACD Convergence: The MACD histogram is showing a clear convergence, indicating that the moving averages are coming closer together. This often precedes a potential shift in momentum or a crossover to the downside.
Parabolic Extension: A move from ~$4 to over $10 in such a short time frame is significant. Such rapid ascents often require a period of retracement to find equilibrium before the next directional move can be established.
This is not a prediction of a crash, but an observation of balance. The market inhaled deeply, and now a natural exhalation may be due.
The Philosophy
In moments like these, one must ask: What is my role in this story? The answer is never the same for everyone.
For the long-term investor, this may be nothing more than noise—an opportunity to accumulate according to their plan. For the hyper-active day trader, it's another set of patterns on a lower timeframe. For the swing trader, it may be a moment to take profit from the long side and assess the landscape for a new opportunity. There is no single right answer, only the one that aligns with your system, your timeframe, and your peace of mind. To blindly follow another is to be a salmon swimming against your own current. This analysis is simply one piece of the puzzle. It is up to you to see if and how it fits into your own masterpiece.
An Illustrative Setup
For those whose perspective aligns with a potential reversion to the mean, here is one possible way to frame the opportunity. This is a bearish setup, looking for the "exhale" phase to play out.
Ticker: NASDAQ:OPEN
Bias: Bearish / Mean Reversion
Entry (Short): $9.30
Stop Loss: $10.75 (Positioned above the recent swing high, invalidating the exhaustion thesis if breached).
Take Profit: $6.00 (A level of prior consolidation and potential support).
Risk/Reward Ratio: ~2.23
Trade with clarity, manage your risk with discipline, and remember that every chart is a lesson in market psychology.
Remember: Just shine!
Disclaimer: This is not financial advice. It is for educational and informational purposes only. Please conduct your own research and manage your risk accordingly.
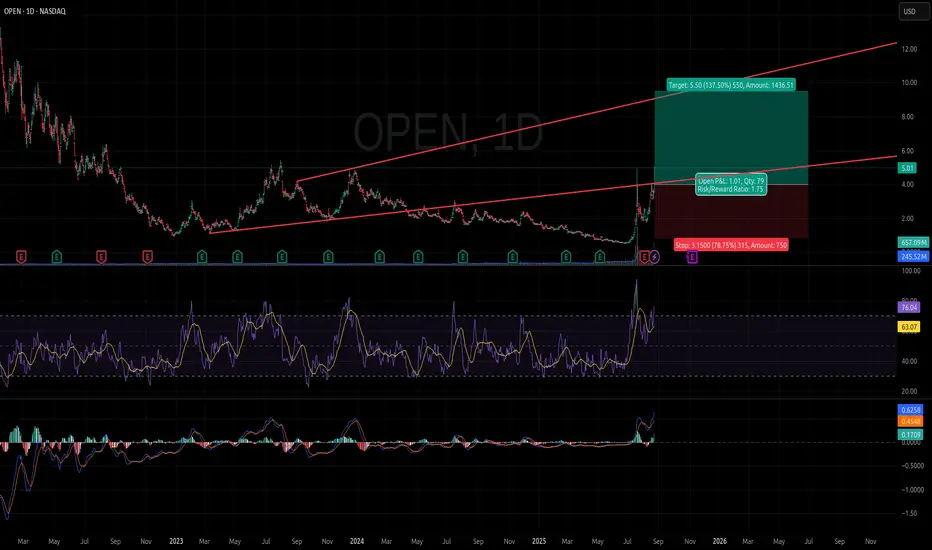
Open to $15, but watch the pullbackThis chart is pretty simple. Everything lines up really nice, including the fib extension, the expanding 12345 move, and timing. Happy to hear what you think.
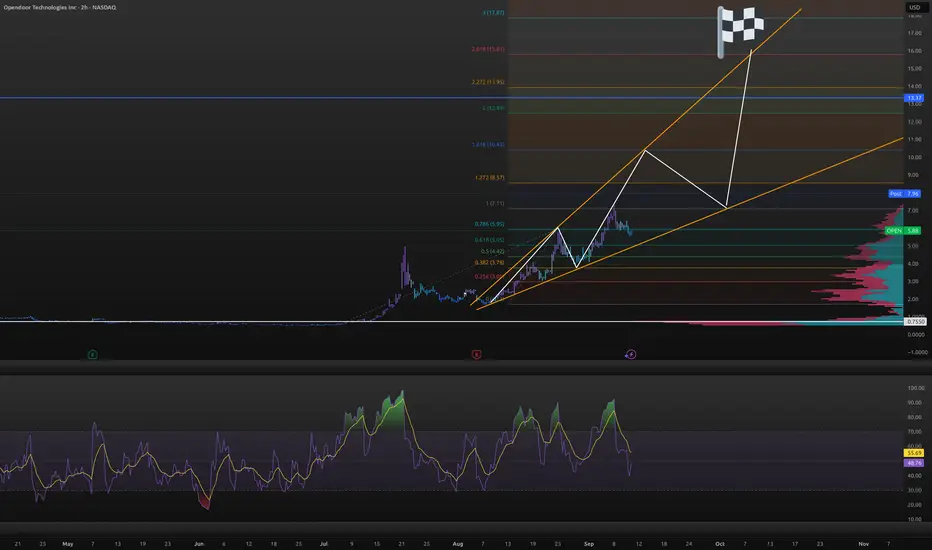
OPEN order basically we have had
indication
correction
continuation
where I've placed my order is where buyers should be control above

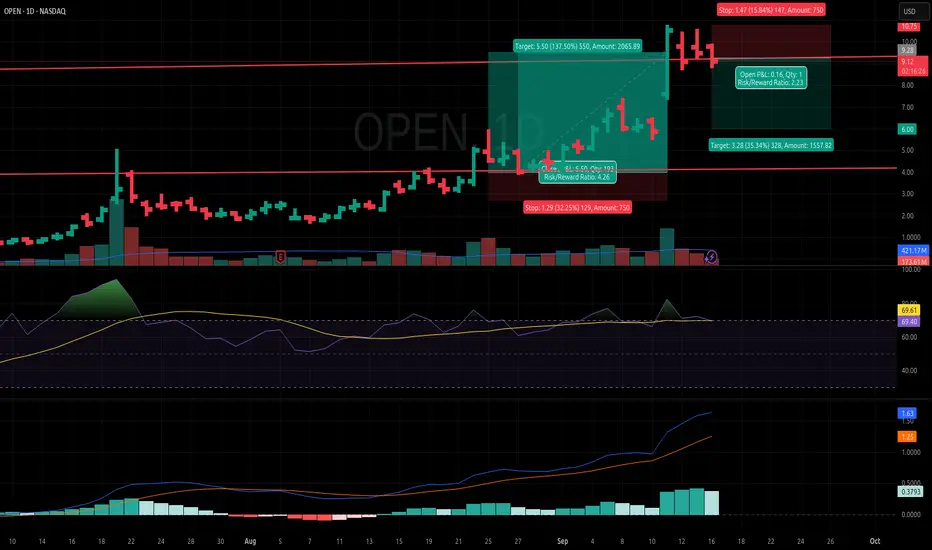
$OPEN: The Second Breath - A Gap Fill Re-entryThe Technical Landscape
Our first attempt to short this parabolic move was stopped out. The market wanted to test higher prices, and we paid a small tuition fee to learn that. However, the core thesis of exhaustion has not been invalidated. In fact, the price action following the recent Fed decision gives us more conviction that a market cool-down is due. The tide is ready to reset.
The setup is now even clearer, presenting us with a classic gap fill opportunity. Below us, there is a large unfilled gap down to the $6.75 area. These gaps often act like vacuums, pulling price back to fill the void left behind during a rapid ascent. For traders of all levels, this is one of the most powerful visual cues the market provides for a potential target. We are simply looking for the "exhale" back towards that gap.
The Philosophy - Conviction Over Ego
A stop-out is simply information. A trade setup with a reward:risk greater than 2:1 is a mathematical edge. When you combine the two, you have a process that allows you to be wrong and still be profitable over the long term.
This is not about revenge trading or being stubborn. This is about having a thesis, testing it, receiving feedback (the stop-out), and re-engaging because the thesis itself remains sound. The market simply told us, "not yet." We listened, took our small paper cut, and now we try again, calmly and with a clear plan that the math supports.
An Illustrative Setup
For this entry, our stop loss must be placed intelligently behind what I call "moats"—clear structural levels that would invalidate our idea if broken.
Style: Short / Gap Fill Re-entry
Entry: Around the current levels of ~$10.20 or higher.
Stop Loss: ~$11.25. This is placed above the recent swing high and the psychological whole-number moat of $11.00.
Take Profit: Targeting the gap fill at ~$6.75.
Risk/Reward: Approximately 1 : 3.33 (repeating of-course)
Remember that the daily ATR is ~$1.20, so account for that volatility in your risk management. The plan is clear. The risk is defined.
Just shine.
Disclaimer: This is not financial advice. It is for educational and informational purposes only. Please conduct your own research and manage your risk accordingly.

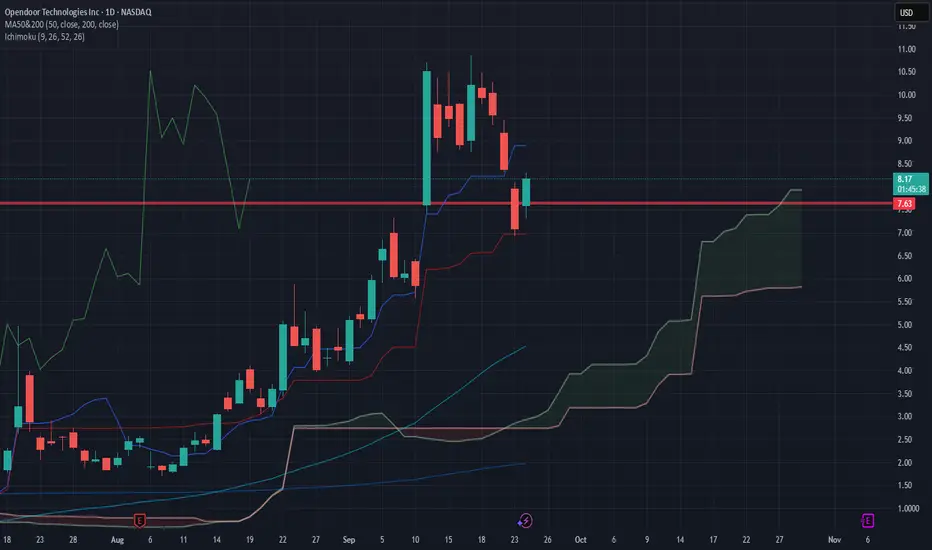
trade active! bought in at 7.63, target 10+quick trade.
this looks like a gap fill re-entry for a quick scalp.
pop out after this will go above 10, or you can hodl till $82 if youre part of the meme.
i like short scalps so ill be out after we pump
OPEN LONGOPEN just shattered a long downtrend, rallying from under $1 to nearly $10 on heavy volume and strong momentum. Sales are solid at $5.18B with EPS growing 70% QoQ, despite some leverage on the balance sheet.
The Fed’s recent rate cut looks like the start of an easing cycle, which should lower borrowing costs and fuel housing demand a major tailwind for OPEN. With technicals breaking key resistance and macro conditions improving, $22+ is a realistic target if the stock holds above $10.
This setup could drive significant upside over the coming months worth watching closely!

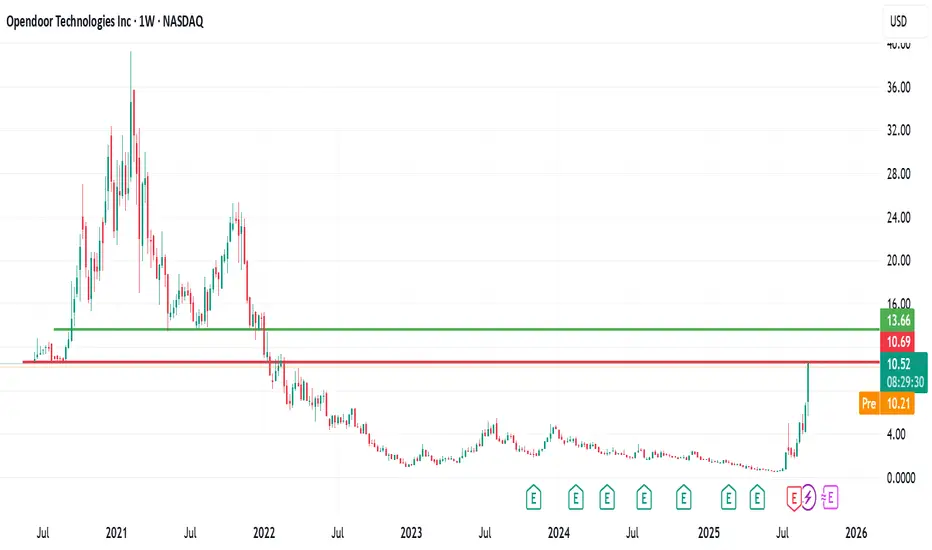
Opendoor is back to its historical (IPO) levelOpendoor is back to its historical (IPO) level
Opendoor Technologies (NASDAQ: OPEN) has made a remarkable journey back to its historical IPO price level.
The company went public in mid-June 2020, with its stock price surging to a peak of around $39 per share by early May 2021—representing a gain of more than 260%. However, the momentum reversed sharply, and despite several recovery attempts, the stock continued to decline, eventually hitting an all-time low (ATL) near $0.50, a loss of over 95% from its peak.
Since reaching that bottom, Opendoor has staged a powerful rebound, pushing back toward its IPO level from 2020.
Key questions for investors now are:
What fundamental catalysts could drive a decisive breakout above this level?
How much further upside potential exists from here?
Should investors also prepare for the possibility of another pullback?
Final thought: A confirmed breakout above the IPO level could open the door to further gains, with the next potential target around $13 per share.
📌 This analysis is for educational purposes only and not financial advice. Please trade and invest responsibly.
If you found this helpful, like, follow me, subscribe, share and comment.
$OPEN touched 10$. Next Stops are 15 $ and 25$. Shorts be aware.When I wrote my first blog on NASDAQ:OPEN predicting it will reach 9 $, I got pushback on pumping a ‘meme’ stock with shallow technical analysis based on Fib levels. I wrote on July 19th that by end of summer we will touch 9 $.
NASDAQ:OPEN : Ongoing short squeeze. What are the Fib levels telling? for NASDAQ:OPEN by RabishankarBiswal — TradingView
The 9 $ target has been long achieved. But it was surprising for me to see that since my article on July 19th the short interest in NASDAQ:OPEN has increased to 23% from below 20%. The days to cover has decreased from 1.8 to 0.6. All of these can create violent short squeezes and high volatility. With less than 1 day to cover the shorts, the shorts sellers might get slaughtered if they overstay their welcome.
So, what does all the technical and short interest data tell us. The shorts have not learned their lesson. Wall Street Bets is holding onto this stock to make it its next best meme stock. Now with NASDAQ:OPEN over 10 $ the large institutional investors can buy and include it in their portfolio, especially those with a momentum tilt.
Again, going back to the simple tool in technical analysis and checking on our Fib levels I think the next price levels are 15$ which was a major support in 2021. Once 15$ level is achieved then the next level to watch is 25 $ where it can experience some resistance which was a previous local high.
Verdict: Short sellers should cover shorts and run for the hills. NASDAQ:OPEN can reach 15 $ and subsequently 25 $ with Fed reducing rates and volatility spikes.

Opendoor Technologies Inc. (OPEN) Innovates Real Estate SalesOpendoor Technologies Inc. (OPEN) operates a digital real estate platform that simplifies buying and selling homes. By offering instant cash offers and streamlined transactions, the company removes many of the traditional frictions of real estate. Opendoor’s growth is fueled by consumer demand for faster, tech-driven housing solutions, expansion into new U.S. markets, and its ability to scale operations with data and AI-driven pricing models.
On the chart, a confirmation bar with rising volume highlights bullish strength. The price has entered the momentum zone after climbing above the .236 Fibonacci level. A trailing stop can be placed just below this Fibonacci mark using the Fibonacci snap tool, helping traders lock in profits while staying positioned for further upside potential.

$OPEN BIG GAMBLE IF YOU ASK ME Bottom Line: Most traders on X are pumped about NASDAQ:OPEN , expecting it to climb fast from $9.17, maybe hitting $10–$18 soon. But it’s risky—do your own research (DYOR) and be ready for ups and downs!

Opendoor Technologies (OPEN) – Gap Fill & Bounce Setup🔍 Technical Analysis
After a strong run, OPEN has pulled back sharply (-13.7%) into a key support zone.
The green box marks a gap-fill + MA support area — often a spot for reactive bounces.
RSI is cooling off from overbought but still holding above midline → momentum not broken.
Chart annotation: “Fill the gap! MA/BOUNCE, just like Hims&Hers” — similar playbook seen in HIMS before a strong reversal.
📊 Levels to Watch
Support (gap/MA): $8.50–$9.00
Deeper Support: $5.87 → $5.20
Upside Targets:
$10.00 (first reclaim)
$13.27 (premium supply zone)
✅ Outlook
OPEN’s risk-reward improves here if $8.50–$9.00 holds. A bounce from MA support could target $10+ in the short term, and possibly extend toward $13.27 on momentum.
#OPEN #RealEstate #WaverVanir #GapFill #BounceSetup #TradingView

$open, you never go broke taking profitsLots of charts floating around showing NASDAQ:OPEN going to $20-25 and $84 (laughable - at least in the near term).
Open is likely to find resistance just above where we're at right now and then I think most of the people that longed calling for these highs will see a full round trip in their portfolios, because I think it's very likely that we go to test one of the bottom two supports before any move to $20+.
You never go broke taking profits.

9/11/25 - $open - good luck9/11/25 :: VROCKSTAR :: NASDAQ:OPEN
good luck
- you're going to need it
- spending too much time on social media taking other people's opinions about a stock you have followed for precisely 2 weeks?
- it was going to zero for a reason
- i wish you all the best in your journey to imaginary tendie town
V

Open is approaching a huge yearly fib. Be careful. Open has had a huge push up the past 2 months. Its been amazing to watch. For those that have been long, I would definitely recommend locking in some profits. Always have a runner position to hold for the long term. But we are at a huge level and It would make sense to see a rejection here. We might gain this level and then dump as well.
This will be a fun one to watch at these huge levels. The fib pull is my something I discovered that works very well as major levels.

OPEN - Opendoor Tech - PT $7.95OPEN is holding strong the Short Squeeze, showing Price Target Potential for $7.95 going into October (based on current bullish trend and angle/degree of increase.
With every New Friday, the squeeze becomes tougher and tougher to hold while also considering the expirations of options - Shorts exiting.
Interested to see where this lands

OPEN: The Rocket Has Launched - Targeting Higher After a Brief PGreetings, fellow voyagers of the markets!
Tonight, we turn our gaze to OPEN, and what I see is a chart screaming with bullish intent. Remember, these are just probabilities we are navigating, but sometimes, the probabilities align in a way that demands attention. And when we speak of probabilities, remember this: anything is possible. There are no limits! #limitlessTrader
OPEN: Blasting Through Resistance
The recent price action on OPEN has been nothing short of a rocket launch. It has emphatically broken through previous resistance levels, treating them as if they were mere whispers of bearish doubt – the empty threats and fur of bears left behind in the dust.
Here's what fuels this bullish fire in my eyes:
Overbought Momentum: Both the MACD and RSI on the daily timeframe have surged into overbought territory. While some might see this as a warning sign, in the context of such strong price action, it often signifies powerful underlying buying pressure. This rocket has serious juice!
Clean Breakout: The move through resistance was decisive. This suggests genuine conviction behind the buying.
Potential Trajectory: A Brief Pause Before the Next Stage
While the momentum is strong, it's reasonable to anticipate some profit-taking after such an explosive move. This could lead to a temporary pullback to test the recently broken resistance level, which may now act as support – the solidified tears of the bears, if you will.
Potential Re-Entry Zone: I'll be watching the area around the previous resistance (now potential support) for a potential bounce and continuation of the uptrend.
Considering the Macro Landscape
It's crucial to remember that our charts exist within a broader context. The current global geopolitical state introduces an element of uncertainty that cannot be ignored. While OPEN's chart looks incredibly bullish in isolation, we must remain aware that macro events can always throw a curveball. Be prepared for potential volatility and stick to your risk management plan.
The Philosophy of Limitless Possibility
This chart reminds us of the inherent potential within the markets and within ourselves. Just as this stock has broken through perceived limitations, so too can we break through our own. Embrace the possibilities, stay adaptable, and never underestimate the power of focused energy.
This is my perspective on OPEN. May it add another piece to your understanding of the ever-unfolding market puzzle.
Just shine.
Disclaimer: This is not financial advice. It is for educational and informational purposes only. Please conduct your own research and manage your risk accordingly.
OPEN Long to 10.69Down ~98% from 2021 highs, changes to the business model, VC money is all sold (likely), and a chart to die for. I like it to IPO price, should tap within 18 months.

Meme Frenzy Meets Smart Money Exit — A Warning for Retail in OPD📖 Crown Point Research — Opendoor (OPEN) Scroll
1. Date & Time
Date: 06 September 2025
Time: 09.52 PM
2. Fundamental News
No fresh earnings or macro drivers.
Rally purely sentiment-driven with meme-stock enthusiasm and selective institutional backing.
3. Public Sentiment & Human Behaviour
Retail: Chasing highs with heavy FOMO, convinced momentum will never end.
Institutions: Quiet distribution into this strength, booking profits while retail piles in.
Social Signal: Headlines cheer “Opendoor hits 3-year high”, but under the surface, smart money exits quietly.
4. Current Structure
Macro :
Resistance: 7.2 – 7.5 zone.
Support: 6.0 – 6.2 zone.
Stage: Fragile maturity, vulnerable to profit-taking.
Micro :
Resistance: 6.9 – 7.1 short-term barrier.
Support: 6.6 – 6.7 shallow reversion zone.
Behaviour: Controlled pullbacks, not true rescues.
5. Projection
Primary Path (65%): Continuation attempt into 7.2 – 7.5 with retail still chasing.
Alternate Path (25%): Failure near 7.0 → pullback to 6.2 zone.
Low Path (10%): Sharp reversal to 5.8 only if liquidity dries suddenly.
6. Pullback Levels
Shallow: 6.6 – 6.7
Medium: 6.2
Deep: 5.8 (low probability, only under institutional shock).
7. Final View
Bias: Fragile Continuation.
Retail is fueling momentum, but institutions are distributing. Watch support at 6.6–6.7; failure here exposes the trap.
🚨 Retail FOMO vs Institutional Exit — The Hidden Trap in Opendoor (OPEN)
📌 Opendoor has exploded to a 3-year high, fueled by retail enthusiasm and cult-stock momentum.
📌 What most traders don’t see → institutions quietly distributing into this rally.
🔹 Short-term bias = fragile continuation as retail keeps chasing.
🔹 But if momentum cracks, expect a sharp pullback toward support zones.
⚠️ Lesson: When retail buys late, smart money sells early.
💡 Crown Point Research warns: Don’t confuse excitement with strength — learn to see the trap before it closes.
8. Essence
“Retail is chasing dreams, institutions are booking reality. Every rally hides a trap if you don’t know who’s exiting.”
9. Disclaimer
⚠️ This analysis is shared for educational and research purposes only. It is not financial advice, trading advice, or investment recommendation. Market decisions are entirely your own responsibility.
#crown_point_research
#trading_agi
#trading
#stock_market
#usstock_market

OPEN HIGH PROBABILITY SETUP SOON!!🚨 OPEN HIGH PROBABILITY BUY SETUP 🚨
* Here We Can See Clearly The Next Potential Move For OPEN Coming Hours/Days.
* Keep Your Eyes Close On Your Trading Positions.
* Happy PIP Hunting Traders.
£ FXKILLA £

Opendoor: A Digital Real Estate Platform Riding a Retail-Driven Opendoor is a U.S.based company operating in the real estate sector through a digital model called iBuyer. The company purchases homes directly from owners, offering immediate cash payments, renovates them quickly, and resells them. Sellers receive a fast and secure online offer, streamlining many of the complexities of traditional home sales.
Opendoor generates revenue through service fees, typically ranging from 5% to 9%, and the difference between purchase and resale prices. The company also provides additional services, including mortgages, title services, and escrow, diversifying its revenue streams. Opendoor primarily focuses on suburban areas, dealing with single-family homes built after 1960, with values between $125,000 and $750,000.
Why the Stock Has Surged in the Last Two Months
Opendoor’s stock rally has been driven by multiple factors, with retail investors playing a central role. A campaign led by Canadian fund manager Eric Jackson turned the stock into a viral phenomenon similar to GameStop or AMC, driving the price from around $0.51 to over $5 between June and August 2025: a more than 300% increase in just a few months.
Speculation was not the only driver. Investor pressure also led to leadership changes. In mid-August, CEO Carrie Wheeler resigned under this pressure, and CTO Shrisha Radhakrishna was appointed interim CEO, immediately purchasing approximately 30,000 shares. This move was perceived as a strong vote of confidence in the company, boosting investor optimism.
Other contributing factors include expectations of interest rate cuts and the potential for a short squeeze, given the high short interest of around 21–23% of the float, along with participation from institutional investors such as Paul Tudor Jones and Anthony Pompliano.
Parallels with Carvana
An interesting aspect is the strong structural similarity between Opendoor and Carvana. Although they operate in different sectors (real estate vs. used cars), they share several characteristics:
Asset-heavy digital model, involving the direct purchase of assets for resale;
Thin margins and high inventory risk, sensitive to market price fluctuations;
High capital requirements, with heavy reliance on debt to support growth;
Sensitivity to macroeconomic conditions, particularly interest rates;
Exposure to meme-stock phenomena, with speculative rallies and potential short squeezes;
Disruption narrative, presenting themselves as innovative companies capable of transforming traditional markets through technology and a simplified user experience.
Over the past two years, Carvana’s stock rose thanks to debt restructuring, operational efficiency improvements, and a rebound in demand for used cars. Strong margins and profits attracted investors and institutional funds. For Opendoor, these structural similarities suggest that if it can consolidate profitability and manage capital effectively, it could follow a similar trajectory of recovery and stock appreciation.
Opendoor’s Financial Performance
In Q2 2025, Opendoor reported positive signs:
Adjusted EBITDA of $23 million, the first positive quarter since 2022;
Revenue of $1.6 billion, up 4–5% year-over-year and exceeding analyst expectations;
Contribution profit of $69 million and slightly negative EPS of –$0.04;
Strong liquidity with approximately $789 million in cash;
Reduced inventory, with 4,538 homes at quarter-end, although homes unsold for more than 120 days increased to 36%;
Cautious Q3 2025 outlook, with revenue projected between $800 million and $875 million and adjusted EBITDA expected to turn negative again.
Based on the recently published study, potential price targets for Opendoor in the coming months have been identified using Elliott Wave theory; this is not financial advice.

OPEN Bulls Charge! $5.50 Call Setup | High Gamma Play
# 🚀 OPEN Weekly Options Trade Idea (2025-09-03)
### 📊 Multi-Model Recap
* **Daily RSI**: 🔥 70.8 (strong)
* **Weekly RSI**: 🚀 80.7 (overbought but bullish)
* **Options Flow**: 💎 C/P = 3.07 (extremely bullish)
* **Volume**: 📉 0.6x (40% drop vs prior week → caution)
* **Gamma/Theta**: ⚡ High risk (2 DTE)
👉 Models in agreement: **ALL bullish** → \$5.50 CALL strike.
* Stops range: 40–50% premium.
* Profit targets: +50% up to +100%.
* Confidence: 65–75% (avg \~72%).
---
### ✅ Consensus Trade Setup
```json
{
"instrument": "OPEN",
"direction": "call",
"strike": 5.5,
"expiry": "2025-09-05",
"entry_price": 0.31,
"profit_target": 0.60,
"stop_loss": 0.16,
"size": 1,
"confidence": 0.72,
"entry_timing": "open"
}
```
---
### 🎯 Trade Details
* 📌 **Strike**: \$5.50 CALL
* 💵 **Entry**: 0.31 (limit/ask at open)
* 🎯 **Target**: 0.60 (+90% R/R)
* 🛑 **Stop**: 0.16 (\~48%)
* 📅 **Expiry**: Sep 5 (weekly)
* 📈 **Confidence**: 72%
* ⏰ **Max Hold**: Close by Thu EOD (avoid Friday gamma bomb)
---
⚠️ **Risks & Notes**
* Overbought RSI → quick reversal risk ⚡
* Volume weakness = 🚨 conviction reduced
* High gamma + theta burn = tight stop & discipline
* Do NOT chase entry above 0.35 ❌
