PDD - Crazy PA Today!! What to look out for going forwardThere is clearly (proven) plenty of room for this to go up. Question is, what was today all about? To be honest, I'm just as confused as you may be especially with the very solid earnings that were reported and future growth outlook.
So I'm going to continue to stay away from the fundamentals and leave that to Sir Powell (purple tie, what'd I say about purple ties!!)
There is further growth opportunity here and I will be on the lookout to find it.
Stay tuned for further developments!
Happy Trading :)
Trade ideas

PDD Holdings' Temu Operator Surpasses Revenue ExpectationsPDD Holdings ( NASDAQ:PDD ) emerges as a formidable player, surpassing revenue expectations in its fourth-quarter earnings report. The driving force behind this success? Temu, its global platform, which has seen remarkable growth propelled by strategic end-of-year promotions and a surge in demand during China's Singles Day festivities.
Robust Growth and Financial Performance
The numbers speak volumes: PDD's fourth-quarter revenue soared to 88.88 billion yuan ($12.35 billion), surpassing analyst estimates by a significant margin. This achievement marks a staggering 123% year-on-year growth, following a robust 94% rise in the third quarter. What's more, this remarkable performance comes despite the lingering impact of COVID restrictions in China during comparable quarters in 2022, which were only lifted in December of that year.
Challenges and Uncertainties Ahead
However, amidst this success, challenges loom on the horizon. Concerns over political tensions between the U.S. and China pose a potential threat to Temu's continued growth in key markets. Analysts have cautioned that heightened scrutiny from policymakers, similar to what has been witnessed with platforms like TikTok, could impact PDD's operations. Additionally, supply chain disruptions and evolving consumer sentiments present ongoing challenges that PDD must navigate as it continues to expand its global footprint.
Optimism and Future Outlook
Despite these uncertainties, NASDAQ:PDD remains optimistic about its future prospects, particularly in its home market of China. With the government's support through macro policies aimed at bolstering consumer sentiment, PDD's subsidiary, Pinduoduo, anticipates further growth opportunities in the domestic market.
Market Dominance and Competitive Edge
Moreover, NASDAQ:PDD 's ascent to become the most valuable Chinese e-commerce company by market capitalization underscores its position as a dominant force in the industry. Surpassing Alibaba Group Holdings in market value further solidifies PDD's standing and underscores its potential for continued success in the ever-evolving world of e-commerce.
Conclusion
In conclusion, NASDAQ:PDD Holdings' impressive fourth-quarter performance, driven by the success of its global platform Temu, signals a promising trajectory for the company amidst a challenging and dynamic market environment. As it navigates through uncertainties and embraces opportunities, PDD's innovative approach and strategic vision position it for sustained growth and success in the years to come.

PDD - Our patience paid off! Our "lines" tell us everythingWe finally got the breakout we were waiting for on PDD and the makers set us up perfectly for a post-earnings gap up.
Happy for everyone who followed along our analysis and held strong on this one. Or maybe even added on the dip like I did.
We can expect some resistance at top of yellow here before a retest of white tapered selling and then an attempt to breakout of orange tapering again. See you all there!
Happy Trading :)

PDD Bullish Harami at major supportWeekly chart Uptrend, Bullish and Strong Bull.
PDD form major support and resistant at 50$ interval.. 50, 100, 150, 200 (Rounding Bottom)
This week closing with Bullish Harami candle (Bullish Reversal) with higher volume.
Banker is weak but overall still control the rally
FiFT is turning green this week.
Plan : Get ready for BOD (Buy on Dip) signal above 131. SL below 100.

PDD - Weekly Analysis to get a larger picturePDD continues to pull back and that is okay. But we do need to see some of our stronger buying continuation algos activate and get to work or else there is plenty more room to the downside. As you can see on this weekly chart, we are in a HTF large selling algo in teal. To break out of this we will need to be activated in our strong yellow/orange buying continuation and begin to see breakouts of our stronger controlled selling algos (White and magenta).
Hope this was helpful for all you PDD bag holders (me).
Happy Trading :)

PDD - Daily analysis - Opportunity to prove tapering approachingThis could be the sign that bulls have been waiting for. To prove tapering on the daily and activate a strong buying algo to make a move to breakout of our selling algos.
Keep an eye out for this - we will look for the white tapering on the daily to line up with our pruple tapering algo on the 1 HR.
Happy Trading :)

PDD - We've seen this exact PA before! Making sense of itThis is no surprise to anyone who's been watching and understanding my analysis videos, specifically on PDD. Our strong controlled selling magenta algorithm took control of price and tapered purple did not act as resistance as bulls would have hoped. Rather, similarly to price action in the past, we found support on our blue tapered controlled buying whereas bears subsequently pushed price into a deeper liquidity build for bulls.
We will now be looking for magenta to continue to build liquidity with purple tapered to gain support of price in order for bulls to activate any sort of buying continuation.
When purple taper starts to control price, we can begin to look for bullish PA back into previous highs and there we can expect large and consistent gap moves upward.
Hope this was helpful and that you're all enjoying the weekend!
Please join me tomorrow at market open (9:30 AM EST) where I will be trading live on a stream here on TradingView and taking trades, analyzing charts, and having fun with our awesome community.
And as always,
Happy Trading :)

PDD - Update and what to look out for as we approach crucial PAAre buyers or sellers in control? We'll know very quickly within the next few days - if we use magenta strong controlled selling to build liquidity and then gap up above purple tapered, we'll know bulls are. However, if blue tapered controlled buying (the algorithm that has built liquidity for the bears over and over again prior to massive drops) holds price, we will need to reanalyze and take it from there.
Hope this was helpful as this stock has the ability to MOVE! We want to be ahead of it and be prepared for the next big one - either bullish or bearish.
Happy Trading :)

PDD Holdings Update - As expected, we flew! But there's more!We expected this move and were prepared for it! But this thing still has legs for further move up as we see from the past and proven by this week's strong movement!
Happy Trading :)

This thing could FLY! PDD Holdings AnalysisMy analysis on PDD Holdings and what I am seeing in the charts. Huge potential for a large gap up and breakout.
Stay tuned as I'll continue to cover this as price develops.
Happy Trading!

PDD Wedge channel breakdownThis is for learning purposes.
As you can see PDD formed a triangle. After downward breakdown, it tried to retest the same level it broke from and got rejected. That rejection could have been a great puts play.

PDD look good around 74-76PDD should take support between 74 and 76, which is a fantastic opportunity. The chart indicates the levels.

PDD Holdings Upcoming EarningsAnticipating PDD Holdings Inc.'s imminent earnings report, I'm adopting a bullish stance, buoyed by the company's recent performance and heightened market enthusiasm. With PDD's robust marketing campaign for the Temu app in the US, I believe there's a potent catalyst for positive earnings results. My strategy is twofold, involving meticulous observation of the earnings report's impact on stock prices. Employing a dual trendline approach, I've tactically positioned a stop-loss level to shield against potential downturns. Conversely, I've pinpointed a take-profit threshold, harmonizing with historical price trends and pivotal resistance levels. An intriguing technical development further fortifies this position—the looming potential of a 50-day and 200-day Moving Average crossover. Should this transpire, it could validate the stock's upward trajectory. Admittedly, trading carries inherent risks, and this analysis hinges on upcoming earnings performance. My strategy remains dynamic, adapting to market nuances for optimal gains while prudently managing risk factors. Regardless, the price action will be worth observation and potential entry.

MBV-SP500-CLIMBER: PDDIntroduction:
This trading idea is based on a Long-Only strategy that utilizes the Dynamic Movement Index (DMI), supplemented by the Average Directional Index (ADX) and an Average True Range (ATR)-based Trailing Stop-Loss.
Strategy Overview:
Main Indicators: DMI, ADX, ATR
Time Frame : Variable, based on the DMI length (Default: 14 days)
Objective: To take long-term positions in bullish market phases
Optional Trading Hours and Seasonality:
Yellow Background (Trading Days) : Positions are only opened on trading days highlighted with a yellow background on the chart.
Blue Background (S&P 500 Seasonality) : Positions are only opened during periods highlighted with a blue background on the chart.
Strategy Details:
ADX and DMI : A Long signal is generated, taking into account the optional trading hours and seasonality, when the ADX exceeds a defined threshold and the positive DMI is greater than the negative DMI. This indicates a strong upward movement.
ATR-based Trailing Stop-Loss : The Stop-Loss is dynamically set with a multiplier of the ATR value below the current price and updated to secure profits.
The strategy script is available for free on TradingView.
You can find it under the name: "MBV-SP500-CLIMBER"
Please share your optimizations with the TradingView community by leaving comments under the script.
Please provide feedback on the strategy, especially on the trading signals, in the comments.
---
Einleitung:
In dieser Handelsidee beruht auf einer Long-Only-Strategie, die auf dem Dynamic Movement Index (DMI) basiert, ergänzt durch den Average Directional Index (ADX) und einen Average True Range (ATR)-basierten Trailing Stop-Loss.
Strategie-Überblick:
Hauptindikatoren : DMI, ADX, ATR
Zeitfenster : Variable, basierend auf der DMI-Länge (Standard: 14 Tage)
Ziel : Langfristige Positionen in bullishen Marktphasen
Optionale Handelszeiten und Saisonalität:
Gelber Hintergrund (Handelstage): Positionen werden nur an den im Chart mit einem gelben Hintergrund hervorgehobenen Handelstagen eröffnet.
Blauer Hintergrund (S&P 500-Saisonalität): Positionen werden nur während der im Chart mit einem blauen Hintergrund hervorgehobenen Zeiträume eröffnet.
Strategie-Details:
ADX und DMI : Ein Long-Signal wird unter Berücksichtigung der optionalen Handelszeiten und Saisonalität generiert, wenn der ADX einen definierten Schwellenwert überschreitet und der positive DMI größer ist als der negative DMI. Dies signalisiert eine starke Aufwärtsbewegung.
ATR-basierter Trailing Stop-Loss : Der Stop-Loss wird dynamisch mit einem Multiplikator des ATR-Wertes unter dem aktuellen Preis gesetzt und aktualisiert, um Gewinne zu sichern.
Das Strategie-Skript ist auf TradingView kostenlos verfügbar .
Sie finden Sie unter dem Namen: "MBV-SP500-CLIMBER"
Bitte teilen Sie Ihre Optimierungen mit der TradingView-Community, indem Sie Kommentare unter dem Skript hinterlassen.
Bitte geben Sie Feedback zur Strategie, insbesondere zu den Handelssignalen, in den Kommentaren.

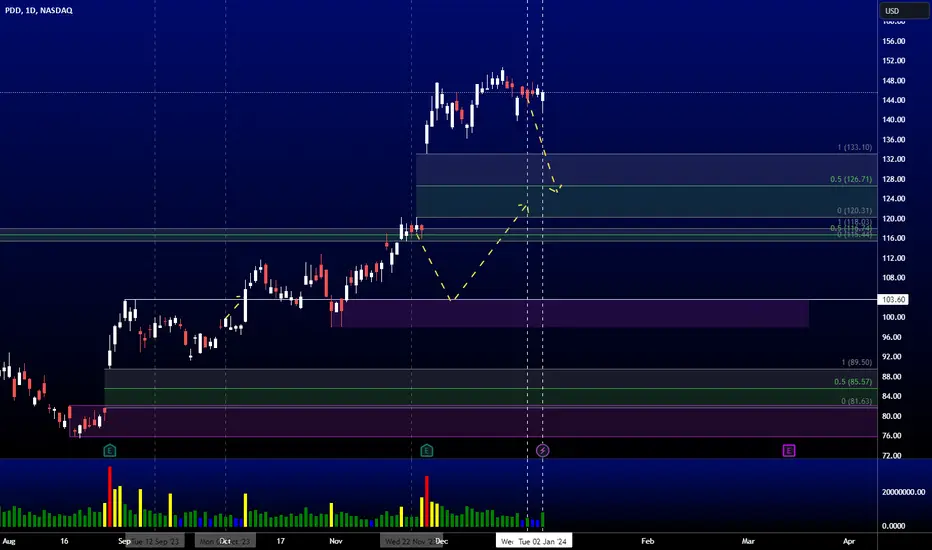
PDD AnalysisPrice consolidated since my last analysis. No changes to my original expectations, I'm expecting a bearish retracement to fill the fair value gap at $126.71 next, given the over-extended bullish price action recently.

PDD AnalysisPrice played out nicely as analyzed last week, giving us a -5.39% move to the downside. From here, I'm expecting a continuation to the downside to fill the fair value gap at 126.71 next.

PDD AnalysisPrice consolidated since my last analysis. No changes to my original expectations, I'm expecting a bearish retracement into the fair value gap at 126.71, given that price is in an extreme premium level. A bearish retracement is highly probable.
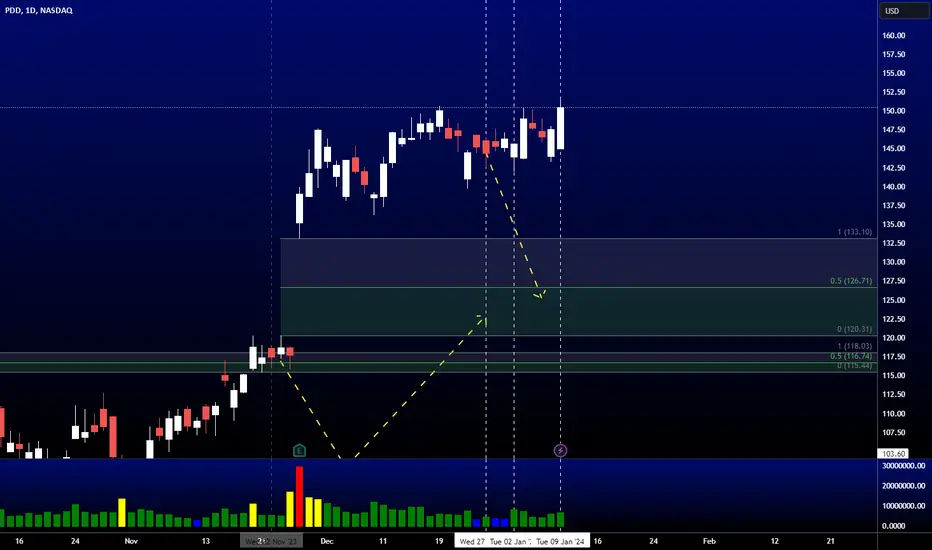

PDD AnalysisPrice consolidated since my last analysis. No changes to my original expectations, I'm expecting price to make a bearish retracement from here, given that price is on the extreme premium level in the current PD array.
PDD likely pull back to reality on the short term. NASDAQ:PDD is showing bearish divergence in the RSI after a consistent upward movement in a considerably bullish trend. The RSI is weakening showing less momentum. Additionally the oscillators such as stochastic and MACD are flashing sell signals.
I suspect NASDAQ:PDD will have a slight correction down over the coming weeks to fill the gap on the Nov 27th, and touch the 50MA. I would be looking to buy as the price nears $125.
In the future I would be careful trading this stock around the earnings date March 13th and also when the IPO lockup period ends in May.

PDD AnalysisPrice did not play out as analyzed last week after filling the FVG at 116.74. Right now, there is a huge FVG created on the last earning release. Right now, price is on the extreme premium, and I'm expecting a bearish retracement into the FVG at 126.71 next.

PDD bulls try to take back control 👀its climbing back above bullish trend support, but we still need to clear 110 level before it takes off in my opinion..
looking for rally to 129-146 once I get confirmation. 🎯
boost/like and follow for more.. thanks 💚

Pullback scenarios for longI see two scenario playing out for a long term bullish trade.
Bias: Bullish
Why: Neckline breakout of inverted head & shoulders with a positive earning gap.
Scenario A: Price action is currently showing a bullish flag after the huge earnings gap up. We can see price retrace to test the end of the gap. With a high possibility of bouncing and breaking the bull flag structure to a new high.
Note: 12/8 ended with a green volume day above average breaking the latest downtrend volume structure.
RSI is still show PDD in an overbought scenario, most severe since Aug/Sep 2019'.
MACD is turning to a SELL signal at the top of the indicator.
Given the indication for a dire pull back...
Scenario B: Price action retraces to fill gap, bouncing to retrace back to the I-H&S neckline or 200 EMA before a rocket launch to $170 price target.
Thoughts?
Pure speculation. Trade responsibly.
