APPL, Get Yourself a Good PriceHello This week we are breaking down the MAG7 starting with Apple.
This analysis is an aid to help you:
1 Find good price to add to your long term.
2 Hedge your current position.
3 Make a swing trade (we will touch on options pricing as well).
Currently Apple is 1 of 5 of the MAG 7 that had not gained a new high since Trump and the tariff scares. Many analysts have given their predictions on where Apples fair value lies and these vary. What they will not tell you is where the institutional buyers and sellers are. Not to worry, this is where we come in
Big Buyers and Big Sellers
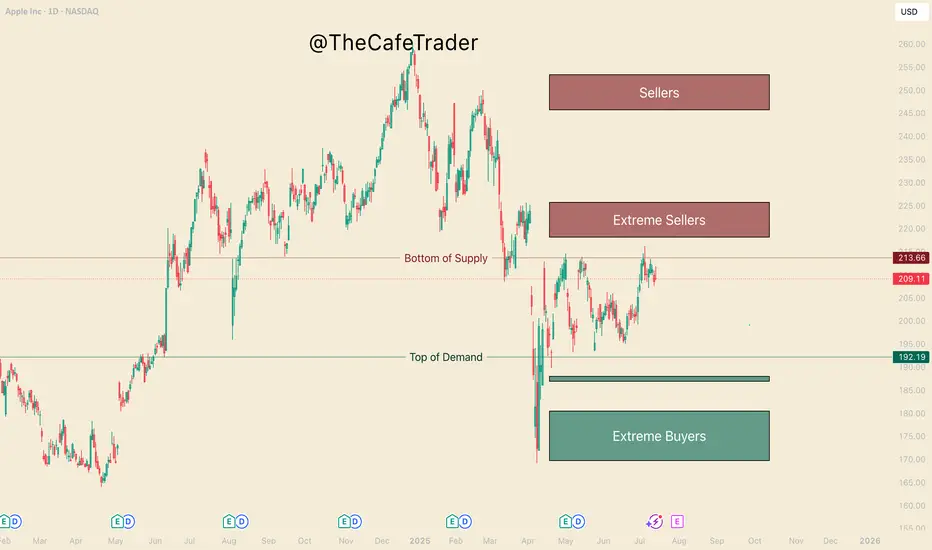
On the chart in front of you, take a look at the 3 different buy and sell zones (otherwise known as supply and demand zones). We find these areas in using a system similar to "imbalances" if you are familiar with the footprint chart, or orderflow. If you had no idea what any of that means, not to worry, I've done the work for you.
-The lines represent the fringe of real liquidity . Using this we will be able to help you find how and when you can find a good price for your long term.
- Buyers/Sellers: strong motivated liquidity.
- Extreme Buyers/sellers Extreme demand, this is an area you could consider a steal.
1 How do you find good pricing?
Simply put - Buy with the buyers and sell with the sellers.
If you are wanting to add to your long term here are the prices. Do you want to get in ASAP? or are you willing to wait for what could be a great deal. This is important as the end of the year can greatly depend on not just picking a good stock, but finding a great price.
Buying
Fair - 192
Good - 188-187
GREAT - 180-169
Now if you are in, and maybe you want to hedge the downside (you can do this by shorting the stock, or buying put options (even more in depth you can do spreads).
For now we will just focus on Buying Put options and taking profit for swing traders.
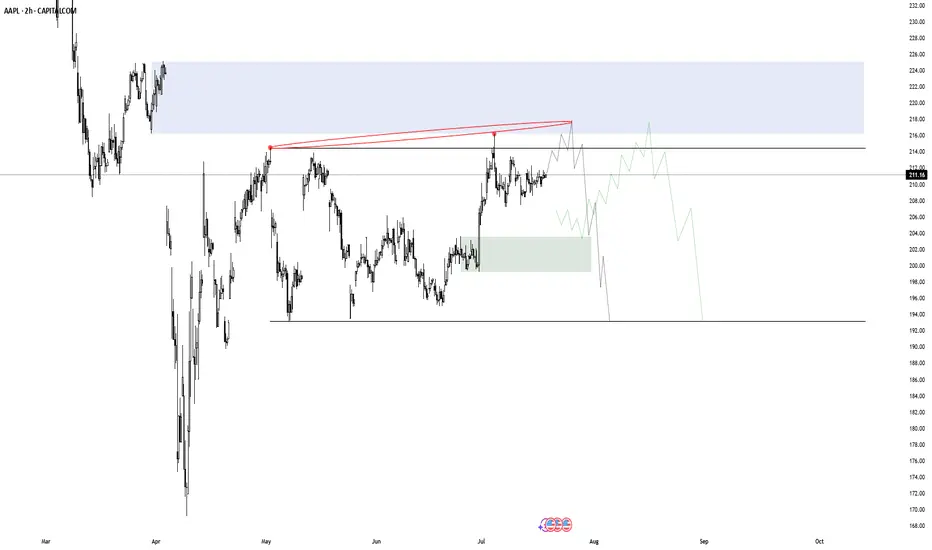
The Burgundy line "bottom of supply" previously rejected this area twice before (May 1st, and May 14th). July 7th marks the 3rd rejection. It's important to note that the last test pushes a new high, this shows a bit of weakness from the sellers.
This weakness suggests we may see the 218-225 Sellers get tested before it comes down. The question is, How strong will the buyers be coming into this zone.
If they are aggressing this area with new REAL buyers, Then we may see this run through all these sellers and continue to run until the 245 area. If we do not find real buyers here, then likely we will reject to the pricing marked previously.
If you are holding APPLE, you can look to hedge with puts at the end of the 220-223. Since you are looking at about 5-7% downside from apple if the sellers are strong here, look to only spend 2-3% of your apple worth on puts. look for maybe 2-3 weeks out if possible.
Secondly if APPL does make a bull run to 245 you can mark this area again to hedge short term puts. look for 8-10%+ downside puts 3-4 weeks out (roughly 3-5% of your apple size)
Hedging can be very useful in wanted to keep your long term and navigate some of the ebbs and flows of the market. Notice that the risk of your puts, 2-3% & 3-5%, is half of the expected reaction from these areas. if you get a big rejection, expect these options to pay well.
NOTE: If you do not understand the implied volatility (IV's) change the price of options, it is recommended that you stay away from options until you have sufficient experience. It's also important to know how to find a good strike price, and how to know if you are getting a good price. I will be breaking down options pricing in a different time.
That's all for Apple, Stay tuned for the rest of the MAG 7!
APC8 trade ideas
APPLE: Weak Market & Bearish Continuation
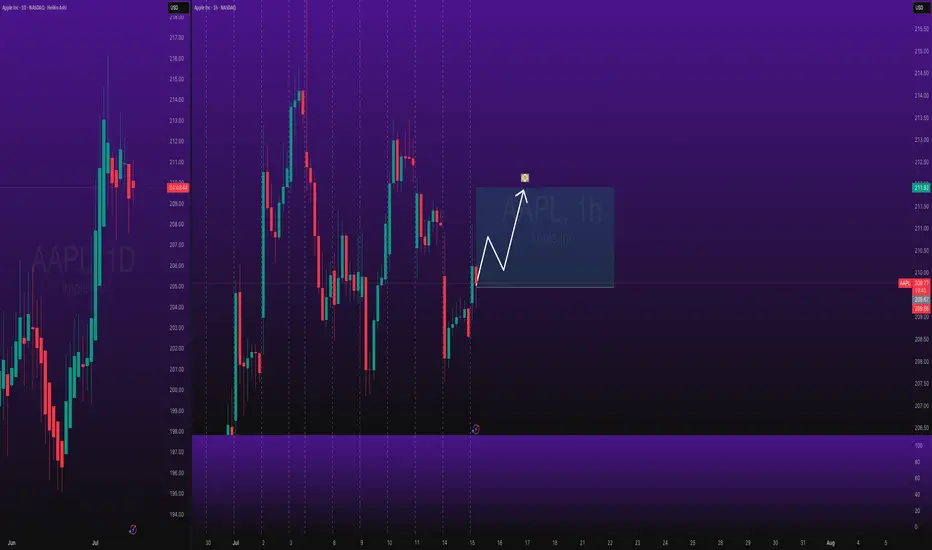
Looking at the chart of APPLE right now we are seeing some interesting price action on the lower timeframes. Thus a local move down seems to be quite likely.
Disclosure: I am part of Trade Nation's Influencer program and receive a monthly fee for using their TradingView charts in my analysis.
❤️ Please, support our work with like & comment! ❤️
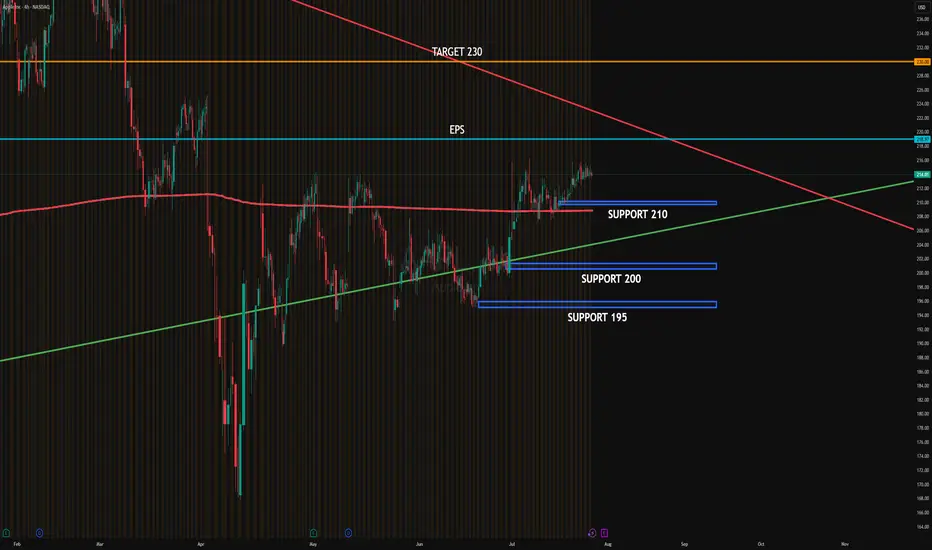
AAPL EARNINGSAAPL is consolidating just below the post-EPS resistance zone near 219, while institutions are actively defending support around 210. There's visible absorption at 210 and 205, aligning with high PUT interest, suggesting a strong institutional floor.
Distribution is evident in the 220–225 area, where CALLs are being sold to cap upside and benefit from theta decay.
Upside target: 230 if price breaks above 225 with volume.
Downside target: 200–195 if 210 fails to hold.
#AAPL #globaltrade #investment #investing #stockmarket #wealth #realestate #markets #economy #finance #money #forex #trading #price #business #currency #blockchain #crypto #cryptocurrency #airdrop #btc #ethereum #ico #altcoin #cryptonews #Bitcoin #ipo
AAPL HEADING INTO AUG 25'AAPL TOPPED @ 250-260 TO CLOSE OUT 24
BAD Q1
Consistent since then.
Consolidation happened @ key weekly support $194-198 range, solid move up after.
Long Apple currently.
They have the IPHONE 17 releasing in Sept with a few new colors and new back design as well as other affordable options to assist with consumer retention, entry and re entry into the apple hemisphere for consumers.
Earnings July 31st, currently expected to increase YOY for Q3.
I expect earnings to come in strong to assist with the move up to try and work back to retest ATH again.
Long back up to $247 range to close out 2025 for Apple. End of year Q3, Q4 is always their time to shine. Don't think we see a break of ATH in 2025 for Apple though. Retest, to come back down slightly again before major break.

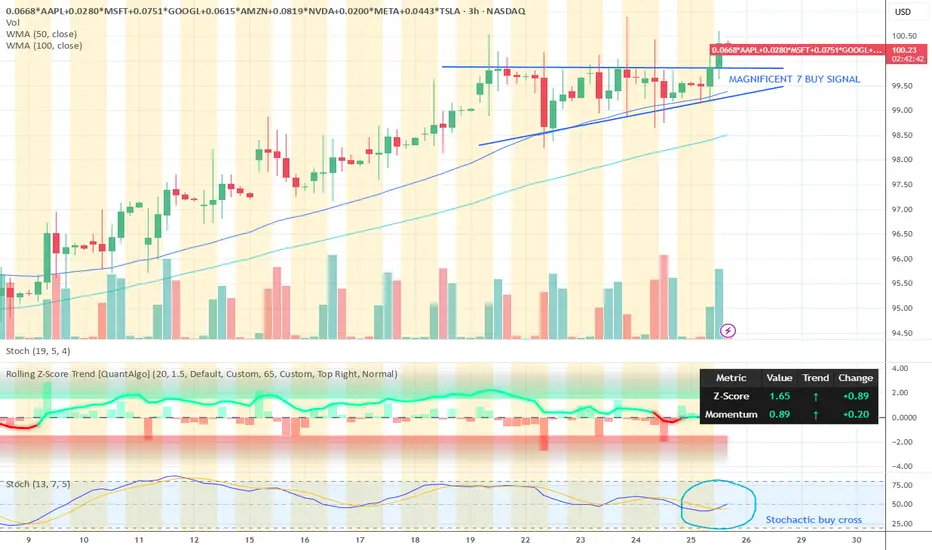
Magnificent 7 buy signalMagnificent 7 buy signal. These stocks are trading above their moving averages on 3 hour candle chart which is bullish. This basket made on tradingview consists of the 7 stocks.
Right now there is break through the resistance level and further upside is expected.
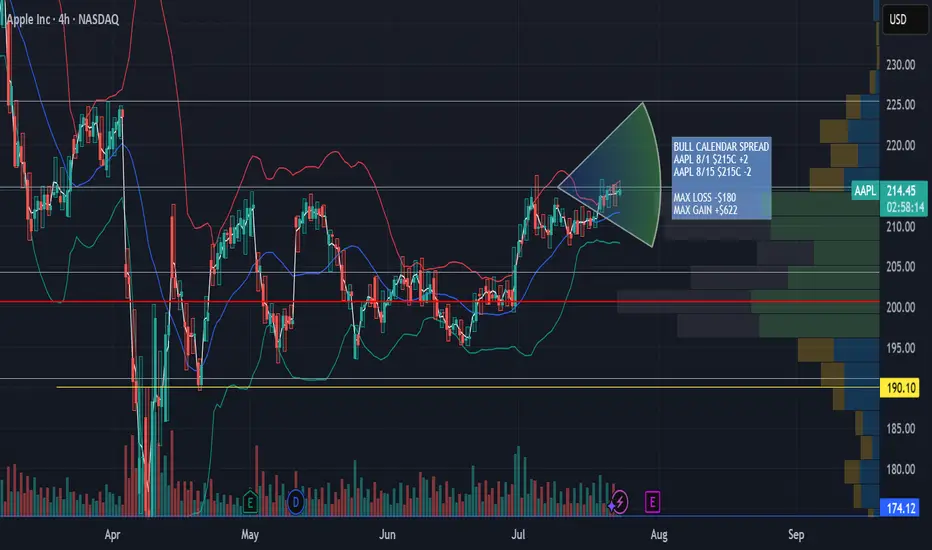
AAPL Aug 1st - Aug 8th 215 Calendar Call SpreadAAPL Aug 1st - Aug 8th 215 Calendar Call Spread
AAPL earnings after market close 7/31/25. Looking for an upward move into earnings with resistance at $225 then retesting support at $215. This zone falls between the .5 and .618 fib retracement. Great risk/ reward ratio 3.5:1
Time to buy? Too much negative press. Buy in Fear- Updated 18/7Apple has significantly underperformed compared to the other Magnificent 7 stocks, but I don’t believe it’s a company you should bet against in the current climate. With a slow rollout of AI and recent statements from Apple, they may not always be first to market, but they generally execute well. The remarks regarding Sony, Samsung, and Netflix by Apple were very revealing and demonstrate a solid long-term strategy. However, there may be some bumps along the way as they work toward their goals, potentially involving acquisitions.
The fear spread in the media is similar to the FUD (fear, uncertainty, doubt) often associated with Bitcoin, and this is typically a good time to buy. Remember the saying: if retail investors miss the boat, it’s gone, but if institutions miss it, they often bring the boat back.
While this is not financial advice, based on the green weekly candle, it's hard not to pay attention, and Apple may now have a very positive year ahead! Especially with the weakening dollar and reports stating that this will benefit them greatly.
Apple has been consolidating in the 210 USD region, forming a smaller flag pattern that is nearing completion. Based on this previous pattern, the next upward move is expected to reach >$220, where consolidation will likely begin again. With Apple’s earnings rapidly approaching and stronger-than-expected results anticipated, July and August could be very positive months for Apple holders.
A golden cross appears likely, with the 50-day EMA just $5.50 below the 200-day EMA. This would be very bullish for Apple and could trigger significant interest from both institutional and retail investors. Additionally, Apple has been lagging behind the other “Magnificent Seven” stocks, experiencing considerable selling pressure; however, this trend is now reversing. Apple is shaping up to be a good short-term and long-term hold.

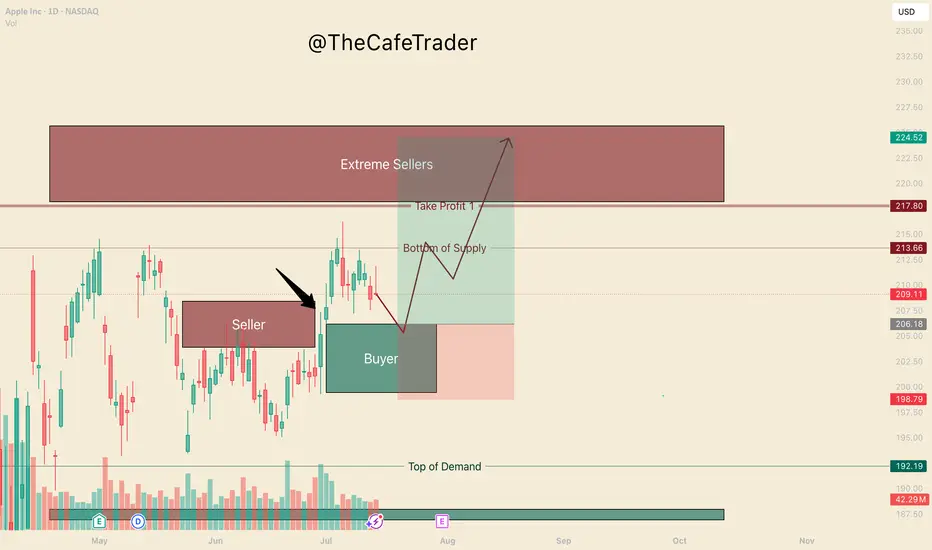
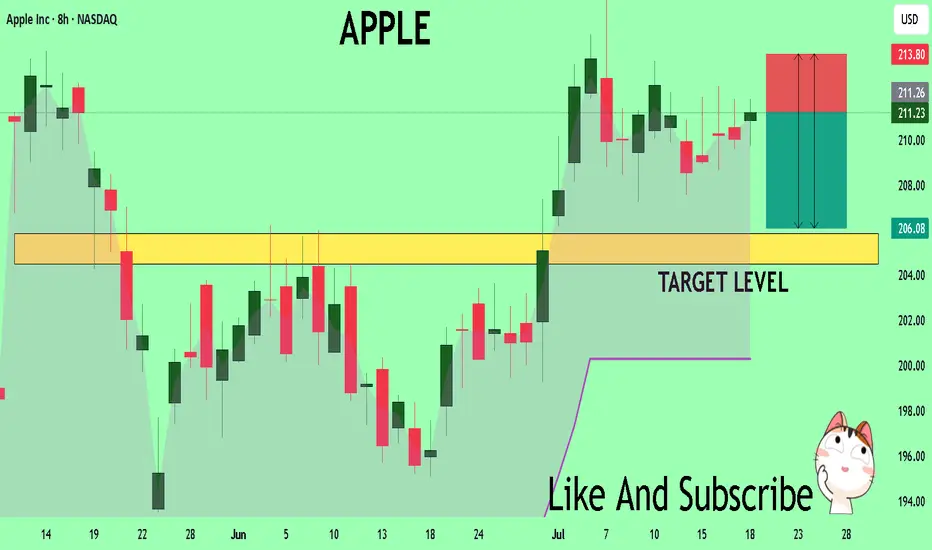
APPL. Bulls are in ControlHello, I’m TheCafeTrader.
This post is for technical traders looking to capitalize on short swings and options.
What you’re seeing here are supply and demand zones — areas where liquidity is concentrated. These levels are identified using a system built around footprint data, order flow, and market imbalances.
🔹 Key Observation:
I’ve marked a seller that price has now broken above. This tells us that buyers have overpowered a sell-side participant, and are now likely targeting deeper liquidity in the $218–$225 range.
🔹 On Apple’s Behavior:
Apple can be slow and choppy at times. So, if you’re trading options, consider going as close to the money as possible and give yourself some time on the contracts.
🔹 New Buyer in the Market:
Between $199–$206, a new aggressive buyer has stepped in. This player appears to be pressuring the first line of sellers (labeled “beginning of supply”).
🟢 My Expectation:
I expect AAPL to pull back to around $206 before catching a bid. As long as price holds above $199, buyers remain in control. In this range, I anticipate further accumulation by bulls.
🔸 Take Profit Levels:
• First TP: Just before the major selling cluster around $218
• Final TP: Deep inside the seller zone near $223
⸻
📊 Follow for more short-term analysis. This week, we’re covering both short- and long-term views of the MAG 7.
⸻
Apple battles resistance area – Can Earnings Turn It Around?Shares in Apple Inc. (symbol ‘AAPL’) gained back a large percentage of the losses incurred at the beginning of the second quarter. The company’s earnings report for the fiscal quarter ending June 2025 is set to be released on Thursday, 31st of July, after market close. The consensus EPS is $1,42 compared to $1,40 of the same quarter last year.
2025 is a hard year for the company so far since it lost more than 17% of its share value. The recent minor bullish rally might give some hope for a positive overall result at the end of the year, but the price needs to rise above $260 to be considered a positive year, and the company is still far from this number. Also, the financial image of the company is not looking great with the current ratio at 0.82 as of 31 March 2025. This means that the company is not liquid enough to cover the short-term liabilities with the current assets at hand. The payout ratio (percentage of the total earnings of the company paid out as dividends) is at 15,74% indicating that the company is looking forward to keeping most of its earnings for economic growth/strength, which is a good sign for the overall performance of the company.
On the technical side, the price is testing the resistance area between the upper band of the Bollinger bands and the 50% of the weekly Fibonacci retracement level. The level of $212 is also an inside resistance area of price reaction in early May and early July, making it a strong technical resistance level. The Bollinger bands are quite expande,d showing that there is volatility to support big moves. The Stochastic oscillator is near the extreme overbought level, but it's not in there just yet. On the other hand, the moving averages are still validating an overall bearish trend in the market.

AAPL LIVE PRICE ACTION JULY 23 2025This is the price action for AAPL. I have discussed indicators as well. Do not blindly trade without understanding the logics. I am long here with stocks only.
NOTE: DO NOT BLINDLY BUY

Apple (AAPL) — Expected 20% GrowthThe fundamental outlook for Apple stock remains positive: the upcoming fall presentation and anticipated AI-related announcements are driving bullish sentiment.
Technical picture:
The price has broken through a key trendline, signaling a shift in momentum toward growth.
Near-term target: a move toward the 225.0 level.
Next step: a possible pullback to 214.0 for a retest of the support level.
Long-term scenario: after the correction, I expect a rise toward 250.0, which could bring approximately 20% growth within 1–2 months.
This growth potential may coincide with Apple’s upcoming earnings report and further AI news.

AAPL next leg up?A daily close above 213.75 could set AAPL to move towards 220
We are retesting some strong resistance at 215, and above it we could see price moving faster to retest trendline.
Keeping this on the watch as ERs is not far and we can see a pre run
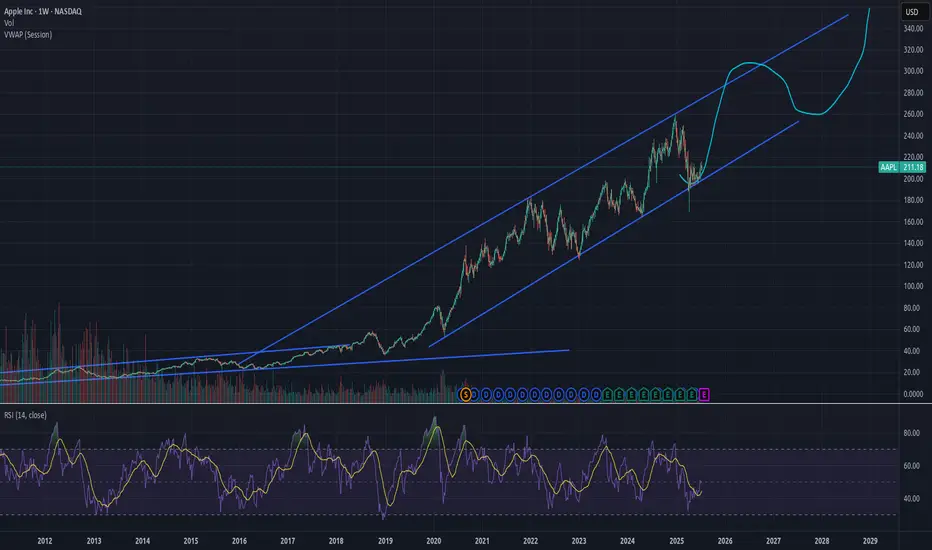
Aapl long ideaNASDAQ:AAPL is on trendline support from March 2020 and has made a nice reversal. It looks good for a swing trade through August or September.

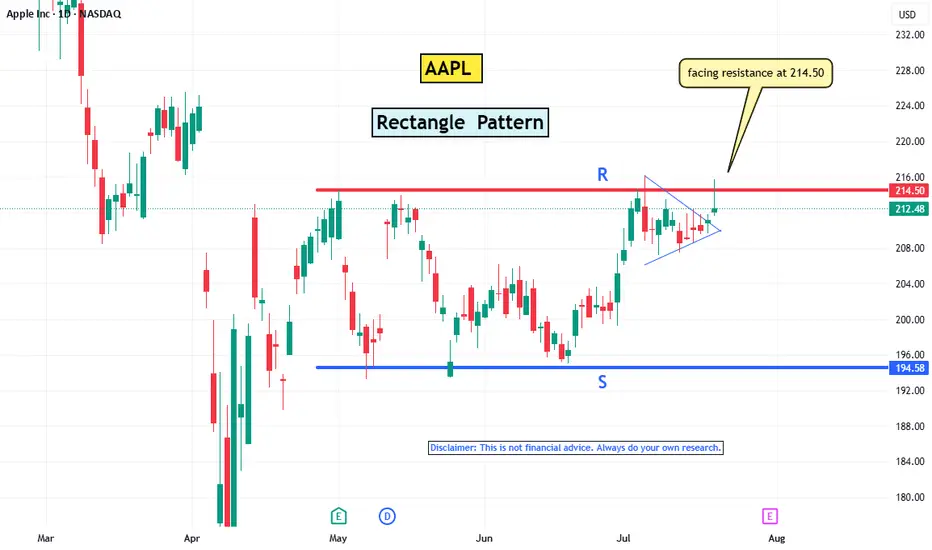
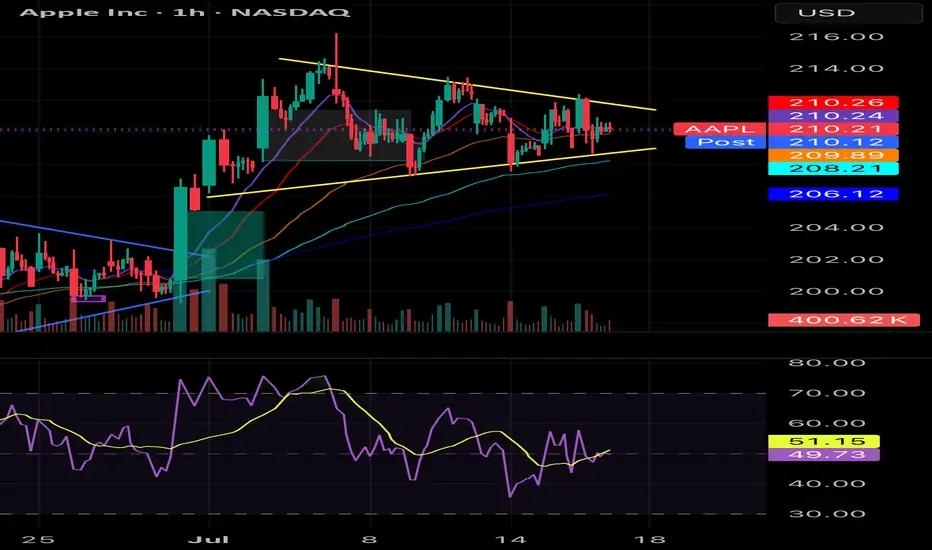
AAPL’s Pennant Breakout: Is $214.5 the Final Hurdle?Apple Inc. (AAPL) has been moving sideways since May, stuck in a tight trading range. It’s been following a classic rectangle pattern — showing that the market hasn’t quite made up its mind.
Today, AAPL finally broke out of a pennant pattern, giving traders a reason to look up. But the real test is still ahead: the stock is once again bumping into the $214.5 resistance level — the same spot where recent rallies have lost steam.
Apple’s P/E ratio is sitting at 33.2, which feels a bit stretched. That could explain why some investors are hesitating, waiting for stronger earnings or a new catalyst to justify higher prices.
If Apple can break above $214.5 with strong volume, it might kick off a new leg higher. Until then, the stock could keep drifting in this range. The breakout is promising — but not convincing just yet.
(Disclaimer : This is not financial advice. Always do your own research)
APPL DistributionI'm watching this potential apple distribuition for a while now. The demand below is not optimal, but if i see a BOS out of this supply i might give it a try.(a demand mitigation that leaves behing liquidity would be better)
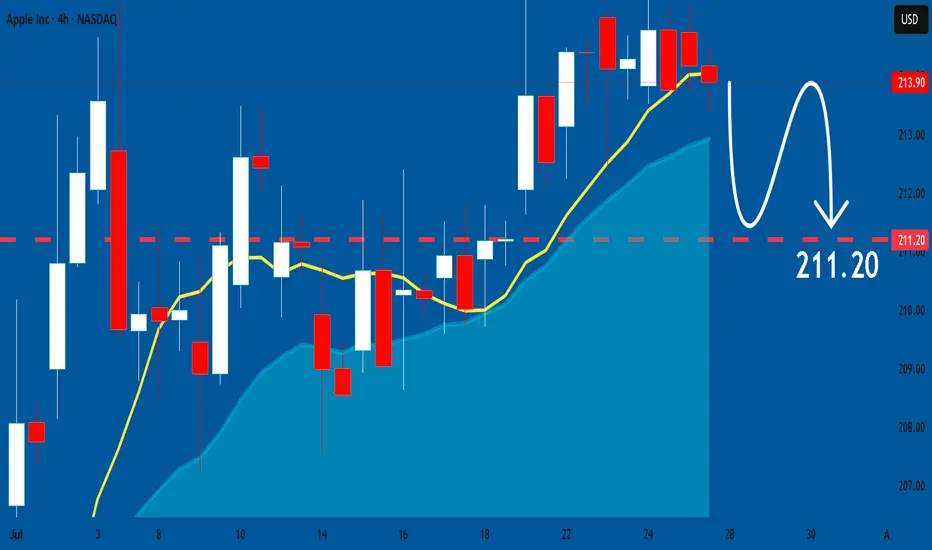
APPLE A Fall Expected! SELL!
My dear friends,
My technical analysis for APPLE is below:
The market is trading on 211.18 pivot level.
Bias - Bearish
Technical Indicators: Both Super Trend & Pivot HL indicate a highly probableBearish continuation.
Target - 205.87
Recommended Stop Loss - 213.80
About Used Indicators:
A pivot point is a technical analysis indicator, or calculations, used to determine the overall trend of the market over different time frames.
Disclosure: I am part of Trade Nation's Influencer program and receive a monthly fee for using their TradingView charts in my analysis.
———————————
WISH YOU ALL LUCK
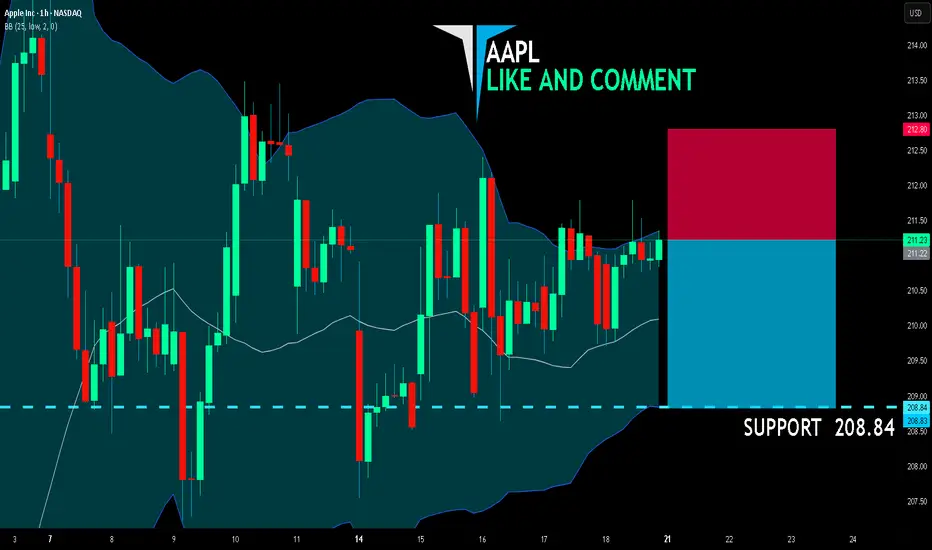
AAPL BEARS WILL DOMINATE THE MARKET|SHORT
AAPL SIGNAL
Trade Direction: short
Entry Level: 211.22
Target Level: 208.84
Stop Loss: 212.80
RISK PROFILE
Risk level: medium
Suggested risk: 1%
Timeframe: 1h
Disclosure: I am part of Trade Nation's Influencer program and receive a monthly fee for using their TradingView charts in my analysis.
✅LIKE AND COMMENT MY IDEAS✅
AAPL Set for a Breakout? | Technical Checklist & Projections
▍Observation & Context
▪ AAPL has been moving sideways within a clearly defined range for the past three months .
▪ On July 07 , price tested the range resistance decisively, showing some interest in the upside.
→ Let's first explore the bullish breakout scenario.
▍What Makes a Good Breakout ?
Before we talk about targets, let’s define what a good breakout looks like:
▪ A strong bullish candle breaking through the resistance in one clean move .
▪ Followed by a retest of the broken resistance (now acting as support).
▪ After that, price should ideally:
1. Form a higher low , and
2. Reach the next resistance or target zone before pulling back.
▍Target Price – Method 1: Extension of the Range
🔹 Near-Term Target: 1.5–1.618x Fibonacci Extension
- A common zone where momentum often pauses.
- Aligns with the previous high from the last downtrend.
- Technically, to reverse a trend, price needs to take out the previous high. Even though the range has “cooled off” the pressure, we still respect that level.
🔹 Ultimate Target: 2x Range Extension
- Represents a 100% projection of the previous range.
- Commonly used in range breakout targets.
🔹 Dream Target: 2.618x Fibonacci Extension
- Aligns with the start of the last downtrend , adding significance to the level.
- Often marks the exhaustion point of strong trends.
▍Target Price – Method 2: Projection from Higher Low
Note: The new higher low is not yet confirmed at the time of writing. The levels below assume an upward breakout without dropping below 207.22 . However, the same logic can be applied once the higher low forms.
🔹 Near-Term Target: Same as Method 1
🔹 Ultimate Target: 100% Projection of Prior Swing
- Projecting the prior swing (from previous low to recent high) from the new higher low .
- This level also aligns with the 1.5–1.618x Fibonacci extension of that swing, increasing its significance.
🔹 Dream Target: Another 100% projection
- Rare, but happens when momentum is very strong .
- In such cases, price might skip any retracement and launch directly into a second leg , equal to the previous swing.
- Here, the level aligns perfectly with the start of the last downtrend , just like the 2.618x extension in Method 1.
▋Mental Notes
▪ No one knows for sure if the breakout will be real or fake. But when it happens, knowing what to look for and where price might go next gives us a clear plan of action .
▪ The market will always find ways to surprise. Stay open and follow the flow.
▋Not Financial Advice
The information contained in this article is not intended as, and should not be understood as financial advice. You should take independent financial advice from a professional who is aware of the facts and circumstances of your individual situation.

The Crypto Market Shaken by USDe Collapse – What’s Next for BtcIn early July 2025, the crypto market was rocked by the sudden destabilization of one of the fastest-growing stablecoins — USDe by Ethena. In just a few days, the token lost over 10% of its value, dropping to $0.88. This triggered a wave of liquidations across DeFi protocols and a sharp decline in major crypto assets like Bitcoin and Ethereum.
Why USDe Collapsed
The main cause of the collapse was a weak collateral model. Unlike USDT and USDC, USDe lacked full fiat backing. Its reserves were partially based on derivatives and complex hedging strategies. When a few large wallets began withdrawing liquidity, panic spread quickly. The rush to exit USDe overwhelmed the system, breaking the $1 peg.
This led to an accelerated loss of trust and triggered cascading liquidations across multiple DeFi platforms.
Impact on DeFi and the Broader Market
DeFi was hit hard. The total value locked (TVL) across major protocols like Aave, Curve, and MakerDAO dropped by 17% in one week. Some platforms halted USDe-related activity to contain losses.
Bitcoin fell below $58,000, and Ethereum dropped under $3,000, driven not only by lower liquidity but also by renewed skepticism from institutional investors. The volatility in what was perceived as a “safe” asset reignited debates around the future of algorithmic stablecoins.
What Happens Next?
The fallout from USDe is a major stress test for the entire DeFi ecosystem. If the team behind Ethena fails to restore trust, other algorithmic stablecoins could come under pressure. There are already growing calls for greater transparency, independent audits, and stricter collateralization rules.
On the flip side, many see this as a healthy correction — a purge of undercollateralized, risky experiments. The long-term winners could be robust, transparent protocols, and Bitcoin, with its capped supply and increasing institutional demand, may once again be seen as a flight-to-safety asset.
AAPL BULLISH WEDGEApple previously wedged, and broke out into the 213s. I previously tracked it but didn't enter. As of recent the volume has been thinning and the PA has been consolidating. I believe Apple has potential to breakout once again. The EMAs are also in more of a bullish stack. Hoping to hit somewhere in the 218-230. From a technical standpoint looks good but watch for general market sentiment and other tech stocks / QQQ as many have claimed they're due for a pullback and I agree. If they move Apple moves. Nfa
Stocks SPOT ACCOUNT: APPLE stocks Buy Trade with Take ProfitStocks SPOT ACCOUNT:
MARKETSCOM:APPLE stocks my buy trade with take profit.
This is my SPOT Accounts for Stocks Portfolio.
Trade shows my Buying and Take Profit Level.
Spot account doesn't need SL because its stocks buying account.
Looks good Trade.
Disclaimer: only idea, not advice
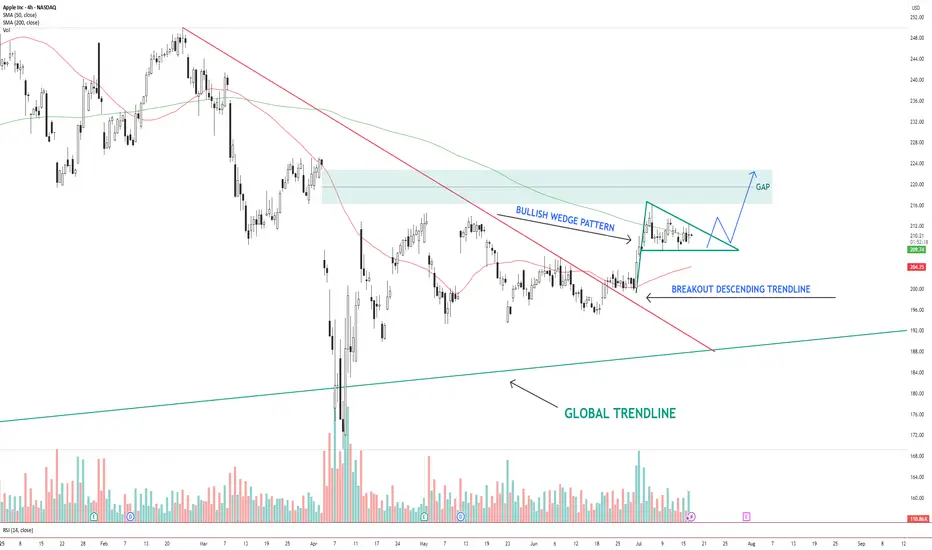
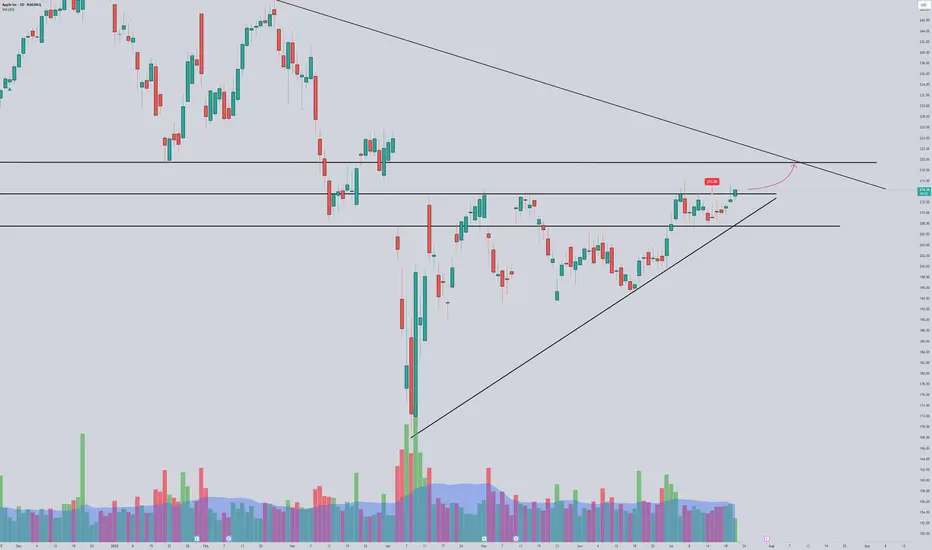
AAPL – Bullish Wedge Breakout Setup Toward Gap FillAAPL NASDAQ:AAPL has broken out of a descending trendline and is now consolidating inside a bullish wedge pattern . Price is holding above the 200 SMA and hovering near the 50 SMA.
The structure suggests a potential breakout above the wedge, with a clear gap area between $216–$224 acting as the next upside target.
Key levels:
Support: $206 (wedge base / 50 SMA)
Resistance: $216–$224 (gap zone)
Trend structure: Bullish consolidation after breakout
A clean breakout from the wedge with volume could trigger a continuation move toward the gap zone.
📌 Watching for confirmation and potential entry on a breakout + retest.
This is not financial advice. Always do your own research.