ICICI Bank: Is Another 30% Slide Around the Corner?The weekly chart of ICICI Bank reveals an intriguing historical pattern. Since 2008, the stock has experienced at least six significant corrections, each exceeding 30% from its peak. Despite its robust long-term uptrend, these periodic downturns highlight the cyclicality of market behavior and investor sentiment.
Key Observations from the Chart:
Historical Drawdowns:
The stock corrected 76.93% in 2008 during the global financial crisis.
Subsequent corrections were smaller but still significant, ranging from 25.93% to 54.05%.
The last substantial dip occurred in the COVID-19 market crash.
Current Sentiments:
The stock appears to be trading near its historical highs, but the overall market mood remains weak.
The Stochastic RSI is nearing the oversold zone, a signal that has often preceded sharp declines in the past.
The Macro Backdrop:
High Inflation: Persistently elevated inflation is eroding consumer spending and corporate margins.
Higher Interest Rates: Central banks worldwide are maintaining a tight monetary policy, which could hinder credit growth and profitability for banks.
Low Earnings Growth: ICICI Bank’s recent earnings have failed to excite the market, casting doubts on its ability to sustain high valuations.
FII Selling Pressure: Foreign Institutional Investors (FIIs) have been consistent net sellers, further weighing on the stock price.
Speculative Outlook:
Given the confluence of weak market sentiment, macroeconomic headwinds, and the stock's historical tendency to correct sharply after extended rallies, a potential 30% downside cannot be ruled out. The key support zones to watch are the 50-week moving average and the 200-week moving average, which have acted as reliable floors during previous corrections.
SIP Opportunity:
Should the stock break below its 50-week moving average, this could present a good opportunity for investors to accumulate shares in a SIP mode. The 50-week MA often acts as a psychological and technical support, and a breach could allow long-term investors to enter at attractive valuations.
Key Levels to Watch:
Immediate Support: ₹1,200-1,190 (50-week MA)
Deeper Support: ₹913-915 (200-week MA)
Conclusion:
While ICICI Bank remains a fundamentally strong player in the Indian banking space, the short-term outlook appears challenging. Traders and investors should brace for potential volatility and look for buying opportunities closer to historically significant support levels. SIP investors, in particular, can benefit from phased accumulation during corrections.
ICBA trade ideas

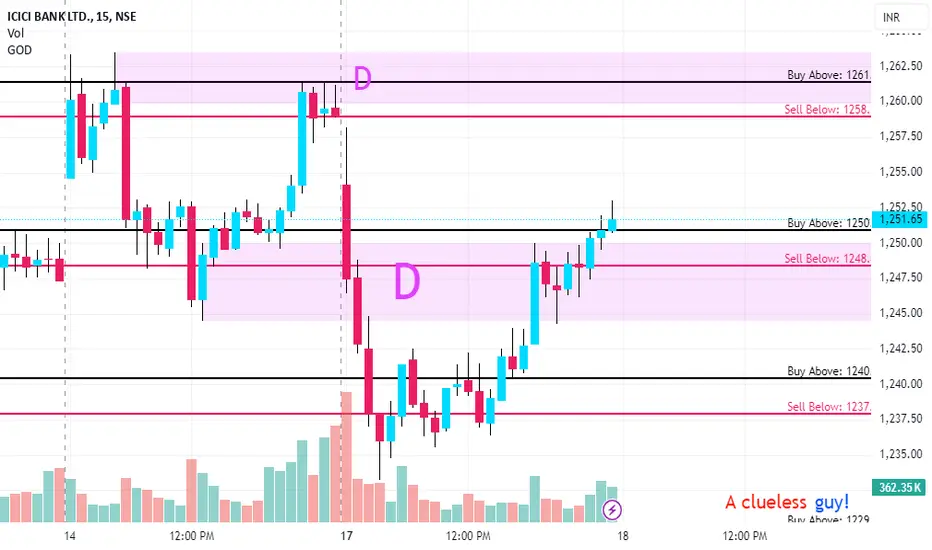
KEY LEVELS FOR 18/02/2025//description
// All credit goes to Tony for the concept of this indicator. His Trading View link: www.tradingview.com
// Note: The calculation method in this indicator differs from Tony's, but the concept is derived from his work.
I want to make it clear that I am not a seller, and this method was not taught to me by anyone. The original creator only gave me one clue:
👉 "If you get one level, you get all levels."
Everything else—the way I nail it the method and applied it—is my own work. I respect the original idea, but my approach is independent.
Explanation:
This trading system helps you avoid blind trades by providing confirmation for better entries and exits.
Entry/Exit Points:
- Entry/Exit Lines: Use the BLACK line for long trades and the RED line for short trades, based on confirmation from your trading plan.
- Stop Loss: For long trades, set the stop loss at the RED line below. For short trades, set it at the BLACK line above.
- Take Profit: For long trades, target the next RED line above. For short trades, target the next BLACK line below.
Timeframe:
Use a 5 mins timeframe for trading.
Risk Disclaimer:
This setup is for educational purposes. I'm not responsible for your gains or losses. Check the chart for more details.
ICICIBANK KEY LEVELS FOR 17/02/2025//description
// All credit goes to Tony for the concept of this indicator. His Trading View link: www.tradingview.com
// Note: The calculation method in this indicator differs from Tony's, but the concept is derived from his work.
I want to make it clear that I am not a seller, and this method was not taught to me by anyone. The original creator only gave me one clue:
👉 "If you get one level, you get all levels."
Everything else—the way I nail it the method and applied it—is my own work. I respect the original idea, but my approach is independent.
Explanation:
This trading system helps you avoid blind trades by providing confirmation for better entries and exits.
Entry/Exit Points:
- Entry/Exit Lines: Use the BLACK line for long trades and the RED line for short trades, based on confirmation from your trading plan.
- Stop Loss: For long trades, set the stop loss at the RED line below. For short trades, set it at the BLACK line above.
- Take Profit: For long trades, target the next RED line above. For short trades, target the next BLACK line below.
Timeframe:
Use a 5 mins timeframe for trading.
Risk Disclaimer:
This setup is for educational purposes. I'm not responsible for your gains or losses. Check the chart for more details.

ICICI BankMultiple Chart Pattern
1. Narrow Range Breakout
2. Pole Pattern
3. Double Bottom Pattern
RSI crossing 60 D /W
Monthly RSI Above 60


ICICIBANK KEY LEVELS FOR 03/02/2025**Explanation:**
This trading system helps you avoid blind trades by providing confirmation for better entries and exits.
**Entry/Exit Points:**
- **Entry/Exit Lines:** Use the BLACK line for long trades and the RED line for short trades, based on confirmation from your trading plan.
- **Stop Loss:** For long trades, set the stop loss at the RED line below. For short trades, set it at the BLACK line above.
- **Take Profit:** For long trades, target the next RED line above. For short trades, target the next BLACK line below.
**Timeframe:**
Use a 5 mins timeframe for trading.
**Risk Disclaimer:**
This setup is for educational purposes. I'm not responsible for your gains or losses. Check the chart for more details.

ICICI BANK | LONG | BTSTICICI BANK is reversing from the Lows and the Price action is showing clear Bullishness.
A BTST type trade is setting up for a Target to 1268 price level.
SL - Today's low.

ICICI Bank Breaks Resistance on Solid Earnings – What's Next...?ICICI Bank has seen a notable increase of approximately 2.5% following a robust quarterly performance that exceeded market expectations. The bank reported a significant net profit uptick of 15%, amounting to ₹11,792.4 crore, reflecting its strategic initiatives' effectiveness. Additionally, its net interest income (NII) soared to ₹20,370 crore, driven by a healthy growth in lending and a favorable interest rate environment.
In a complementary move, the Reserve Bank of India (RBI) has unveiled a measure to infuse ₹1.5 lakh crore in liquidity into the financial system. This action is aimed at enhancing the overall liquidity conditions in the market and supporting economic activity.
Technically, the stock has successfully broken free from a downtrend that has been in place since December. It is now approaching a critical resistance level, which could be a pivotal point for future price movements. Should the stock manage to break through this resistance and sustain that position for a day or two, it could signal a strong buying opportunity for investors looking to capitalize on potential upside momentum. Hence, investors may want to consider initiating a long position or executing a purchase if these conditions are met.

ICICI BANK SHORT TERM ANALYSISICICI Bank is looking interesting, and while it can fall up to levels of 1162-1080, which will make this stock extremely reasonable in the short term , however, if it crosses and sustains above 1260, it can give upside up to 1400-1440 in the short term.
NOT A BUY/SELL RECOMMENDATION.

ICICI BANK TRANDINGICICI BANK TRANDING
SUPPORT 1200,1170 RESISTANCE 1240,1250
ONLY EDUCATION PERPOSE
I icici bank same fall 15 rupee.

ICICIBANK KEY LEVELS FOR 23/01/2025**Explanation:**
This trading system helps you avoid blind trades by providing confirmation for better entries and exits.
**Entry/Exit Points:**
- **Entry/Exit Lines:** Use the BLACK line for long trades and the RED line for short trades, based on confirmation from your trading plan.
- **Stop Loss:** For long trades, set the stop loss at the RED line below. For short trades, set it at the BLACK line above.
- **Take Profit:** For long trades, target the next RED line above. For short trades, target the next BLACK line below.
**Timeframe:**
Use a 5 timeframe for trading.
**Risk Disclaimer:**
This setup is for educational purposes. I'm not responsible for your gains or losses. Check the chart for more details.

ICICI BANK LTD S/R for 20/1/25Support and Resistance Levels:
Support Levels: These are price points (green line/shade) where a downward trend may be halted due to a concentration of buying interest. Imagine them as a safety net where buyers step in, preventing further decline.
Resistance Levels: Conversely, resistance levels (red line/shade) are where upward trends might stall due to increased selling interest. They act like a ceiling where sellers come in to push prices down.
Breakouts:
Bullish Breakout: When the price moves above resistance, it often indicates strong buying interest and the potential for a continued uptrend. Traders may view this as a signal to buy or hold.
Bearish Breakout: When the price falls below support, it can signal strong selling interest and the potential for a continued downtrend. Traders might see this as a cue to sell or avoid buying.
MA Ribbon (EMA 20, EMA 50, EMA 100, EMA 200) :
Above EMA: If the stock price is above the EMA, it suggests a potential uptrend or bullish momentum.
Below EMA: If the stock price is below the EMA, it indicates a potential downtrend or bearish momentum.
Trendline: A trendline is a straight line drawn on a chart to represent the general direction of a data point set.
Uptrend Line: Drawn by connecting the lows in an upward trend. Indicates that the price is moving higher over time. Acts as a support level, where prices tend to bounce upward.
Downtrend Line: Drawn by connecting the highs in a downward trend. Indicates that the price is moving lower over time. It acts as a resistance level, where prices tend to drop.
Disclaimer:
I am not a SEBI registered. The information provided here is for learning purposes only and should not be interpreted as financial advice. Consider the broader market context and consult with a qualified financial advisor before making investment decisions.

ICICI BANK LTD (IBN) WEAKNESS COULD DRAG PRICE TO ITS MEAN!The price of IBN is now showing weakness, all that is left is a pullback above 29 followed by rejection...
N.B!
- IBN price might not follow the drawn lines . Actual price movements may likely differ from the forecast.
- Let emotions and sentiments work for you
- ALWAYS Use Proper Risk Management In Your Trades
#IBN
#NASDAQ
#SP500
#NYSE

ICICI Bank | Short | SwingIf ICICI Bank breaks the neck line of this Head and Shoulder Pattern on the hourly chart by the close of the first hour of todays trading, I anticipate that it will be testing levels of 1250 in the coming week.
Price has been clearly rejected from the Higher time frame pivots and this is an indication of weakness.
Needless to say, Bank Nifty view will also be in sync with ICICI Bank and HDFC Bank.
So positions can be built accordingly.

ICICIBANK (NSE) poised for upmove
Spot ICICI BANK (NSE) is at the bottom of the channel, testing 50DMA. The parallel channel, as illustrated, has been in play, for quite some time, with highs and lows fitting at multiple points.

ICICIBANK KEY LEVELS FOR 16/12/2024**Explanation:**
This trading system helps you avoid blind trades by providing confirmation for better entries and exits. It considers volume, past prices, price range and indiavix.
**Entry/Exit Points:**
- **Entry/Exit Lines:** Use the BLACK line for long trades and the RED line for short trades, based on confirmation from your trading plan.
- **Stop Loss:** For long trades, set the stop loss at the RED line below. For short trades, set it at the BLACK line above.
- **Take Profit:** For long trades, target the next RED line above. For short trades, target the next BLACK line below.
**Timeframe:**
Use a 5 timeframe for trading.
**Risk Disclaimer:**
This setup is for educational purposes. I'm not responsible for your gains or losses. Check the chart for more details.

ICICI BANK Swing TradeHello,
Trend-Based Analysis. Buy the Dips, Sell The Rallies, Also Following the Trend. Let's see where the Price Action takes us, Riding the wave. Potential trade setups based on trend momentum.
Technical analysis based on trend identification and momentum, Looking for high-probability setups within the prevailing trend.
Analyzing the current market trend and potential future price movement. Focusing on risk management and reward-to-risk ratios.
Details is Mentioned in Chart, Read carefully.. .

ICICIBANK KEY LEVELS FOR 12/12/2024//@description
// All credit goes to Tony for the concept of this indicator. His Trading View link: www.tradingview.com
// Note: The calculation method in this indicator differs from Tony's, but the concept is derived from his work.
**Explanation:**
This trading system helps you avoid blind trades by providing confirmation for better entries and exits. It considers volume, past prices, price range and indiavix.
**Entry/Exit Points:**
- **Entry/Exit Lines:** Use the BLACK line for long trades and the RED line for short trades, based on confirmation from your trading plan.
- **Stop Loss:** For long trades, set the stop loss at the RED line below. For short trades, set it at the BLACK line above.
- **Take Profit:** For long trades, target the next RED line above. For short trades, target the next BLACK line below.
**Timeframe:**
Use a 5 timeframe for trading.
**Risk Disclaimer:**
This setup is for educational purposes. I'm not responsible for your gains or losses. Check the chart for more details.

ICICIBANK !! Broke Trianlge Pattern on Monthly ChartICICIBANK !! Broke Trianlge Pattern on Monthly Chart
Along with that recently it made Bullish Engluf candle with good volume support. can be considered for swing trading with SL of 1200.

ICICI BANK long chart pattern Daily time frame
symetrical Triangle chart pattern
breakout.
Looking bullish

ICICIBANK 1D TFNSE:ICICIBANK has formed and is moving inside a triangular pattern. This can be traded on breakout
Disclaimer:- This analysis is only for educational purpose. Please always do your own analysis or consult with your financial advisor before taking any kind of trades

ICICI BANK S/R for 25/11/24Support and Resistance Levels:
Support Levels: These are price points (green line/shade) where a downward trend may be halted due to a concentration of buying interest. Imagine them as a safety net where buyers step in, preventing further decline.
Resistance Levels: Conversely, resistance levels (red line/shade) are where upward trends might stall due to increased selling interest. They act like a ceiling where sellers come in to push prices down.
Breakouts:
Bullish Breakout: When the price moves above resistance, it often indicates strong buying interest and the potential for a continued uptrend. Traders may view this as a signal to buy or hold.
Bearish Breakout: When the price falls below support, it can signal strong selling interest and the potential for a continued downtrend. Traders might see this as a cue to sell or avoid buying.
20 EMA (Exponential Moving Average):
Above 20 EMA(50 EMA): If the stock price is above the 20 EMA, it suggests a potential uptrend or bullish momentum.
Below 20 EMA: If the stock price is below the 20 EMA, it indicates a potential downtrend or bearish momentum.
Trendline: A trendline is a straight line drawn on a chart to represent the general direction of a data point set.
Uptrend Line: Drawn by connecting the lows in an upward trend. Indicates that the price is moving higher over time. Acts as a support level, where prices tend to bounce upward.
Downtrend Line: Drawn by connecting the highs in a downward trend. Indicates that the price is moving lower over time. It acts as a resistance level, where prices tend to drop.
RSI: RSI readings greater than the 70 level are overbought territory, and RSI readings lower than the 30 level are considered oversold territory.
Combining RSI with Support and Resistance:
Support Level: This is a price level where a stock tends to find buying interest, preventing it from falling further. If RSI is showing an oversold condition (below 30) and the price is near or at a strong support level, it could be a good buy signal.
Resistance Level: This is a price level where a stock tends to find selling interest, preventing it from rising further. If RSI is showing an overbought condition (above 70) and the price is near or at a strong resistance level, it could be a signal to sell or short the asset.
Disclaimer:
I am not a SEBI registered. The information provided here is for learning purposes only and should not be interpreted as financial advice. Consider the broader market context and consult with a qualified financial advisor before making investment decisions.

ICICI Bank Structure is Negative.We May see Clearly that ICICI Bank has broken its Parallel Channel and trading below.
We may See a Retest in ICICI Bank from 1250-1270 Levels and the we may see a Breakdown till 1170/1165 Levels.
SELL ICICI BANK @ 1250-1275
STOPLOSS @ 1300
TARGET @ 1170/1165
NOTE : This Levels is for Educational Purpose please take trade referring to your Financial Advisor.
HAVE A GOOD TRADING DAY.
