LARSON & TOUBRO cup and handle pattern Larson & toubro Cup and handle pattern
SL is on 2170
Entry is at 2195
Target is at 2260
technical analysis and is for educational purposes.
Like, Share, Comment for regular updates
Disclaimer
I am not sebi registered analyst My studies are Educational purpose only
Please consult with your Financial advisor before trading or investing
Larsen & Toubro Limited Shs Sponsored Global Depositary Receipt Repr 1 Sh Reg-S
No trades
LTO trade ideas

Bullish on LTSupport candle and confirmation candle on the day chart. Broke two day high and day high. SL 2107.50

May move in Consolidation or Below Zone Gratify if you appreciate the practice then you can like it, share it and
If you want me to investigate any chart for you then would cherish doing that for you.
Thank you for your time and support.
Stay safe.

LT Making head and shoulders patternLT Making head and shoulders pattern
LT - 2080 Level Break then start making head and shoulders pattern.
LT - 2080 level break then is come 2030 to 2035 level then it come up move 2080 to 20100 then again come down break 2035 level then its come to 1900 to 1880 level.

larsona and tourbo very good pattern if stay some time yellow mark going to big move to upper site wait for confermation and some time spent with trendline

L&T heading towards a Bear RunThings to note :
1. 2200 level has been tested multiple times (3 times) on the monthly chart, which is really a worrying factor.
2. Head and Shoulder pattern formation after the recent breakout.
Targets - 2000/1800/1600
Expecting to reach 1800 before the results.

L&T : Break the Head & Shoulder PatternL&T Stock on Daily TF has broken head & Shoulder Pattern on Friday with high volume. Stock moving upside with trend line support. Stock is strong momentum on long and short term.so stock can going upside and retest the previous high.
Entry : CMP
Sl : 2175
Upside Move : 2280

LT H&S pattern on D time frame LT making formation of H&S pattern on Daily time frame . Right side shoulder was till incomplete

LTLT broke out of triangle pattern on 30 min TF with decent volumes.
Could be bought with mentioned stoploss & target.


LT Long Opportunity Short Term Investment Opportunity
Best Golden Level 2158 to 2165.
Otherwise take quantity 50% 50% from given level.
Invest at your own risk.
Target Minimum 3% - 5%

L&T breakout on Day chartLT Chart is is on strong weekly support.
Entry: above 2215
Stop loss: 2300
Target : your R&R ratio
⚠️ Important: Always maintain your Risk & Reward Ratio.
⚠️ Purely technical based pick.
✅Like and follow to never miss a new idea!✅
Disclaimer: I am not SEBI Registered Advisor. My posts are purely for training and educational purposes. please consider it as a lerning
Eat🍜 Sleep😴 Job & swing Trade📈 Repeat🔁
Happy learning with Earning. Cheers!🥂

LT - Bullish Swing ReversalNSE: LT is closing with a bullish candle supported with volumes.
Today's volumes and candlestick formation indicates strong demand and stock should move to previous swing highs in the coming days.
The stock has been consolidating for the past few days which is indicating demand.
One can look for a 8% to 11% gain on deployed capital in this swing trade.
The view is to be discarded in the event of the stock breaking previous swing low.
#NSEindia #Trading #StockMarketindia #Tradingview #SwingTrade
Disclaimer:
This is for educational purposes only.
LT- Intraday Short PositionThe chart pattern and volume profile clearly show that it can give excellent risk-reward when it breaks down from the @2080 support zone. Price Action shows a downtrend and the volume profile adds more confirmation, So the possibility is more to go down till the @2060 area.
Entry Level:- Below @2080
StopLoss:- Above @2090
Target :- 1:1 or 1:2


inverse head & shoulder patternthis a inverse head and shoulder pattern in 1day time frame
stop loss is important in

LT chart any lays intraday LT chart any lays intraday
spot and resistance mark and mark a trend line
NSE:LT

lt at 52 week highA strong buy in range of 2260.
target 20% upside.
buy for short term target max holding for 2 months

LARSENLarsen & Toubro is in the verge of breaking out of triangle pattern with good volumes on hourly charts.
Could be bought here or on dips or above breakout level(2010) with mentioned stoploss & targets.

Big move possible LT and IT tocks are accumulated for a long time and there is a chance of good movement in all the stocks.

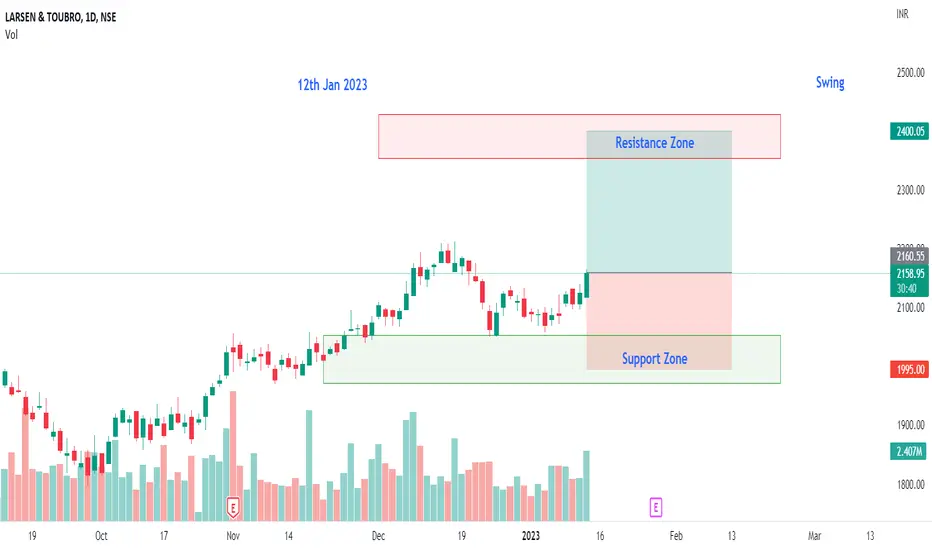
Larsen and tourbo 1 Day chart It is at all time high level but for me
Reistance zone 2060
support zone 1980

Larsen and Turbo Pole and flagLarsen adn turbo is forming a flag and pole pattern. If it breaks out of the flag patter it can achieve next target shown in the picture. Be watchful of the support arund 1980 and Look to be in a good shape.
