Microsoft: New Target Zone in PlaySince our last update, Microsoft shares have continued to decline, but there is still potential for an upside move. We do not yet consider the turquoise wave X to be complete. Once its high is established below the resistance at $562.17, we expect price to head lower toward the wave Y low. Our revised magenta long Target Zone is set between $477.87 and $451.84. The formation of this low should also mark the completion of magenta wave (4). Afterward, we anticipate the start of a new upward impulse within wave (5), which should push the stock above the $562.17 resistance and complete the larger blue wave (I). Alternatively, we assign a 36% probability to a scenario in which the recent high at $562.17 marked the end of beige wave alt.III . In this case, a decline below the support at $392.97 would be expected, forming the low of wave alt.IV .
Microsoft Corporation Shs -CAD hedged- Canadian Depositary Receipt Repr Shs Reg S
No trades
Trade ideas

MSFT – Key Compression Zone Before Earnings for Oct. 21-25MSFT – Key Compression Zone Before Earnings: Bulls Defending $510 Support ⚡️
🟩 Daily Timeframe – Macro Market Structure
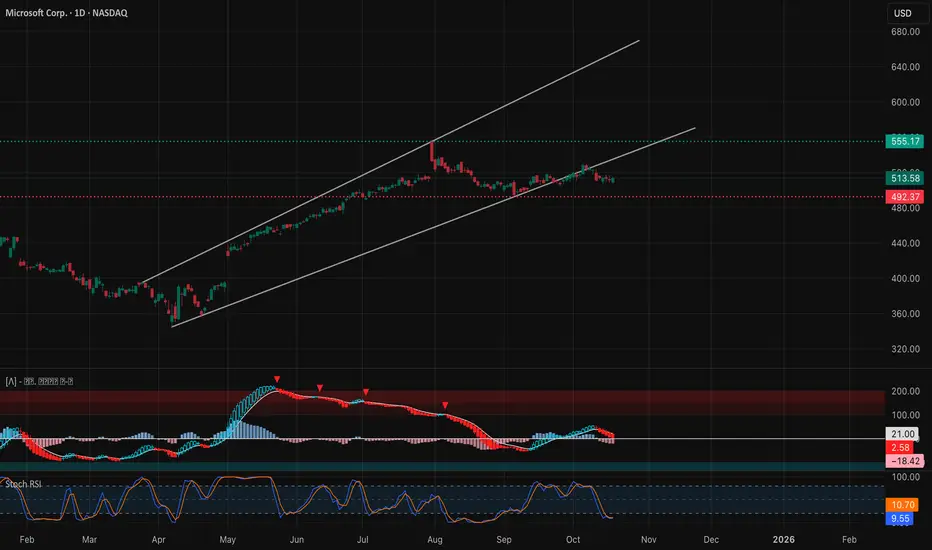
Microsoft’s daily chart remains technically bullish in the larger structure but has clearly lost short-term momentum after peaking in late September. Price is now hovering near the lower boundary of its ascending channel, testing the $510 zone — a crucial level for trend continuation.
The ascending channel from early 2024 remains intact, but a break below $507–$505 could trigger a deeper retracement toward the next structural demand zone around $492–$495. On the other hand, a clean bounce from this area could reestablish upside momentum back to $535–$555, aligning with the upper channel resistance.
MACD remains weak with histogram bars printing below the zero line, showing fading bullish energy. Meanwhile, the Stoch RSI is deeply oversold — signaling that momentum is stretched to the downside and a short-term bounce could soon emerge.
This is a make-or-break zone for bulls: defend $510, and we likely see a mean reversion push higher; lose it, and bears gain control toward $495.
🟦 1-Hour Timeframe – Short-Term Trend and Liquidity Shifts
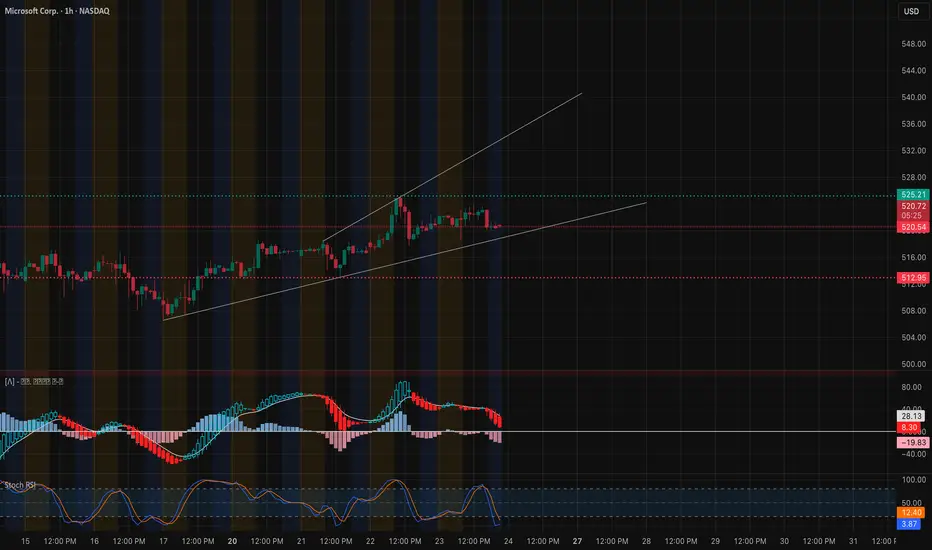
The 1-hour chart reveals a tactical CHoCH → BOS sequence, suggesting buyers are trying to rebuild structure from the intraday low near $504. Price reclaimed minor structure with a BOS at $511, now holding within the $514–$517 resistance box — an area where liquidity previously flipped.
Key observations:
* CHoCH at $504 followed by BOS above $511, signaling short-term bullish intent.
* 9 EMA crossing above 21 EMA — slope slightly upward, confirming near-term bullish pressure.
* MACD histogram turning positive, showing momentum recovering after a multi-day decline.
* RSI hovering near mid-50s — balanced, with room to expand higher.
For Monday–Tuesday, $511.5–$512 remains the key pivot. If price sustains above it with volume, next upside magnet sits at $517–$520. Failure there likely invites another retest toward $507 support.
🟨 15-Minute Timeframe – Intraday Playbook and Micro Structure
The 15-minute chart captures microstructure perfectly. Multiple CHoCH → BOS patterns have appeared within a rising intraday wedge from $506 → $516. This shows strong liquidity cycling between these levels — smart money likely rotating positions around the $514–$515 supply block.
Current setup:
* The latest BOS pushed price into $516.5, but a CHoCH printed immediately after, hinting at short-term exhaustion.
* Price is now compressing between $511.5 (support) and $516 (resistance) — forming a tight scalp zone.
* MACD on the 15-min is fading, showing weaker follow-through after the morning push.
* Stoch RSI curling down from overbought, suggesting intraday pullback risk before any further upside attempt.
If price breaks above $516.8, momentum could accelerate toward $520–$522. Otherwise, expect a short-term dip to $511 before bulls reattempt another leg higher.
🟥 GEX (Gamma Exposure) & Options Sentiment – Dealer Positioning Map
The GEX map gives a clear picture of the current battleground:
* Highest positive gamma / call resistance: $520–$528, where dealers will likely sell into rallies.
* Highest negative gamma / put support: $510, aligning perfectly with the structural support on your daily and 1H charts.
* Large call walls: $525–$535, indicating upside friction where hedging could mute rallies.
* Put walls: $495–$490, aligning with the downside liquidity zone.
* Max Pain: near $510, meaning price may stay magnetized to this level early in the week.
Implied volatility is stable — IVR 34.2 and IVx average 29.9, signaling that options markets are not pricing extreme movement yet. This supports a range-trading bias early week, likely between $510–$520 before volatility expands later.
Dealers currently hold slightly positive gamma, meaning dips will attract buy hedging and limit deep selloffs. If price breaks above $520, gamma flips bearish — expect volatility expansion as dealers hedge short deltas.
🎯 Trade Scenarios
Bullish Setup 🟢
* Entry: Above $516.5–$517 after confirmation candle.
* Target: $520 → $525.
* Stop-loss: Below $511 (or trailing under EMA crossover).
* Confluence: MACD expansion and RSI > 60 on 15M and 1H.
Bearish Setup 🔴
* Entry: On rejection from $517–$520 or breakdown below $511.
* Target: $507 → $495.
* Stop-loss: Above $521.5.
* Confluence: MACD histogram turning negative + RSI < 45.
🧭 Closing Outlook – Week of Oct 21–25
Microsoft is entering a tight volatility pocket where dealer gamma, structural support, and macro channel boundaries converge near $510–$520. This is a coiling phase — ideal for traders who wait for directional confirmation.
If bulls defend $510 and push above $520, it could trigger a controlled gamma squeeze toward $528–$535. But failure to reclaim $517 early week keeps the chart in a chop zone, risking a slow drift back to $505 support.
I’m watching for false liquidity sweeps near $511–$512, which could trap bears before a sharp reversal higher. The reaction to this level will likely define MSFT’s tone for the rest of the week.
Disclaimer:
This analysis is for educational purposes only and does not constitute financial advice. Always do your own research and manage risk appropriately.
MSFT Tightening Into Friday — (Oct. 24 Outlook)Watching $520 Support and $525 Breakout Zone ⚙️
1. Market Structure (1H & 15M)
Microsoft (MSFT) continues to respect a rising structure but is now entering a compression phase under a strong resistance shelf near $525. On the 1-hour chart, the trend remains intact above the ascending trendline that started around $510. Recent CHoCH and BOS rotations highlight a healthy bullish structure, but the candles show indecision as the price tightens between $518–$523.
On the 15-minute chart, MSFT is consolidating inside a symmetrical triangle — a pattern that often precedes expansion. Price made a small CHoCH near $518 but quickly reclaimed $520, showing bulls are still defending short-term structure. The market’s behavior suggests buyers are absorbing dips, though momentum is cooling slightly before a potential Friday decision move.
2. Supply and Demand / Order Blocks
* Demand Zone (Support): $512–$515 — strong institutional footprint and previous BOS area. This zone also aligns with the HVL (high-volume level) and should act as the main support to watch.
* Near-Term Demand: $518–$519 — local demand zone where the 1H trendline intersects.
* Supply Zone (Resistance): $523–$526 — overlapping BOS top and GEX call wall region. A clean break and hold above this would confirm bullish continuation toward $530+.
Overall structure suggests that MSFT is in mid-cycle consolidation. Bulls need to push through $525 to regain dominance, while bears will likely press if $518 fails.
3. Indicator Confluence
* 9 EMA / 21 EMA: On both 1H and 15M charts, MSFT is hugging the EMAs closely. The 9 EMA is flattening slightly, signaling equilibrium. A crossover back upward on the 15M could kick off a premarket breakout if volume returns.
* MACD: The 1H MACD is currently cooling off after an extended bullish run — histogram fading, but the fast line remains above zero, meaning trend momentum is intact. On the 15M, MACD is near reset, suggesting potential for a new impulse wave if buyers regain control.
* RSI: The 1H RSI sits around 52 — neutral and balanced, reflecting the compression. The 15M RSI near 45 shows a short-term cooldown phase, but not yet oversold.
* Volume: Volume has declined during this consolidation, a typical pre-breakout setup where traders await confirmation.
4. GEX (Gamma Exposure) & Options Sentiment
The GEX chart reveals a crucial battle between $510 (put support) and $525 (call resistance). The highest positive gamma concentration sits around $523–$525, forming the main resistance zone. Above this, open gamma levels thin out until $530+, suggesting a quick acceleration could follow if that level breaks.
Below, PUT support clusters at $510–$512, acting as a strong floor. This gamma structure aligns perfectly with the technical zones, making $518–$525 the key range where dealer hedging and price magnetization are likely strongest.
IVR at 29.1 and IVX avg 30.9 (-0.37%) indicate compressed volatility, again pointing toward an upcoming expansion move. Options flow leans 20.4% CALLS, which is moderate and reflects traders waiting for confirmation before loading on one side.
A breakout through $525 could trigger hedging flow toward $530–$535, while failure to hold $518 could send price to retest the $512–$510 support band.
5. Trade Scenarios for Friday, Oct. 24
Bullish Setup 🟩
* Entry Zone: $518–$520 retest or breakout above $523.8
* Targets: $526 → $530 → $535
* Stop-Loss: Below $516.5
* Confirmation: Hold above 9 EMA on 15M, MACD green crossover, RSI > 55
Bearish Setup 🟥
* Entry Zone: Rejection from $523–$525 or breakdown under $518
* Targets: $515 → $512 → $510
* Stop-Loss: Above $525.8
* Confirmation: CHoCH + MACD crossdown + RSI < 45
6. Closing Outlook for Oct. 24 (Friday)
Friday’s setup for MSFT is balanced but primed for breakout. The chart structure, EMAs, and gamma data all point to tight compression between $518 and $525 — a range that will likely resolve directionally before next week’s earnings-driven volatility window.
If bulls push through $525, momentum could accelerate quickly toward $530–$535 fueled by gamma shifts and short-term call delta hedging. Conversely, a failure to defend $518 may bring a controlled retest of $512–$510, where fresh liquidity likely sits.
My personal bias: MSFT remains constructive, with the larger structure favoring an eventual breakout to the upside — but only if $518 holds firm overnight.
💬 Final Thought:
“MSFT is tightening between $518 and $525 — this is a coiled spring setup. A breakout above $525 could rip through $530 fast, while $518 remains the critical line for bulls to defend.”
This analysis is for educational purposes only and not financial advice. Always do your own research and manage your risk before trading.
Microsoft (MSFT) — The Titan at a Tipping Point! Can Bulls Defend $510 or Will Bears Take Over?
🧭 Weekly Chart — Macro Structure & Trend Direction
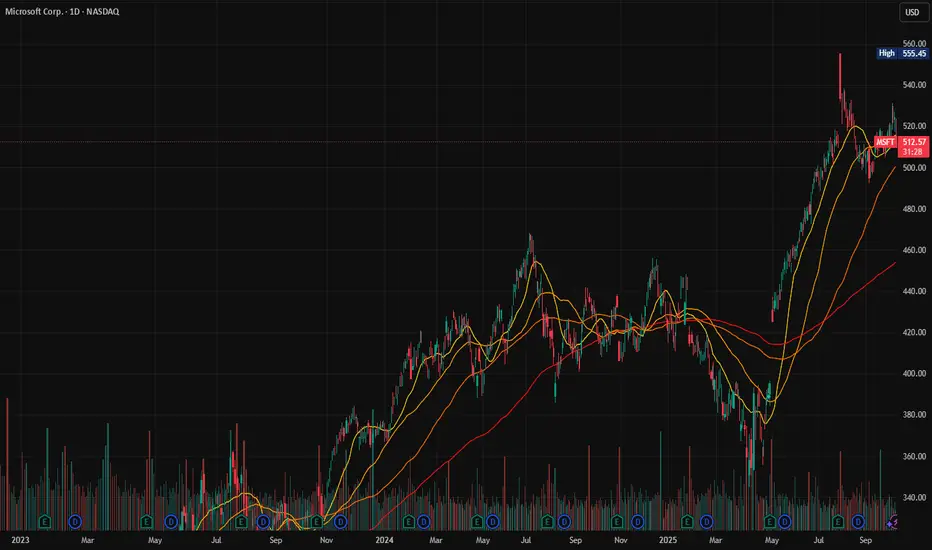
MSFT’s weekly structure shows a clean bullish trend since its March 2024 low, but now, that momentum is showing cracks. The chart reveals a CHoCH (Change of Character) just below the previous BOS (Break of Structure), hinting that buyers are losing control after an extended rally.
The price currently hovers around $513, just above the critical demand zone near $506–$510, which also aligns with the 21 EMA.
* A weekly close below $506 would confirm a short-term distribution phase, opening the door for a pullback toward $490–$492, the next major liquidity zone.
* Conversely, if bulls defend $510 and reclaim $530, that would reestablish bullish dominance, likely driving MSFT back toward the upper channel resistance around $555–$560.
The MACD histogram has started rolling over from its peak while remaining above zero — a warning of slowing momentum. Meanwhile, Stoch RSI is dipping from mid-levels (24.84) toward oversold territory, suggesting potential for a rebound if buyers step in soon.
Weekly Outlook: Consolidation inside an uptrend. Bulls must defend $506–$510 or risk losing medium-term control.
⚙️ Daily Chart — Short to Mid-Term Setup
On the daily chart, MSFT has shifted into a pullback structure inside an ascending channel. The recent CHoCH and BOS combo below $530 confirms a transition from expansion to correction mode.
Price is retesting a short-term support zone between $510 and $512, coinciding with the lower band of the trend channel.
* Bullish case: If $510 holds and price breaks back above $518–$520, expect a push toward $525–$530 (previous imbalance and minor GEX wall).
* Bearish case: Failure to hold $510 could trigger a correction toward $492–$495, a key discount zone and historical order block (OB) from May 2024.
The MACD has crossed down but is starting to flatten, while Stoch RSI is nearing oversold — a signal that bears may soon exhaust short-term momentum.
Daily Bias: Neutral to slightly bearish until $518 is reclaimed. Watch for structure change confirmation before taking any swing position.
🧩 1-Hour Chart — Intraday Trading Plan
The 1-hour structure shows multiple CHoCH + BOS flips, confirming an intraday range forming between $505 and $520. Price is now stabilizing around $513, showing a minor bullish divergence on MACD and RSI.
The short-term downtrend line is being tested, and the structure suggests a possible inverted head and shoulders forming if $510 holds.
* Trading Plan:
* Bullish entry: Above $514–$515 with target at $520.5 → $525. Keep a tight stop at $510.5.
* Bearish entry: Below $510 confirmation → target $505 → $500 PUT support wall from GEX data.
* Stoch RSI on this timeframe is bouncing off oversold levels, showing early buyer strength.
Short-term Bias: Sideways-to-bullish. The fight for $510 is everything. A break in either direction will set the tone for the week.
💥 Options GEX & Institutional Sentiment
From the Options GEX snapshot:
* Highest positive GEX (Call Wall): $520 — this is the “magnet” if bulls push above $515.
* Secondary resistance: $525 and $530, where 82.8% of open interest sits (potential squeeze zone).
* Strong PUT Wall / Support: $505 with –82.7% GEX — market makers hedging downside.
* IVR 35.2 / IVx 29.9 → relatively low volatility, making debit spreads or directional options attractive right now.
Gamma Outlook: Market makers are pinned around $510–$515. A clean break above $515 could trigger a gamma unwind toward $525+. Below $505, expect fast momentum as delta hedging flips negative.
🎯 Option Strategy Suggestions
1️⃣ Bullish Breakout Setup:
* Buy $515C / Sell $525C (Oct 25 expiry) — debit spread to capture upside to $525 with limited risk.
* Alternative scalp: Buy 0DTE/1DTE $515 Calls on breakout >$514.5, take profit at $519–$520.
2️⃣ Bearish Hedge:
* If $510 breaks, Buy $510P / Sell $500P (Oct 18 expiry) for downside capture with defined risk.
3️⃣ Neutral Play (Iron Condor):
* If expecting chop between $505–$525 → Sell $525C / $530C and $505P / $500P to collect premium.
💬 Final Thoughts
Microsoft remains a blue-chip giant in a holding pattern, waiting for the next catalyst. Bulls are still in control on the higher timeframe, but short-term correction risk is real. $510 is the key inflection level this week — lose it, and a slide toward $492 could follow. Regain $520+, and we’re back in bullish expansion mode.
My TA has been proven high win-rate, so if you’ve been following, you know the precision. You can check my past chart history for consistency.
If there’s a stock I haven’t covered that you want me to break down, DM me — I’ll be happy to TA it for you.
This analysis is for educational purposes only and does not constitute financial advice. Always do your own research and manage your risk before trading.

$MSFT Call Alert – Oct 31 ’25 $515 Calls | 125% ROI PotentialEnter: NASDAQ:MSFT OCT 31 2025 $515 CALLS
Buy in Price: $16.89 - $17.00
Take Profit: $38.00
Stop Bleeding: $14.86
ROI Potential: 125%
Exit Within: 160 Minutes
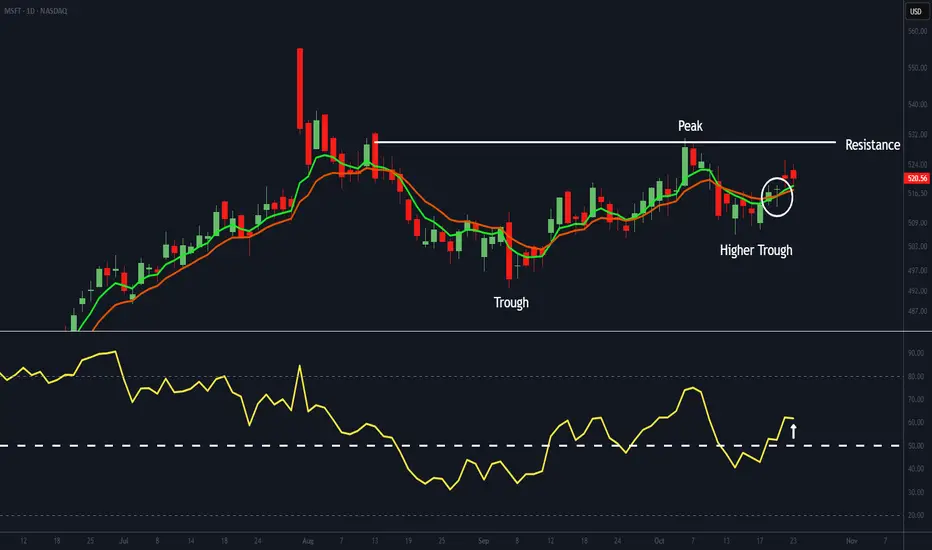
Microsoft’s Higher Trough Hints at a Bullish LegWe believe Microsoft (MSFT) has formed a higher trough - a bullish sign. Its EMAs have crossed positively, and the RSI has moved above 50, signalling improving momentum. If the RSI holds above that level, it will confirm a strengthening trend that could see MSFT challenge resistance near $530.
The company reports next Wednesday after the close, with investor attention centred on Azure and Copilot - the pillars of its AI strategy. Copilot, now embedded across Microsoft 365, Teams, and Outlook, is gaining strong enterprise adoption; for instance, Barclays recently expanded its licences from 15,000 to 100,000. The AI assistant could generate billions in recurring revenue, while Azure - which grew 39% year-on-year last quarter, its fastest pace in three years - remains the primary growth driver. Sustained progress in both areas will be crucial for maintaining investor confidence.
Although momentum has yet to reach full strength for a decisive breakout, it is clearly building. Next week’s earnings could provide the catalyst needed to push it over that threshold.
MSFT - heading to support in the 340$ areaA very simple chart, just a channel and monthly MACD.
Like some other tech stocks the ATH was in July 2024 and price seems to be heading to the lower trend line. If it does, the entire market will go down further as well.
So keeping an eye on the monthly charts of big tech is important.
The MACD (standard settings) of AAPL, GOOGL and NVDA is about to cross into "sell".

Commodity Supercycle: Concept, Causes, and Global ImpactIntroduction
Commodities—such as oil, metals, agricultural products, and minerals—are the backbone of the global economy. They serve as essential inputs for industrial production, infrastructure development, and everyday consumption. However, unlike ordinary price fluctuations driven by short-term supply and demand changes, commodities sometimes experience prolonged periods of price booms and busts. These extended phases, often lasting decades, are known as commodity supercycles.
A commodity supercycle is a long-term trend during which prices of a wide range of commodities rise significantly above their long-term average, followed by a prolonged period of decline. These cycles are usually driven by massive structural shifts in the global economy—such as industrial revolutions, urbanization waves, technological breakthroughs, or geopolitical transformations—that create sustained demand for raw materials.
This essay explores the concept, historical examples, causes, consequences, and future outlook of commodity supercycles, highlighting their importance in shaping global economic trends.
1. Understanding the Concept of a Commodity Supercycle
A commodity supercycle is different from a normal business cycle or short-term commodity price movement. While a normal price cycle might last 2–8 years, a supercycle can extend for 20 to 40 years, characterized by long periods of rising and falling prices across multiple commodities.
In a typical supercycle:
The expansion phase witnesses strong global growth, industrialization, and urbanization, leading to increased demand for raw materials.
The peak phase occurs when demand and prices hit unsustainable highs.
The contraction phase begins when supply eventually catches up, and global economic growth slows.
The trough or bottom phase marks a prolonged period of low prices before the next upturn.
Supercycles involve broad-based commodity categories—such as energy (oil, gas, coal), metals (iron, copper, aluminum), and agricultural products (wheat, soybeans, corn). They are not limited to any single market but affect the entire global commodity complex.
2. Historical Commodity Supercycles
Economic historians have identified several commodity supercycles since the 19th century. Each was tied to a major transformation in industrial or technological development.
(a) The Industrial Revolution Supercycle (Late 19th Century)
The first recognized commodity supercycle occurred during the Industrial Revolution (1850s–1910s). Massive industrialization in Europe and the United States fueled unprecedented demand for coal, steel, iron, and agricultural goods. Urbanization and rail expansion intensified consumption, causing prices to rise across many commodities. However, as global production capacity expanded and industrial growth stabilized, prices eventually corrected.
(b) Post–World War II Supercycle (1940s–1970s)
The post-WWII reconstruction era marked another commodity boom. Rebuilding Europe and Japan required huge imports of oil, steel, and cement. The United States emerged as the dominant economic power, while infrastructure development surged worldwide. The 1950s and 1960s saw strong demand growth, but the 1970s oil crises and subsequent recessions ended the boom. By the late 1970s, high prices and energy shocks led to inflation, and the supercycle transitioned into a downturn.
(c) China-Led Supercycle (1998–2014)
The most significant modern supercycle began around the late 1990s, driven primarily by China’s rapid industrialization and urbanization. China’s entry into the World Trade Organization (WTO) in 2001 opened a new era of global trade and manufacturing. Massive infrastructure investment created immense demand for copper, iron ore, coal, and oil. Commodity exporters such as Brazil, Australia, and Russia benefited greatly.
By 2008, commodity prices had surged to record highs. Even after the global financial crisis, stimulus spending by China kept demand elevated until around 2014, when slowing Chinese growth and oversupply caused prices to collapse.
(d) Potential Green Energy Supercycle (2020s–2030s)
Many economists and analysts believe the world is currently at the beginning of a new commodity supercycle, this time driven by the global energy transition. The shift toward renewable energy, electric vehicles, and green technologies has increased demand for critical minerals such as lithium, cobalt, nickel, and copper. Simultaneously, supply constraints caused by underinvestment in mining and geopolitical tensions could sustain high prices in the years ahead.
3. Key Drivers of Commodity Supercycles
Commodity supercycles do not arise from random price surges. They are shaped by long-term macroeconomic and structural factors. The main drivers include:
(a) Industrialization and Urbanization
When countries undergo rapid industrialization, they require massive amounts of steel, cement, energy, and food to build infrastructure and support urban populations. Historical examples include the U.S. in the early 20th century and China in the early 21st century. Industrialization thus plays a central role in fueling supercycles.
(b) Technological and Structural Shifts
Major technological changes—such as the rise of automobiles, electrification, and digital industries—can increase the demand for specific commodities. For example, the current green energy revolution has boosted demand for battery metals and rare earth elements.
(c) Population Growth and Income Expansion
Rising populations and improving living standards in developing countries expand global consumption of food, energy, and consumer goods, increasing demand for base commodities.
(d) Supply Constraints and Resource Depletion
Unlike manufactured goods, commodities often face long lead times for production expansion. Opening new mines, oil wells, or farms takes years. When demand surges suddenly, supply cannot adjust immediately, pushing prices higher for extended periods.
(e) Global Monetary and Fiscal Policies
Periods of economic expansion often coincide with easy monetary policies, low interest rates, and high government spending—all of which can increase liquidity in commodity markets. Conversely, tighter monetary policies can end supercycles by reducing investment and consumption.
(f) Geopolitical Events
Wars, trade restrictions, sanctions, or political instability can disrupt supply chains and reduce production, contributing to higher prices. For instance, the Russia-Ukraine conflict in 2022 led to sharp increases in oil, gas, and grain prices.
4. Economic and Financial Implications of a Supercycle
Commodity supercycles have profound effects on the global economy, influencing everything from inflation to international relations.
(a) Impact on Commodity Exporters and Importers
Exporting nations (e.g., Australia, Brazil, Russia, Saudi Arabia) experience economic booms during commodity upswings, benefiting from higher revenues, employment, and foreign investment.
Importing nations (e.g., India, Japan, European countries) face inflationary pressures, higher production costs, and trade imbalances during the same periods.
(b) Inflation and Monetary Policy
Rising commodity prices contribute to cost-push inflation, prompting central banks to raise interest rates to stabilize prices. Conversely, when a supercycle ends and prices fall, deflationary pressures may emerge.
(c) Currency Movements
Commodity booms often strengthen the currencies of exporting countries, such as the Australian Dollar or Canadian Dollar, while weakening those of importers. This can alter global trade competitiveness.
(d) Investment and Speculation
Commodity supercycles attract speculative investment in commodity futures, mining stocks, and energy companies. During the 2000s, for example, institutional investors poured billions into commodity index funds, amplifying price trends.
(e) Environmental and Social Impacts
Sustained resource extraction can lead to deforestation, pollution, and social conflict in resource-rich regions. Balancing economic growth with environmental sustainability becomes a major policy challenge during a supercycle.
5. Indicators of an Emerging Supercycle
Economists monitor several indicators to identify potential supercycles:
Broad-based price increases across multiple commodities (not just one or two).
Structural demand shifts tied to technological or demographic changes.
Persistent supply bottlenecks due to underinvestment or geopolitical issues.
Rising capital expenditure in mining and energy sectors.
Global economic expansion led by industrial and infrastructure growth.
For example, from 2020 onward, prices of copper, lithium, nickel, and aluminum surged simultaneously—signaling early signs of a possible green-energy supercycle.
6. Challenges and Limitations
Despite their transformative impact, commodity supercycles are difficult to predict and manage.
(a) Volatility and Uncertainty
Commodity markets are extremely volatile. Unexpected events such as pandemics, wars, or policy shifts can reverse price trends abruptly.
(b) Overinvestment During Booms
High prices often encourage excessive investment in new capacity, leading to oversupply when demand slows—causing sharp downturns.
(c) Dependence on Global Growth
A supercycle depends heavily on sustained global economic growth. If major economies face recessions, commodity demand weakens rapidly.
(d) Environmental Transition Risks
While the green transition may drive a new supercycle, it also risks phasing out fossil fuels—potentially creating losses for countries and companies heavily invested in oil and coal.
7. The Future Outlook: Are We in a New Supercycle?
Analysts are divided on whether the world is entering a new commodity supercycle in the 2020s. Arguments for and against include:
In Favor:
Energy transition toward renewable technologies is boosting long-term demand for metals like copper, lithium, and nickel.
Underinvestment in mining and fossil fuel production over the past decade has constrained supply.
Geopolitical fragmentation is leading to supply chain disruptions and resource nationalism.
Fiscal stimulus and infrastructure spending in the U.S., India, and developing economies are supporting commodity demand.
Against:
Slowing global growth and technological efficiency may reduce long-term demand.
Recycling and circular economy models could limit raw material consumption.
Monetary tightening and higher interest rates could reduce speculative inflows.
Nevertheless, many experts believe the green transition and geopolitical realignments will sustain elevated commodity prices for the foreseeable future, marking the beginning of a structural uptrend akin to previous supercycles.
8. Conclusion
The concept of a commodity supercycle captures one of the most powerful long-term forces shaping global economic history. From the Industrial Revolution to China’s rise and the ongoing green energy transition, supercycles reflect humanity’s evolving relationship with natural resources.
Each supercycle brings both opportunities and challenges. For resource-rich nations, it offers economic prosperity and global influence. For import-dependent economies, it poses inflationary risks and policy dilemmas. Ultimately, the sustainability of future supercycles will depend on how effectively the world balances economic growth, resource management, and environmental responsibility.
As the 21st century progresses, the next commodity supercycle—driven by the energy transition, digitalization, and global reindustrialization—may redefine the global economy once again, just as its predecessors did in centuries past.
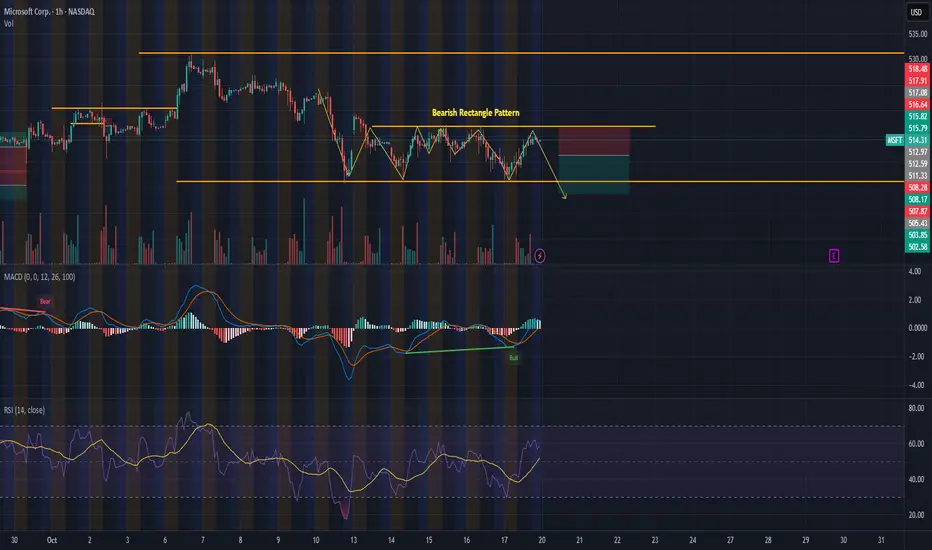
10/19/20215 - MSFT Stock - Pre Market Analysis10/19/20215 - MSFT Stock - Pre Market Analysis
Showing signs of Bearish Rectangle Pattern. Resistance and Support marked out, indicators RSI and MACD to show momentum is heading downward. Short MSFT temporarily.
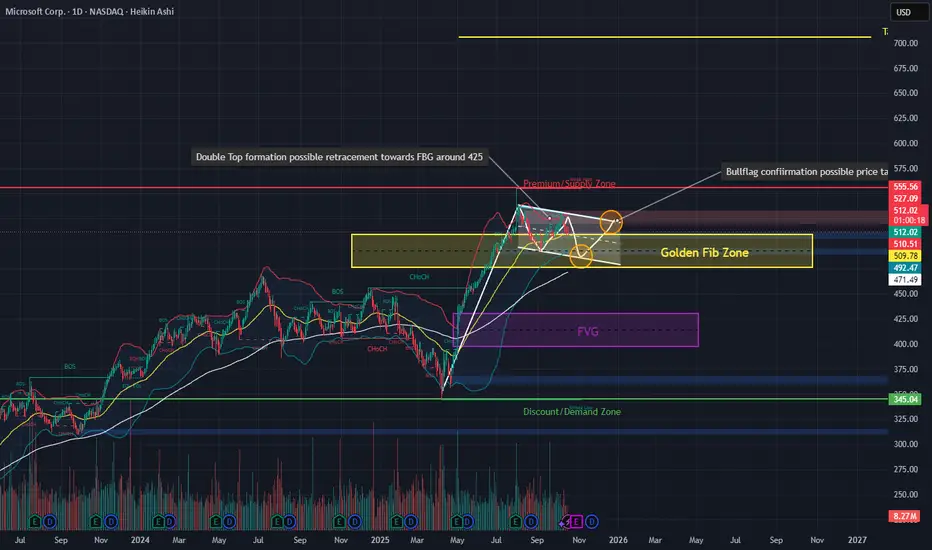
MSFT: Double Top or Bull Flag – The Next Big AI Move LoadingOverview:
Current structure shows confluence between a double-top formation near recent highs and a potential bull flag retracement setup. Price is consolidating around the $505–$510 zone, which overlaps with the 50 EMA and a mid-range supply area.
Pattern Outlook
Double-Top Possibility:
Price has rejected from prior highs, forming symmetry around a weak-high zone. A confirmed break below the $492–$495 zone would validate the double-top and suggest a retracement toward the FVG zone around $425.
Bull Flag Scenario:
If price maintains structure within the flag channel and finds demand in the yellow box ($490–$500 area), a bounce toward new ATH are on the table.
Confluences & Indicators
Volume: Still elevated compared to the previous down-move → supports continuation potential.
MACD: Currently flattening with early crossover hints; momentum could shift quickly.
RSI: Neutral (~55), leaving room for either direction.
Bollinger Bands: Tightening — volatility expansion incoming.
Macro & Catalyst 📰
🏢 $40B Data Center Acquisition:
Microsoft and investors securing computing infrastructure for AI expansion → long-term bullish catalyst. It signals aggressive reinforcement of their cloud and AI training capacity, directly supporting Azure and OpenAI workloads.
🕵️ Cybersecurity Breach (Chinese hackers exploiting SharePoint):
Short-term bearish risk factor, especially if it affects government confidence and triggers regulatory scrutiny. Expect possible volatility or temporary pullbacks while markets price the risk.
💻 Partnership with Nscale + Nvidia (200,000 GB300 GPUs):
Reinforces AI dominance narrative and resource moat through 2029, acting as a strong bullish fundamental. Also fuels investor sentiment around AI infrastructure spending.
🤝 Expansion with Cyviz:
Focus on visualization and collaboration tools enhances Microsoft’s ecosystem stickiness — secondary but still supportive for long-term value.
Macro Takeaway:
Even if a technical retracement occurs, the fundamentals remain extremely bullish into 2026. The $425–$435 zone could become a prime accumulation level if institutions buy the dip based on these AI catalysts.
Conclusion:
Microsoft’s chart and fundamentals are aligned for a macro bullish continuation following any near-term correction. Traders should monitor the $490 support closely for continuation confirmation and keep the FVG zone ($425–$435) on watch for a potential institutional re-entry opportunity.
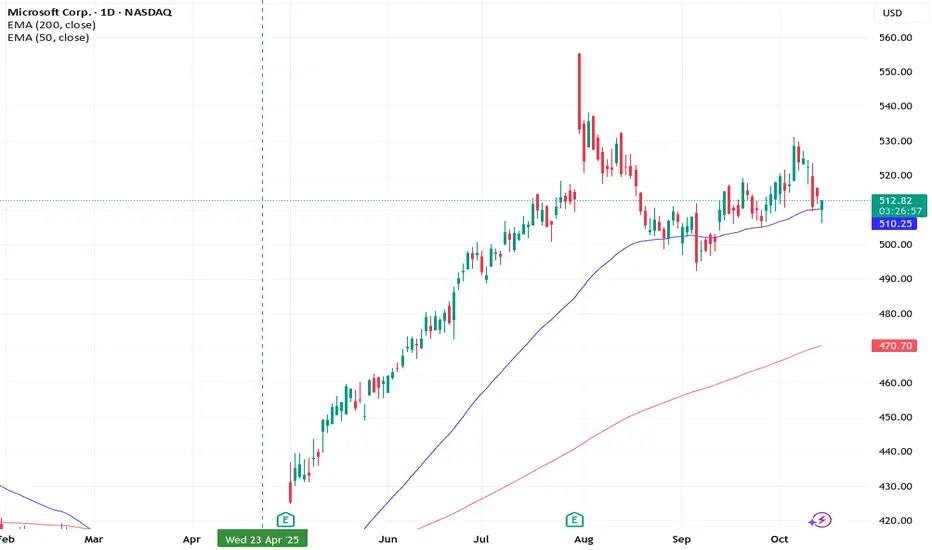
The #1 Stock:Microsoft (MSFT) – Rocket Booster Bullish Reversal Overview:
Microsoft is showing a monthly Rate of Change (ROC) above 0%, while the weekly ROC is below 0%, suggesting a potential reversal zone. This setup combines trend indicators with candlestick confirmation for a high-probability entry, part of what we call the Rocket Booster Strategy.
Rocket Booster Strategy Criteria:
Price is above the 50 EMA – signals short-term bullish momentum.
Price is above the 200 EMA – confirms long-term bullish trend.
Price has gapped up – adds momentum and increases the probability of a strong move.
Candlestick Confirmation:
Daily Candle: Long lower shadow – shows buying pressure.
Hammer Pattern: Confirmed on both daily and 4-hour charts, indicating potential reversal and continuation of bullish momentum.
Entry Strategy:
Wait for the 4H chart close above the hammer confirmation level for a safer entry.
This setup leverages both momentum and trend alignment, increasing the chance of a profitable trade.
Risk Management:
Place stop-loss below the low of the daily hammer candle.
Use position sizing according to your risk tolerance.
Always practice on a demo/simulation account before trading with real money.
Key Takeaways:
Monthly ROC above 0% → medium-term bullish bias.
Weekly ROC below 0% → short-term weakness, ideal for reversal.
Alignment above 50 EMA and 200 EMA + gap-up → Rocket Booster momentum.
Candlestick confirmation (hammer + long lower shadow) strengthens entry signal.
Conclusion:
This MSFT setup combines trend, momentum, and candlestick analysis into the Rocket Booster Strategy. Traders should wait for proper confirmation, manage risk carefully, and consider using a simulation account first.
Rocket boost this content to learn more
Disclaimer:
This article is for educational purposes only and does not constitute financial advice. Trading stocks involves risk.
Always practice on a simulation/demo account before trading with real money, and consult a licensed financial advisor. Past performance is not indicative of future results.
Emerging Markets and Capital Flows1. Introduction
In the globalized economy of the 21st century, emerging markets have become a critical component of international trade, investment, and finance. These nations—often transitioning from developing to developed status—play a vital role in global growth, driven by demographic advantages, industrialization, and financial liberalization. Capital flows, which refer to the movement of money for investment, trade, or business production, have become both a source of opportunity and vulnerability for emerging economies. The interaction between emerging markets and capital flows forms a cornerstone of global financial stability, shaping growth trajectories, currency valuations, and policy decisions worldwide.
Understanding how capital moves into and out of emerging markets provides valuable insight into global macroeconomic trends, investor behavior, and systemic risks. Over the last three decades, the expansion of capital mobility, technological progress, and integration of financial markets have amplified the scale and speed of these flows—making them a powerful force in global economics.
2. Defining Emerging Markets
2.1 Concept and Characteristics
An emerging market is an economy that exhibits characteristics of a developing nation but is on a path toward becoming a developed one. These economies typically show rapid growth, increasing industrialization, and improving financial infrastructure. The term was popularized by the International Finance Corporation (IFC) in the 1980s to attract investors to fast-growing countries in Asia, Latin America, and Eastern Europe.
Key features of emerging markets include:
High growth potential: Faster GDP growth compared to developed economies.
Economic transition: Movement from agriculture to manufacturing and services.
Expanding middle class: Rising consumption and domestic demand.
Volatile financial systems: Less mature institutions, greater susceptibility to external shocks.
Reform-oriented policies: Market liberalization, privatization, and regulatory improvements.
Examples include India, China, Brazil, South Africa, Indonesia, Mexico, and Turkey, among others. Collectively, these nations represent over 50% of global GDP (PPP basis) and are major contributors to global economic expansion.
3. Understanding Capital Flows
3.1 Types of Capital Flows
Capital flows represent the movement of financial resources across borders. They can be classified into two broad categories:
Private Capital Flows
Foreign Direct Investment (FDI): Long-term investments where a foreign entity acquires a lasting interest and control in a domestic enterprise (e.g., multinational companies setting up factories).
Portfolio Investment: Purchases of stocks, bonds, and other securities without direct control over businesses.
Bank Lending and Debt Flows: Loans and credit extended by international banks or institutions.
Remittances: Money sent by migrants to their home countries.
Official Capital Flows
Movements of funds by governments or international organizations (e.g., IMF, World Bank loans, foreign aid, or reserves management).
3.2 Direction of Flows
Capital flows can be:
Inflows: Investments or money entering a country.
Outflows: Investments or money leaving a country.
In emerging markets, inflows are often driven by higher yields, economic growth prospects, and diversification benefits for global investors. Outflows, on the other hand, can occur during crises, political instability, or global monetary tightening.
4. Evolution of Capital Flows to Emerging Markets
4.1 The 1980s: Debt and Structural Reforms
During the 1980s, emerging markets experienced large inflows of bank loans, but many countries—especially in Latin America—suffered debt crises due to excessive borrowing and rising global interest rates. This period led to major policy reforms and the eventual embrace of market liberalization.
4.2 The 1990s: Financial Liberalization and Volatility
The 1990s saw unprecedented capital mobility as emerging markets liberalized their financial sectors. Equity markets opened to foreign investors, and privatization programs attracted foreign direct investment. However, volatile short-term capital flows triggered several crises:
Mexico’s Tequila Crisis (1994–95)
Asian Financial Crisis (1997–98)
Russian Default (1998)
These events exposed vulnerabilities in regulatory frameworks, currency mismatches, and overreliance on foreign capital.
4.3 The 2000s: Global Integration and Resilience
The early 2000s witnessed recovery and strong FDI inflows, especially into China, India, and Eastern Europe, driven by manufacturing expansion and global trade. Commodity-exporting emerging markets benefited from rising prices, while countries adopted stronger macroeconomic policies and foreign reserve accumulation to safeguard against external shocks.
4.4 The 2010s: QE and “Hot Money”
Following the 2008 Global Financial Crisis, developed economies adopted quantitative easing (QE)—flooding global markets with liquidity and pushing investors to seek higher returns in emerging markets. While this boosted portfolio inflows, it also created vulnerability: once the U.S. Federal Reserve hinted at tightening in 2013 (“Taper Tantrum”), massive outflows hit emerging markets, causing currency depreciations and capital market stress.
4.5 The 2020s: Pandemic, Inflation, and Realignment
The COVID-19 pandemic caused a temporary collapse in capital flows, but fiscal and monetary stimulus reignited investment in 2021–22. However, the post-pandemic inflation surge and rising global interest rates (especially by the U.S. Fed) triggered a reversal of capital flows in 2022–23, highlighting the cyclical nature of global liquidity and risk appetite.
5. Drivers of Capital Flows to Emerging Markets
5.1 Global Factors
Global Interest Rates: Lower interest rates in advanced economies push investors toward higher-yield emerging assets.
Risk Appetite: When global investors are optimistic, they allocate more to riskier emerging markets.
Commodity Prices: For commodity-exporting nations, high prices attract inflows.
Exchange Rate Expectations: Anticipated currency appreciation encourages investment.
Quantitative Easing and Global Liquidity: Central bank policies in developed countries influence global capital allocation.
5.2 Domestic Factors
Economic Growth: Strong and stable GDP growth attracts FDI and portfolio flows.
Macroeconomic Stability: Low inflation, fiscal discipline, and manageable debt improve investor confidence.
Institutional Quality: Transparent governance, rule of law, and investor protection are crucial.
Financial Market Development: Deep and liquid markets enable efficient capital allocation.
Political Stability: Reduced uncertainty encourages long-term investment.
6. Benefits of Capital Flows to Emerging Markets
6.1 Access to Financing
Capital inflows provide emerging economies with access to external financing for infrastructure, industrial development, and innovation—often unavailable domestically due to shallow financial systems.
6.2 Economic Growth and Job Creation
Foreign direct investment brings in technology transfer, managerial expertise, and export diversification, fueling productivity and employment growth.
6.3 Financial Market Development
Foreign investors stimulate local capital markets, improve corporate governance, and enhance liquidity and pricing efficiency.
6.4 Currency Strength and Reserve Accumulation
Sustained inflows support currency appreciation and enable countries to build foreign reserves, which can be used during crises.
6.5 Integration into Global Value Chains
Capital inflows—especially FDI—enable emerging economies to integrate into global production networks, strengthening their industrial base.
7. Risks and Challenges of Capital Flows
7.1 Volatility and Sudden Stops
Capital flows can reverse quickly during global shocks, leading to “sudden stops”—sharp outflows that trigger currency depreciation, reserve losses, and financial instability.
7.2 Exchange Rate Appreciation and Loss of Competitiveness
Large inflows can cause real exchange rate appreciation, hurting export competitiveness (the so-called Dutch Disease).
7.3 Asset Price Bubbles
Excessive inflows, especially portfolio investments, can inflate stock and real estate bubbles, which collapse when sentiment turns.
7.4 Debt Accumulation
Short-term foreign borrowing increases external debt vulnerabilities, especially when denominated in foreign currencies.
7.5 Policy Dilemmas
Emerging economies often face the “impossible trinity” or “trilemma”: they cannot simultaneously maintain a fixed exchange rate, free capital mobility, and independent monetary policy. Managing these trade-offs is a constant challenge.
8. Policy Responses and Management of Capital Flows
8.1 Monetary Policy
Central banks use interest rate adjustments to influence capital movements and maintain price stability. However, this may conflict with growth objectives.
8.2 Exchange Rate Flexibility
Allowing the exchange rate to adjust absorbs external shocks and reduces the need for intervention.
8.3 Reserve Accumulation
Building up foreign exchange reserves acts as a buffer against capital outflows, though it involves sterilization costs.
8.4 Capital Controls and Macroprudential Measures
Selective capital controls—temporary taxes, minimum holding periods, or restrictions on speculative inflows—can stabilize volatile flows. Macroprudential policies (like loan-to-value ratios or reserve requirements) mitigate systemic risks.
8.5 Institutional and Market Reforms
Deepening domestic financial markets, improving transparency, and strengthening regulation enhance resilience against volatile capital movements.
9. Regional Perspectives
9.1 Asia
Emerging Asian economies—especially China, India, Indonesia, and South Korea—have attracted massive FDI due to strong growth, manufacturing strength, and stable macroeconomic policies. However, portfolio flows in markets like India remain sensitive to global liquidity and U.S. rate cycles.
9.2 Latin America
Latin American economies, such as Brazil, Mexico, and Chile, are highly exposed to commodity cycles. Recurrent capital flow volatility has led to emphasis on flexible exchange rates and foreign reserve buffers.
9.3 Eastern Europe
Post-communist transitions in Poland, Hungary, and the Czech Republic drew significant EU-related capital inflows. However, integration also made them vulnerable to Eurozone fluctuations.
9.4 Africa
Emerging African markets like South Africa, Nigeria, and Kenya have witnessed growing portfolio and FDI inflows, but dependence on commodities and weak institutions still pose structural challenges.
10. Role of International Institutions
Organizations such as the IMF, World Bank, and Bank for International Settlements (BIS) play crucial roles in:
Providing policy advice and financial assistance during crises.
Promoting capital account liberalization frameworks.
Monitoring global financial stability through surveillance and reporting.
Encouraging regional cooperation and macroprudential policy coordination.
11. Emerging Market Capital Flow Trends (2020s Outlook)
11.1 Digitalization and Fintech
Financial technology has reduced transaction costs and democratized access to global capital. Digital platforms now allow investors to allocate funds to emerging markets more efficiently, but also increase vulnerability to real-time capital flight.
11.2 Green and Sustainable Finance
ESG (Environmental, Social, Governance) considerations are reshaping investment flows. Green bonds and sustainable infrastructure financing are becoming key sources of capital for emerging economies transitioning toward low-carbon growth.
11.3 China’s Global Role
China’s “Belt and Road Initiative (BRI)” and its outward FDI expansion have redefined capital flows within the developing world. Simultaneously, Chinese domestic market liberalization has attracted global portfolio inflows.
11.4 Geopolitical Fragmentation
U.S.-China tensions, sanctions, and regional conflicts are leading to fragmented capital blocs, prompting emerging markets to diversify funding sources toward regional cooperation and South–South capital linkages.
11.5 Global Monetary Tightening
As advanced economies raise interest rates to combat inflation, capital outflows from emerging markets increase, highlighting the need for sound fiscal management, flexible currencies, and policy credibility.
12. The Future of Emerging Markets and Capital Flows
The next decade will witness a redefinition of global financial geography. Emerging markets will continue to be growth engines, but success will depend on how effectively they manage capital volatility, develop domestic markets, and align with sustainability goals.
Key priorities include:
Building resilient financial systems with robust regulation.
Encouraging long-term FDI over speculative short-term flows.
Strengthening regional financial safety nets.
Leveraging digital finance and fintech innovation.
Promoting green capital flows for sustainable development.
In essence, the balance between openness and stability will shape how emerging markets harness capital flows for inclusive and sustainable growth.
13. Conclusion
Emerging markets and capital flows represent a powerful yet delicate relationship that drives global economic evolution. While capital mobility offers tremendous growth opportunities—funding infrastructure, enhancing productivity, and deepening financial markets—it also introduces cyclical vulnerabilities and exposure to global shocks. Managing these dynamics requires prudent macroeconomic policies, flexible exchange rate regimes, institutional strength, and international cooperation.
As globalization transforms into a more regionalized, digitized, and sustainable framework, emerging markets stand at the center of this transformation. Their ability to attract and manage capital effectively will determine not only their own prosperity but also the stability and inclusiveness of the world economy.
MSFT: The “Top Pick” Trap? Or Real Breakout Fuel?Microsoft is testing a critical support zone — and with Morgan Stanley just naming it a top pick in tech, buyers may be gearing up for control. 📈
Quantitative stats back the setup: Sortino Ratio of 0.42 and 90% win rate on this pattern.
👉 What’s your call — breakout to new highs… or one more dip before the rally?

Microsoft Challenges Chinese Tech Firms with Its Expansion into Microsoft Expands Its Healthcare Footprint: Pressure on Chinese Tech Stocks and Strengthening Market Value
By Ion Jauregui – Analyst at ActivTrades
Healthcare technology stocks in Hong Kong saw significant declines on Thursday, affected by a wave of profit-taking following a strong rally and reports confirming Microsoft’s (NASDAQ:MSFT) growing presence in the digital health sector. The move reinforces the global outlook of the U.S. company, which continues to diversify its growth lines beyond corporate software and cloud services.
From a macroeconomic perspective, the announcement comes at a time when the global tech market is showing signs of sector rotation. After months of favoring pharmaceutical and biotech firms, investors are beginning to shift toward large technology players with solid financial structures and strong innovation capacity, such as Microsoft. The company recently signed an agreement with Harvard University to enhance healthcare content within its AI assistant Copilot, representing a decisive step toward integrating intelligent medical tools into the generative AI ecosystem.
Dominic King, Microsoft AI’s Vice President of Health, stated that the goal is for Copilot to provide more accurate and professional health-related responses than any other tool currently available. This move could intensify global competition in the digital healthcare sector, particularly for Chinese health-tech firms that may face pressure in international markets from Microsoft’s innovation capacity and vast resources.
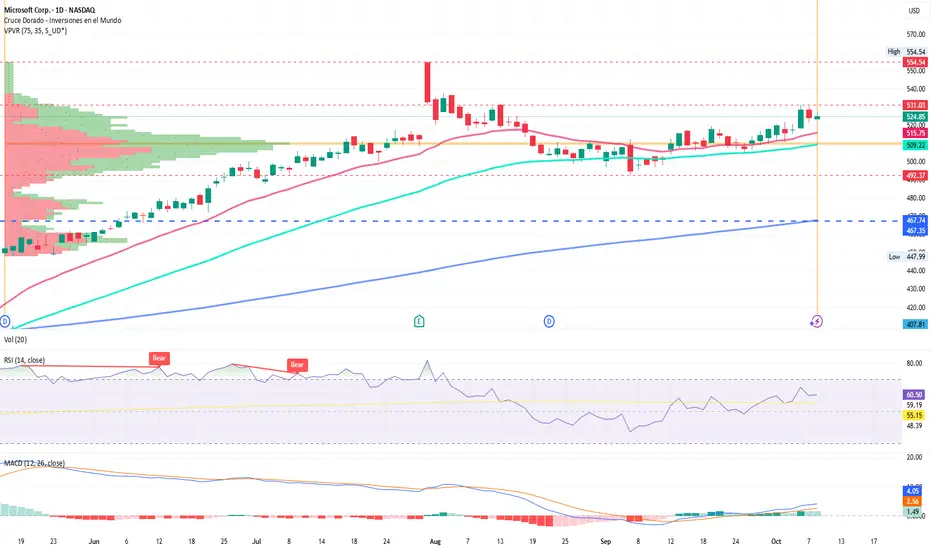
Microsoft Analysis (Ticker: MSFT)
From a technical standpoint, Microsoft maintains a consolidated bullish structure, supported by strong fundamentals and sustained growth in its AI and cloud segments. Following the recent rally that pushed prices to a weekly high of $531.03, the stock stabilized around $524.85, a level that coincides with a consolidation zone within its ascending channel.
The Point of Control (POC) is currently located near $509.80, where the price has repeatedly found technical support. Key support levels lie at $515 and then $509, while the structural range support remains at $492.37. On the upside, a sustained break above $531 could project the stock toward July’s high at $554.54, reinforcing the continuation of the bullish trend. Failure to hold this level could trigger a correction toward the lower band of the $492.37–$531.03 range.
The daily RSI, at 60.5 points, suggests that the uptrend still has room for extension. The moving averages crossover that began in September remains active, supporting the price above the 50-day moving average, while the MACD maintains a positive, upward configuration consistent with ongoing momentum.
Microsoft: A Global Leader
In summary, Microsoft continues to strengthen its position as a global technology leader, channeling its AI expertise into strategic sectors such as healthcare. This development not only puts pressure on Asian competitors but also reinforces investor confidence in Microsoft’s long-term growth potential.
*******************************************************************************************
The information provided does not constitute investment research. The material has not been prepared in accordance with the legal requirements designed to promote the independence of investment research and such should be considered a marketing communication.
All information has been prepared by ActivTrades ("AT"). The information does not contain a record of AT's prices, or an offer of or solicitation for a transaction in any financial instrument. No representation or warranty is given as to the accuracy or completeness of this information.
Any material provided does not have regard to the specific investment objective and financial situation of any person who may receive it. Past performance and forecasting are not a synonym of a reliable indicator of future performance. AT provides an execution-only service. Consequently, any person acting on the information provided does so at their own risk. Political risk is unpredictable. Central bank actions can vary. Platform tools do not guarantee success.
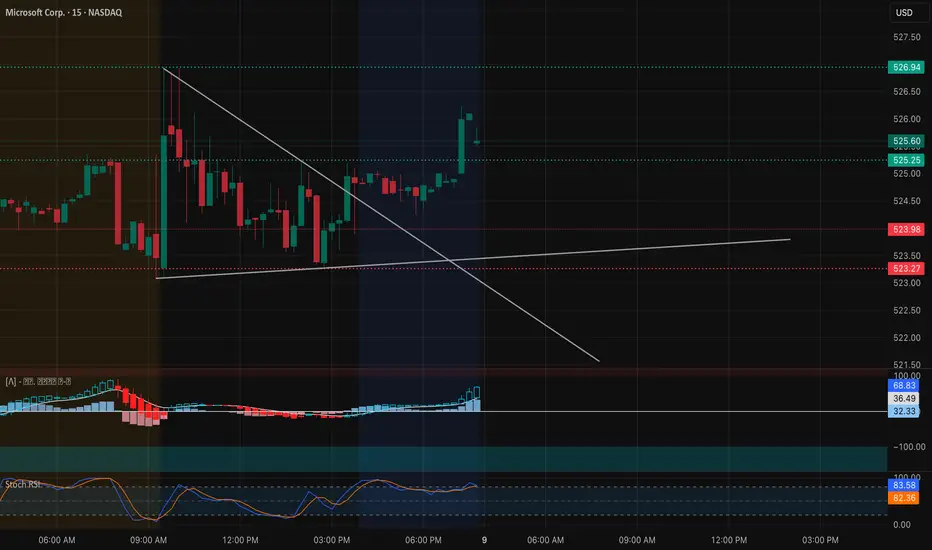
MSFT Oct. 9 — Bulls Regain Momentum Above $525Eyeing $531 Breakout 🚀
Microsoft (MSFT) is showing a strong bullish reversal after clearing its descending trendline on the 15-minute chart. Price reclaimed $525 support with a solid impulsive candle, confirming a short-term CHoCH followed by upward momentum. The breakout from the compression zone has opened room toward $528–$531 resistance.
MACD flipped bullish with increasing histogram bars, while Stoch RSI remains elevated but not yet signaling exhaustion. As long as $523 holds, momentum favors continued upside into the next gamma resistance zone.
On the 1-hour chart, MSFT is trading between $517.5 (HVL support) and $531 (gamma resistance) — a clean range that aligns with its recent breakout structure. Volume confirms accumulation near $522–$525, reinforcing the bullish bias for continuation.
Support and Resistance Levels:
* Immediate Resistance: $526.9 → $528
* Major Resistance (Gamma Wall): $531 → $535
* Immediate Support: $523.9 → $523.2
* Key Support Zone: $517.5 → $511
GEX & Options Sentiment (1H GEX Chart):
* The highest positive Call Gamma sits near $531, forming the next magnet if momentum continues.
* Strong Put Support lies around $505–$500, providing a solid floor for bulls.
* IVR 33.2 and Call sentiment 11.8% suggest room for fresh upside exposure — a potential gamma squeeze if MSFT breaks $528.
* The GEX curve steepens positively above $525, supporting price expansion once breakout volume sustains.
Trade Scenarios:
Bullish Setup:
* Entry: Above $526 breakout
* Target 1: $528
* Target 2: $531
* Stop-Loss: Below $523
* Rationale: Clear trendline break, bullish MACD momentum, and supportive GEX profile indicate strong continuation potential.
Bearish Setup:
* Entry: Below $523 breakdown
* Target 1: $517.5
* Target 2: $511
* Stop-Loss: Above $526
* Rationale: Rejection at $526.9 could trigger a pullback toward the HVL range before rebounding.
MSFT has regained strength with clear bullish intent above $525. Watch for volume confirmation above $526 for the next leg toward $531. As long as price stays above $523, bulls remain firmly in control.
Disclaimer:
This analysis is for educational purposes only and does not constitute financial advice. Always do your own research and manage your risk before trading.
If anyone needs me to TA any stock, PM me.
Possible break of Upper TrendlinePrice looks like it is set to break this trendline. If it breaks, watch for a retest and buy in after confirmation.
*Not financial advice, or whatever.
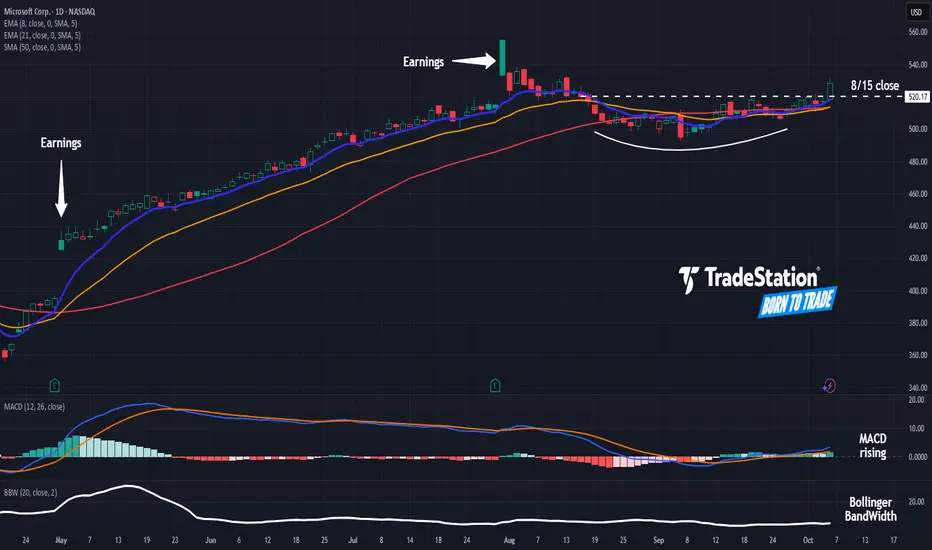
Microsoft May Be Moving AgainMicrosoft has been snoozing since the summer, but some traders may think the tech giant is ready to start moving again.
The first pattern on today’s chart is the pair of bullish gaps following quarterly results, which may reflect positive sentiment.
Second is the August 15 weekly close of $520.17. MSFT slipped under that line in the second half of August and spent all of September below it. Prices crossed the resistance yesterday. That could suggest a breakout has begun.
Third, Bollinger Band Width fell to its narrowest level since April 2024. Are prices set to expand following such compression?
Next, the stock has clawed back above its 50-day simple moving average. The 8-day exponential moving average (EMA) is also above the 21-day EMA and MACD is rising. Those signals may be consistent with bullish direction.
Finally, MSFT is an active underlier in the options market. (Its average daily volume of 296,000 contracts ranks 16th in the S&P 500, according to TradeStation data.) That could help traders take positions with calls and puts.
TradeStation has, for decades, advanced the trading industry, providing access to stocks, options and futures. If you're born to trade, we could be for you. See our Overview for more.
Past performance, whether actual or indicated by historical tests of strategies, is no guarantee of future performance or success. There is a possibility that you may sustain a loss equal to or greater than your entire investment regardless of which asset class you trade (equities, options or futures); therefore, you should not invest or risk money that you cannot afford to lose. Online trading is not suitable for all investors. View the document titled Characteristics and Risks of Standardized Options at www.TradeStation.com . Before trading any asset class, customers must read the relevant risk disclosure statements on www.TradeStation.com . System access and trade placement and execution may be delayed or fail due to market volatility and volume, quote delays, system and software errors, Internet traffic, outages and other factors.
Securities and futures trading is offered to self-directed customers by TradeStation Securities, Inc., a broker-dealer registered with the Securities and Exchange Commission and a futures commission merchant licensed with the Commodity Futures Trading Commission). TradeStation Securities is a member of the Financial Industry Regulatory Authority, the National Futures Association, and a number of exchanges.
Options trading is not suitable for all investors. Your TradeStation Securities’ account application to trade options will be considered and approved or disapproved based on all relevant factors, including your trading experience. See www.TradeStation.com . Visit www.TradeStation.com for full details on the costs and fees associated with options.
Margin trading involves risks, and it is important that you fully understand those risks before trading on margin. The Margin Disclosure Statement outlines many of those risks, including that you can lose more funds than you deposit in your margin account; your brokerage firm can force the sale of securities in your account; your brokerage firm can sell your securities without contacting you; and you are not entitled to an extension of time on a margin call. Review the Margin Disclosure Statement at www.TradeStation.com .
TradeStation Securities, Inc. and TradeStation Technologies, Inc. are each wholly owned subsidiaries of TradeStation Group, Inc., both operating, and providing products and services, under the TradeStation brand and trademark. When applying for, or purchasing, accounts, subscriptions, products and services, it is important that you know which company you will be dealing with. Visit www.TradeStation.com for further important information explaining what this means.
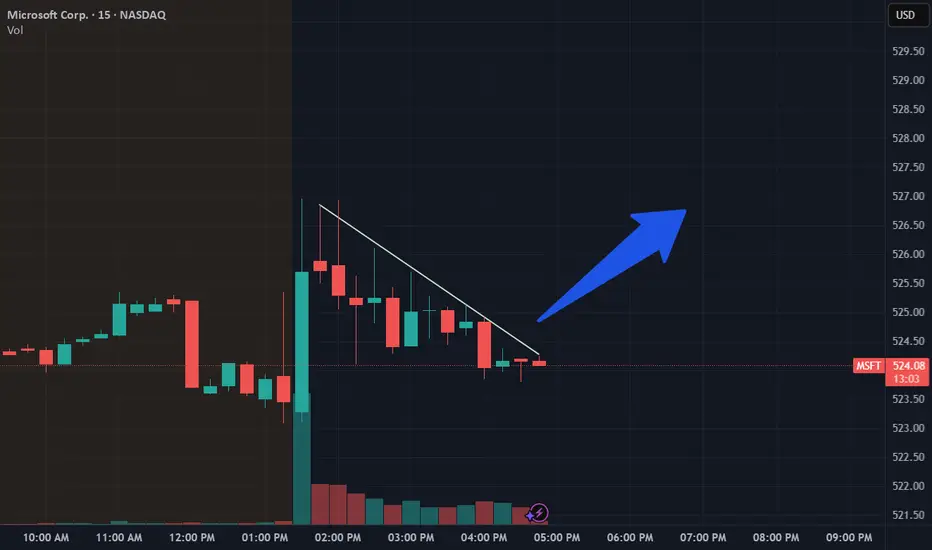
MSFT Oct 7 – Testing Mid-Channel Support Before Next Breakout15-Min Chart Analysis (Intraday Trading Setup):
MSFT continues to hold its ascending channel firmly, with price now consolidating near $527.33 after rejecting the upper boundary at $531. The structure shows clean bullish control, but short-term momentum has cooled off — typical of a mid-channel reset before continuation.
The MACD has crossed down from high levels, reflecting a temporary cooldown, while the Stoch RSI sits near oversold territory (13.23), hinting that buyers could soon regain strength.
If MSFT holds the $520.50–$522 demand zone (where previous breakout originated), the bullish bias remains intact.
A retest and bounce from that zone would likely push MSFT back toward $530.95 → $535, aligning with channel resistance and previous intraday highs.
However, if $518 breaks decisively with volume, a short-term correction toward $516–$514 becomes likely before the next leg higher.
1-Hour GEX Confirmation (Options Sentiment Insight):
Gamma Exposure (GEX) levels align perfectly with this 15-min setup:
* Strong CALL walls sit at $528–$536, showing continued bullish hedging pressure.
* Highest positive NETGEX is concentrated around $540, signaling potential upside magnet if momentum resumes.
* Major PUT support lies between $505–$510, marking it as a deep safety net where downside gamma is likely to stall.
This configuration favors a bullish-to-neutral bias for the week — suggesting dips are likely to be absorbed, and any bounce above $530 could accelerate toward $535–$540, backed by dealer hedging.
My Thoughts:
The technical and options data both tell the same story: MSFT is in a controlled bullish channel with institutional flow still supportive. The pullback looks like a healthy reset rather than reversal. I’ll be watching $520 closely — a hold there could offer a strong risk/reward setup for a continuation play.
If price reclaims $530.95, that could trigger breakout momentum, potentially reaching the $535–$540 zone this week.
Options Outlook (Oct 7–11):
* Bullish setup: Buy-to-open 530C or 535C (Oct 11 expiry) if price breaks and holds above $530.50 with volume confirmation.
* Bearish scalp: Consider 520P only if price rejects hard below $517.50, confirming breakdown structure.
* Implied Volatility: IVR 30.6 with stable IVx (26.4) — conditions still favorable for directional trades with measured premium exposure.
Conclusion:
MSFT remains bullish as long as $520 holds. A sustained move above $530.95 will confirm strength toward the next gamma target near $540. Watch for volume-supported reclaim and MACD reversal for the next leg higher.
Disclaimer: This analysis is for educational purposes only and does not constitute financial advice. Always do your own research and manage your risk before trading.

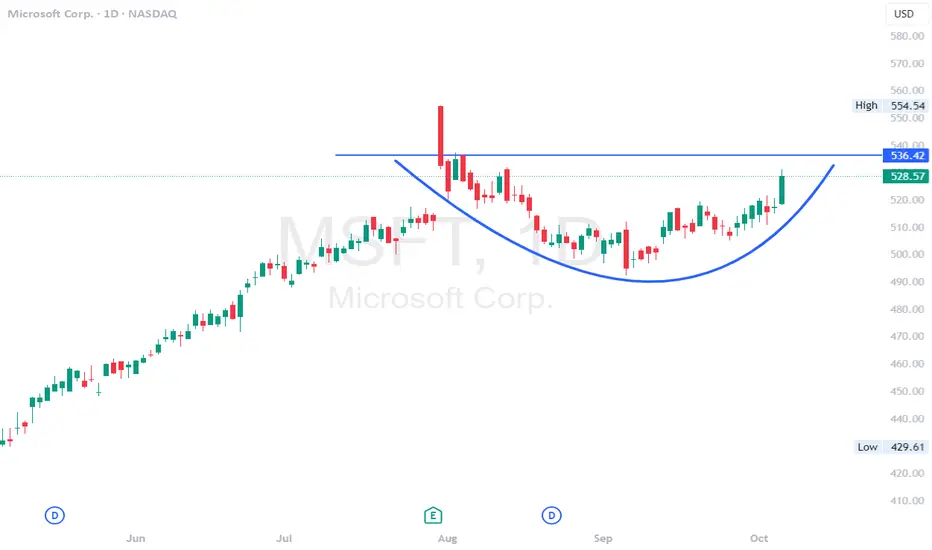
MSFT - Cup style reversal here. upside move incomingMSFT - Stock making a cup style reversal on the daily time frame after post earnings pull back. Looking for calls above $530 for a move towards $536 and $550. 2 months out calls coming in here. looking strong for a move to the upside.
MSFT Daily: Eyes on 555 - Will 515-520 Support Hold?MSFT Daily: Eyes on 555 - Will 515-520 Support Hold?
Microsoft (MSFT) has established a solid bullish recovery from the "Key Support 500" level and is currently consolidating above the flipped "Current Support 515 to 520" zone.
The immediate bullish objective is a push towards "Initial Resistance near 540," as indicated by the projected price paths.
A decisive breakout above 540 would likely accelerate momentum towards the primary "Target 555," revisiting previous highs.
Holding the 515-520 support area is essential to maintain the current uptrend; failure to do so could trigger a retest of the foundational 500 level.
Disclaimer:
The information provided in this chart is for educational and informational purposes only and should not be considered as investment advice. Trading and investing involve substantial risk and are not suitable for every investor. You should carefully consider your financial situation and consult with a financial advisor before making any investment decisions. The creator of this chart does not guarantee any specific outcome or profit and is not responsible for any losses incurred as a result of using this information. Past performance is not indicative of future results. Use this information at your own risk. This chart has been created for my own improvement in Trading and Investment Analysis. Please do your own analysis before any investments.

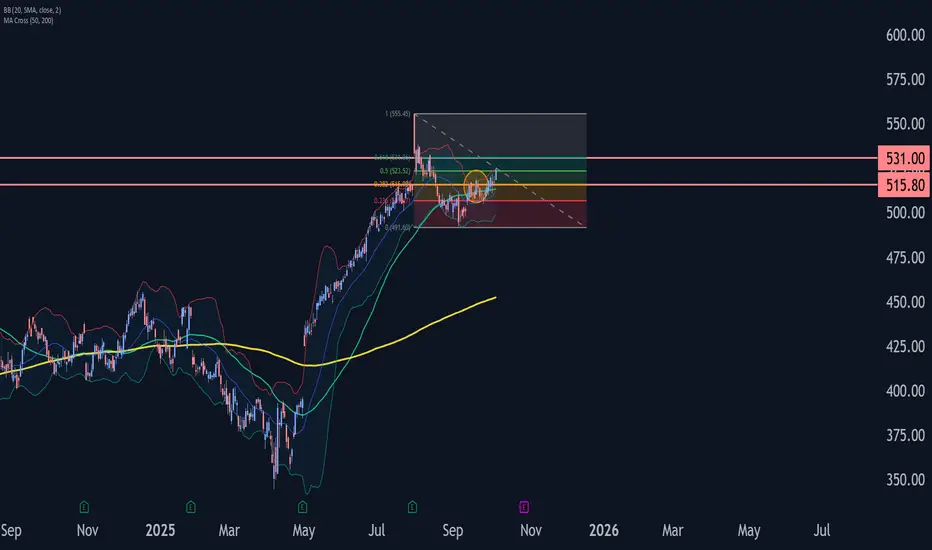
Microsoft Wave Analysis – 6 October 2025
- Microsoft rising inside impulse wave (3)
- Likely to rise to resistance level 531.00
Microsoft recently broke the resistance zone between the key resistance level 515.80 (which stopped the previous impulse wave (1) in September) and the 50% Fibonacci correction of the downward correction from July.
The breakout of this resistance zone accelerated the active medium-term impulse wave (3) from the end of September.
Given the clear daily uptrend, Microsoft can be expected to rise to the next resistance level 531.00 (former top of wave B from August).
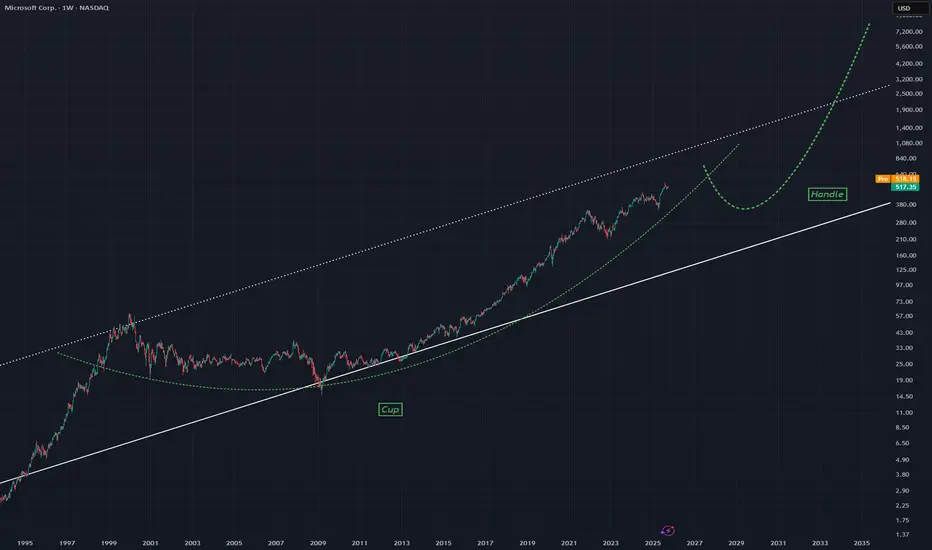
MSFT - Long Term Cup and Handle The price rising now could be considered a large cup formation with the handle still yet to be seen following a bearish move
Cup and Handle patterns are considered bullish on this timeframe.
Lower solid white trend line is a well respected trend line.
Weekly chart
Microsoft Macro BullMSFT is currently in grand wave 3/5!
PT: ~$500
Lengthening cycles & diminishing returns!
2nd Great Recession - Corrective Grand Wave 4 - 60-80% correction
Roaring 20s after - liquidity for final grand wave 5!
