State Bank of India Ltd for 14th Oct #SBINState Bank of India Ltd for 14th Oct #SBIN
Resistance 885 Watching above 886 for upside momentum.
Support area 870 Below 875 gnoring upside momentum for intraday
Watching below 869 for downside movement...
Above 875 ignoring downside move for intraday
Charts for Educational purposes only.
Please
Key facts today
Next report date
—
Report period
—
EPS estimate
—
Revenue estimate
—
8.88 EUR
8.48 B EUR
71.96 B EUR
About State Bank of India
Sector
Industry
CEO
Rana Ashutosh Kumar Singh
Website
Headquarters
Mumbai
Founded
1921
ISIN
US8565522039
FIGI
BBG00FGWZ3Y6
State Bank of India engages in the provision of public sector banking, and financial services statutory body. It operates through the following segments: Treasury, Corporate/Wholesale Banking, Retail Banking, and Other Banking Business. The Treasury segment includes the investment portfolio and trading in foreign exchange contracts and derivative contracts. The Corporate/Wholesale Banking segment consists of lending activities of Corporate Accounts Group, Commercial Clients Group, and Stressed Assets Resolution Group that provides loans and transaction services to corporate and institutional clients and further include non-treasury operations of foreign offices. The Retail Banking segment refers to the retail branches, which primarily includes personal banking activities including lending activities to corporate customers. The Other Banking business segment focuses on the operations of all the non-banking subsidiaries and joint ventures of the group. The company was founded on January 27, 1921 and is headquartered in Mumbai, India.
Related stocks

State Bank of India Ltd for 13th Oct #SBIN State Bank of India Ltd for 13th Oct #SBIN
Resistance 885 Watching above 886 for upside momentum.
Support area 870 Below 875 gnoring upside momentum for intraday
Watching below 869 for downside movement...
Above 875 ignoring downside move for intraday
Charts for Educational purposes only.
Please

Stste Bank of India The weekly chart of State Bank of India (SBIN) shown here indicates a strong bullish setup emerging after a period of consolidation. The stock is currently trading at ₹880.65, approaching a major resistance zone near ₹920, last tested during previous rallies.
Key Technical Observations
Resistanc

Amazing breakout on WEEKLY Timeframe - SBINCheckout an amazing breakout happened in the stock in Weekly timeframe, macroscopically seen in Daily timeframe. Having a great favor that the stock might be bullish expecting a staggering returns of minimum 25% TGT. IMPORTANT BREAKOUT LEVELS ARE ALWAYS RESPECTED!
NOTE for learners: Place the break

#SBIN 23rd Aug - 50 Points Swing? 762 or 895?Date: 23-08-2025
#SBIN - Current Price: 816.25
Pivot Point: 829
Support: 815
Resistance: 842
Upside Targets:
--------------------------------
| Target | Price |
---------------------------------
| 🎯 Target 1 | 854 |
| 🎯 Target 2 | 866 |
| 🎯 Tar

SBIN Chart Breakout – Momentum AheadSBIN Double Breakout Alert
On the 4H timeframe, SBIN has given a parallel channel breakout.
Additionally, it has also confirmed a broadening pattern breakout.
Sustaining above the ₹850–₹860 level may open the path for higher prices ahead.
Thank you!

Amazing breakout on WEEKLY Timeframe - SBINCheckout an amazing breakout happened in the stock in Weekly timeframe, macroscopically seen in Daily timeframe. Having a great favor that the stock might be bullish expecting a staggering returns of minimum 25% TGT. IMPORTANT BREAKOUT LEVELS ARE ALWAYS RESPECTED!
NOTE for learners: Place the break

SBIN1️⃣ Trend & Demand Zones
All timeframes (HTF, MTF, ITF) show UP trend, indicating strong bullish alignment.
Timeframe Proximal Distal Average
HTF (Yearly–Quarterly) 661 500–543 581–602
MTF (Monthly–Daily) 661–817 600–798 631–805
ITF (240M–60M) 811 798 805
Takeaway:
Long-term demand: 500–661
Med

State Bank of India Ltd for 18th Sept #SBIN State Bank of India Ltd for 18th Sept #SBIN
Resistance 860 Watching above 861 for upside momentum.
Support area 850 Below 850 gnoring upside momentum for intraday
Watching below 846 for downside movement...
Above 860 ignoring downside move for intraday
Charts for Educational purposes only.
Pleas

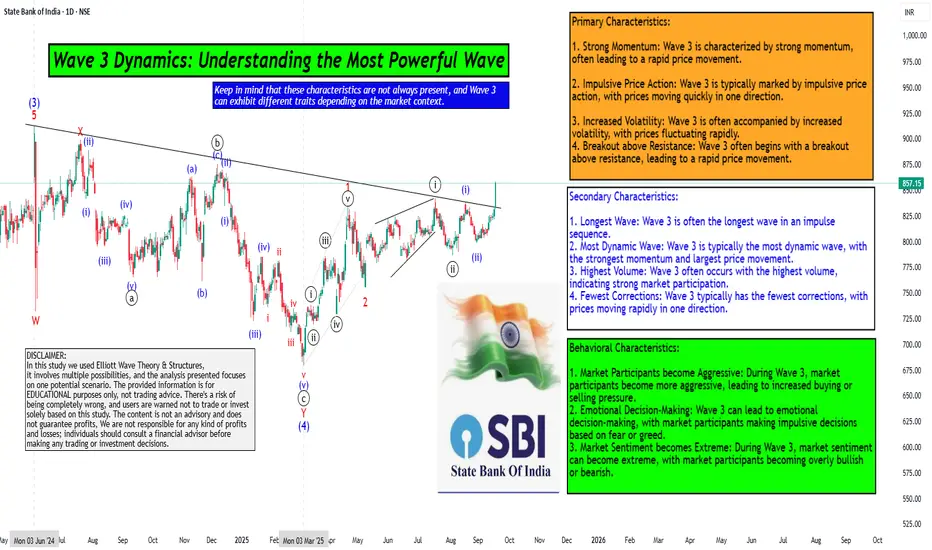
Wave 3 Dynamics: Understanding the Most Powerful WaveHello Friends, Welcome to RK_Chaarts,
For Learning and Practicing chart Analyzing, Today we are trying to Analyse the State Bank of India (SBIN) chart from an Elliott Wave perspective, we can see that the intermediate-degree Wave (3) completed at the June 2024 high. This was followed by a complex c
See all ideas
An aggregate view of professional's ratings.
Neutral
SellBuy
Strong sellStrong buy
Strong sellSellNeutralBuyStrong buy
Neutral
SellBuy
Strong sellStrong buy
Strong sellSellNeutralBuyStrong buy
Neutral
SellBuy
Strong sellStrong buy
Strong sellSellNeutralBuyStrong buy
Displays a symbol's price movements over previous years to identify recurring trends.
770SBI38
State Bank of India 7.7% 19-JAN-2038Yield to maturity
8.34%
Maturity date
Jan 19, 2038
834SBIPERP
State Bank of India 8.34% PERPYield to maturity
7.92%
Maturity date
—
773SBIPERP
State Bank of India 7.73% PERPYield to maturity
7.45%
Maturity date
—
751SBI32
State Bank of India 7.51% 06-DEC-2032Yield to maturity
7.32%
Maturity date
Dec 6, 2032
772SBI31
State Bank of India 7.72% PERPYield to maturity
7.30%
Maturity date
—
798SBIPERP
State Bank of India 7.98% PERPYield to maturity
7.26%
Maturity date
—
772SBIPER
State Bank of India 7.72% PERPYield to maturity
7.21%
Maturity date
—
733SBI39
State Bank of India 7.33% 20-SEP-2039Yield to maturity
7.20%
Maturity date
Sep 20, 2039
755SBIPERP
State Bank of India 7.55% PERPYield to maturity
7.20%
Maturity date
—
775SBIPER
State Bank of India 7.75% PERPYield to maturity
7.15%
Maturity date
—
754SBI38
State Bank of India 7.54% 01-AUG-2038Yield to maturity
7.07%
Maturity date
Aug 1, 2038
See all SID bonds
Curated watchlists where SID is featured.

Indian stocks: Racing ahead
46 No. of Symbols
See all sparks