TU5A trade ideas

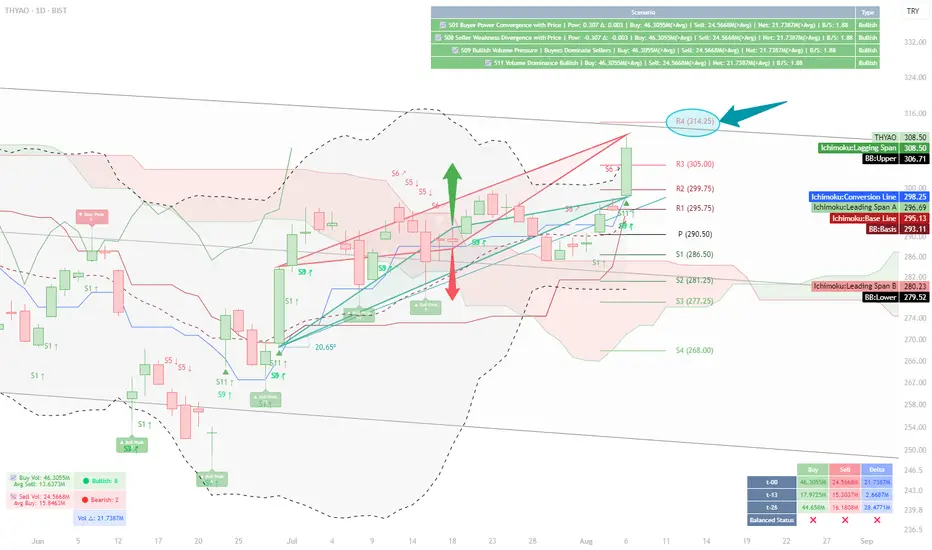
Volume and Structural Analysis of THYAO — Reaching Resistance at📝 Analysis:
My initial focus in this chart was on the daily buy and sell volumes.
According to the table displayed at the bottom of the chart for August 6th:
Buy Volume (t-0): 46.305M
Sell Volume (t-0): 24.566M
These values show a clear increase compared to previous checkpoints (t-13 and t-26).
Notably, the buy volume is 28.3M higher than t-13 and about 1.6M higher than t-26.
This gives us a broader picture: buying strength remains dominant, even though delta volume has not surpassed its value at t-26 (still about 7M short). Nevertheless, the current volume levels show stronger positioning compared to the mid-term past.
On the upper-right side of the chart, four system-based scenarios have been triggered via our custom indicator:
✅ Scenario 01 – Buyer Power Convergence with Price
✅ Scenario 08 – Seller Weakness Divergence
✅ Scenario 09 – Bullish Volume Pressure
✅ Scenario 11 – Volume Dominance Bullish
Together, they present a market that is tilting in favor of the buyers, with bullish sentiment supported by volume structure.
Next, my attention shifts to the triangle formations on the chart, which were automatically plotted based on cross high/low logic.
🔺 The green ascending triangle, with a slope of 20.65°, indicates a healthy and steady bullish structure.
Its top has not yet reached the resistance zone, where the red triangle forms a descending structure aligned with the R4 level at 314.25.
Beyond the technical interpretation, I also look at triangles symbolically.
Throughout history, from the Seal of Solomon (Star of David) to the Egyptian pyramids, triangles have represented stability, energy focus, and a path upward.
In this chart, that symbolism holds true — the green triangle embodies a progressive, rising support, while the red triangle offers a calculated obstacle.
What’s intriguing is the parallel structure of the triangle bases — suggesting a balanced energy field, ready to be tipped by momentum.
📊 When combined with other indicators:
Price is above the red Ichimoku cloud
It sits in the upper zone of the regression channel
Bollinger Bands show an upward breakout bias
Daily pivot levels align with this structure, and the R4 level (314.25) becomes a relevant resistance to monitor
📍 Conclusion:
Given the alignment of structural elements and volume behavior,
a move toward the resistance at 314.25 is well within reach under current market dynamics.
⚠️ This analysis is based on a custom-built indicator named Volume Based Analysis V 1.4+ and is provided strictly for educational and analytical purposes.
No investment or trading advice is intended.
👥 I welcome your interpretations and experiences —
Do you also see 314.25 as a realistic target?
Turk Hava Yollari : Pole Target Achieved, 295 % PROFIT Turk Hava Yollari: A Channel Pattern formed and Breakout. The Pole Target was achieved within two years, resulting in a 275% PROFIT. Bought at 41 TRY in May 2022 and Sold at 314 TRY in May 2024.
I want to help people to Make Profit all over the "World".

THYAO CORRECTIONPrice is moving within the Oct/2023 channel. Upper trend started from Mar/2024 has been broken and re-tested in May/2024.
I believe that this short term correction will be completed between 301.5 and 308.5 where we have 50 days MA as well, if Kaufman MA support is broken. Target is the upper boundary of Reg.Trend.


THYAOnot investment advice!
In 2019 it fell out of the channel and in 2022 it returned to the ascending channel.. it's a bull trap :))
I wonder where it will go in the rising canal by 2028.. We know it will reach the neckline... and then what? 1gr or 2,9gr :))
BIST_DLY:THYAO/FX_IDC:XAUTRYG

THYAO (Turk Hava Yollari)Turkish Airlines or officially Türk Hava Yolları Anonim Ortaklığı is the flag carrier of Turkey. As of 2022, it operates scheduled services to 340 destinations in Europe, Asia, Africa, and the Americas, making it the largest mainline carrier in the world by number of passenger destinations.
Potential bull flag technical formation.

THYAO-1D PATTERNExpect to see two possible targets at the south and then a sharp move to the north. Trend to be followed on previous thyao idea which is linked below.

THYAO - SHORT AND MID-TERM TARGET - EWTwo expected return zones are marked for THYAO, short term target is TARGET 1, two mid-term targets are TARGET 2 and 3. TARGET 3 has the lowest probability.

Target 156.4This is a monthly chart.
- Last candle
- Overbought RSI
- Inconsistancy in RSI
- How far from EMA200
whispers something in the chart.
TP 156.4
Follow latest high to stop.

turkish airlines - get ready for your millenium present. In any case, corona would hit Turkey, this one will drop below 1.3$
dolar/turkish lira would be up to 6.84-7.2TL( average 7TL)
1,3*7TL=9,1TL, my entry for Long

THYAO Fibonacci working like a charm!Best works in 1-5-15 minute chart. Intented for scalping. Can open trades in both ways. after closing position on resistance/support , you can open opposite position at same level , and profit both ways.

Turk Hava Yullari 4H LongTurk Hava Yullari
4H Long
Pennant pattern
Buy at = 140
Tp1 = 143
Tp2 = 146
Tp3 = 149
Tp4 = 151.6
Sl = 137.1
$$$$$$$$$$$$$

THY short position i think i will retract to Fib 1.618 AB=CD it was a measured moved which has been done. IF THY share will go UP or DOwn we need to see FIB level 1.618 potential buy if not SHORT

THY - BIST - Bearish Divergence.THY have a huge bearish divergence. I think it will hit around 16-18 Turkish Lira. Cycle is done, it has to retrace to gain power to another bull-run.

THYAO/USDTRY DEPENDS ON APPETITE FOR DESTRUCTION6 USD level is the critical level. Expecting consolidation at this point onward.

THYAOstrong uptrend after break consolidation zone.
We have now return candle with a good wick and a red candle that give us a signal
for the beginning of the downtrend.
In addition to the stochastic indicator that paves way for price
After the strong uptrend.
If you like my idea don´t forget support.
Thanks.

THYAO still bears for upsideTHYAO seems to be one of the greatest long options in XU100 and against XU100.
One should remember only airlines carrying Russians are Turkish Airlines, and Russians are only able to go Turkey for summer vacation.
Stop is tight, TP is around %50 up. This is a good trade opportunity.

Time for a breakout? Let's shortA long term THYAO graph.
Sure there can be a perfect breakout, but I bet for a short now.

THYAOClosed 40.18 heavy down will be seen in coming weeks and we will see 35-31 level
the trend moving within channel and the unemployment showing rising better to have sell and be patient to target high profit

Target 28.1After big fall yesterday, we're ready to go to close the gap in short term.
TP 28.1
SL following trend line

predictiong thyaohello,
As you see here according to my chart pattern analysis, i see that that scenario is strongly possible and it combines the present circumstanses of world conjoncture.
so as i used to say i do not have a cristal ball predicting markets' future but i try to be more effiecient and more rational.
good luck
