When Everyone’s Buying, I’m Watching for the TopAs we’ve grown used to by now, Gold sets a new ATH almost every day — and by the time we, in Europe, wake up, it’s already 300–400 pips higher.
Yet despite the strong bullish momentum, speculative trading remains extremely difficult. Sudden drops of hundreds of pips can easily hit your stop loss if your entry timing isn’t perfect.
From my perspective — even though I don’t have an open position — the idea remains the same: a correction is inevitable.
Since Friday’s low, the price has rallied around 3,000 pips — a fabulous move, but like any late-stage rally, it’s becoming excessive and irrational (even more than it already was).
Of course, it can always go higher, but the more it exaggerates, the faster it tends to normalize.
As I mentioned before, my approach remains focused on identifying potential tops — and while that’s the riskiest thing a trader can do, it has worked quite well during the sharp downward spikes of the last two weeks.
Technically, the move from Friday’s low is forming a rising wedge, with resistance around 4270, which is where I’ll be looking to sell.
The target zone is roughly 1,000 pips lower.
One encouraging factor — even more so than before — is the noticeable narrowing of the spread between futures and spot, now at just 0.2–0.25%, compared to the usual ~1% (and sometimes higher) during strong bullish phases.
Trade ideas

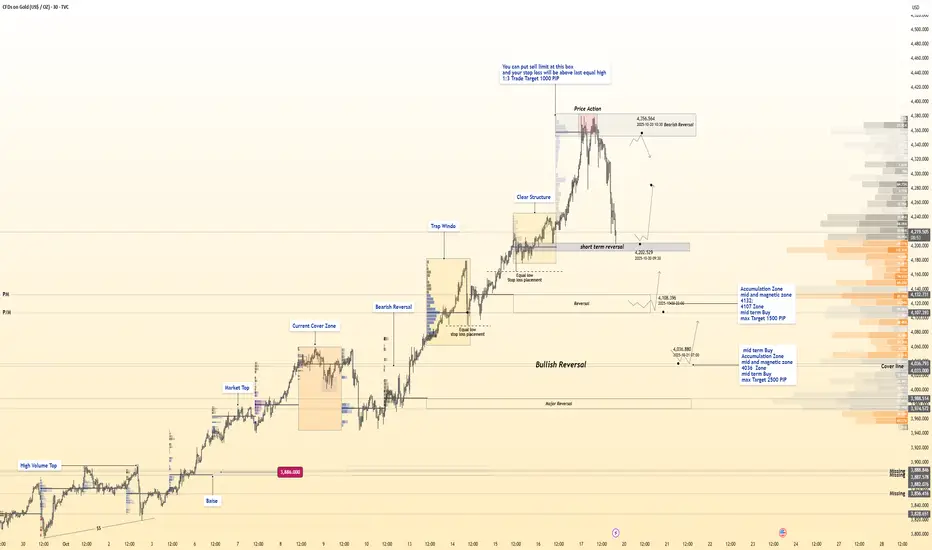
The Ultimate GOLD Reversal Map📊 Hanzo Protocol Note
Every marked level reflects precision between liquidity, delta reaction, and volume logic —
Only structure and flow decide — not bias.
Mid-Term SELL Zone — 4360
Setup: Limit Sell Recommended
Stop Loss: Above recent equal highs
Target: +1000 Pips (1:3 RR)
Reasons:
Liquidity pool above previous equal highs
Institutional distribution volume at upper range
HVN (High Volume Node) cluster acting as resistance wall
Delta shift showing heavy sell absorption
Imbalance re-test aligned with order block
4H premium pricing zone within range top
Price deviation above value area high
Stop hunt confirmation wick
Momentum divergence vs delta
Hidden distribution footprint visible on volume profile
Short-Term BUY Zone — 4202
Setup: Reactive Buy Opportunity
Target: 500–1000 Pips
Reasons:
Ultra-volume spike with no price continuation
Delta flip confirming buyer absorption
Trap formation below session low
Volume exhaustion beneath POC
Smart Money re-entry point after sell-side clear
Strong 30M reversal wick with liquidity gap
Reaction from prior fixed HVN
Internal structure shift with micro CHoCH
Buyer cluster confirmed under equilibrium
Perfect liquidity grab setup before new leg
Mid-Term BUY Zone — 4132 – 4107
Setup: Accumulation & Magnetic Demand Area
Target: Up to 1500 Pips
Reasons:
Multi-session HVN alignment
Strong accumulation footprint on delta flow
Reactive rejection at discounted price zone
Liquidity engineered below equilibrium
Large volume imbalance correction
Compression channel breakout origin
Major liquidity gap filled
High-probability reversal range from fixed profile
Delta divergence showing quiet buyer absorption
Institutional order flow detected at low volume shelf
Long-Term BUY Zone — 4036
Setup: Deep Accumulation Zone
Target: Up to 2500 Pips
Reasons:
Major 4H structural base confirmed
Deep liquidity flush below quarterly low
Volume absorption + delta compression zone
Institutional reloading pattern visible
Smart Money demand block within discount 0.79 level
Magnet zone aligning with historical POC
Strong rejection from fixed range low
Major delta shift to positive
Buyer footprint expansion in lower volume node
Final liquidity grab before long-term accumulation move
Gold Pullback Could Be the Next Buying OpportunityHello, traders, I want share with you my opinion about Gold. The market for Gold has been trading within a clear bullish structure, forming an ascending channel since breaking out from the earlier range near the 4,050–4,100 zone. The breakout from that consolidation led to strong upward momentum, with price making consistent higher highs and higher lows. Recently, the market faced strong selling pressure from the Seller Zone near 4,366, which aligns with the Resistance Level. After a retest of this supply area, price rejected and started a correction within the channel. The price is approaching the Buyer Zone around 4,205, which also coincides with the lower boundary of the ascending channel and the previous support level. This confluence makes the area significant for potential bullish reactions. I expect Gold to retest the Buyer Zone (4,205) and, if buyers show strength, a bounce toward 4,320–4,366 could follow. This would represent the continuation of the uptrend within the ascending channel. However, if price breaks below 4,205, it would signal a possible shift in structure and open the door for a deeper correction toward the 4,100 area. Please share this idea with your friends and click Boost 🚀

Gold Analysis: Break Above $4,293 Could Trigger a New HighHi guys!
Gold has been moving inside a clear ascending channel, respecting both its upper and lower boundaries. Recently, we saw a double top formation near the upper trendline , which triggered a corrective move down to the $4,190–$4,200 support zone, an area that has already shown strong buying interest.
After the rebound from this support, the price is now aiming toward the $4,293 resistance.
👉 If the price breaks and holds above $4,293 , it’s likely to continue the bullish momentum and head toward a new higher high inside the channel.
Overall, the structure remains bullish as long as the price stays above $4,190 , with the next key resistance at $4,293 being the level to watch for a potential continuation of the uptrend.
Gold’s bullish bias remains supported by the ongoing geopolitical tensions, uncertainty over global interest rate paths, and softening U.S. dollar. Investors are also increasingly turning to gold as a safe-haven asset, especially amid concerns about economic slowdown and central bank gold purchases remaining strong.
Disclaimer: As part of ThinkMarkets’ Influencer Program, I am sponsored to share and publish their charts in my analysis.

GOLD 1H CHART ROUTE MAP UPDATE & TRADING PLAN FOR THE WEEKHey Everyone,
Please see our updated 1h chart levels and targets for the coming week.
We are seeing price play between two weighted levels with a gap above at 4275 and a gap below at 4229. We will need to see ema5 cross and lock on either weighted level to determine the next range.
We will see levels tested side by side until one of the weighted levels break and lock to confirm direction for the next range.
We will keep the above in mind when taking buys from dips. Our updated levels and weighted levels will allow us to track the movement down and then catch bounces up.
We will continue to buy dips using our support levels taking 20 to 40 pips. As stated before each of our level structures give 20 to 40 pip bounces, which is enough for a nice entry and exit. If you back test the levels we shared every week for the past 24 months, you can see how effectively they were used to trade with or against short/mid term swings and trends.
The swing range give bigger bounces then our weighted levels that's the difference between weighted levels and swing ranges.
BULLISH TARGET
275
EMA5 CROSS AND LOCK ABOVE 4275 WILL OPEN THE FOLLOWING BULLISH TARGETS
4320
EMA5 CROSS AND LOCK ABOVE 4320 WILL OPEN THE FOLLOWING BULLISH TARGET
4360
BEARISH TARGETS
4229
EMA5 CROSS AND LOCK BELOW 4229 WILL OPEN THE FOLLOWING BEARISH TARGET
4194
EMA5 CROSS AND LOCK BELOW 4194 WILL OPEN THE FOLLOWING BEARISH TARGET
4151
EMA5 CROSS AND LOCK BELOW 4151 WILL OPEN THE SWING RANGE
4122
4075
EMA5 CROSS AND LOCK BELOW 4075 WILL OPEN THE SECONDAARY SWING RANGE
4022
3955
As always, we will keep you all updated with regular updates throughout the week and how we manage the active ideas and setups. Thank you all for your likes, comments and follows, we really appreciate it!
Mr Gold
GoldViewFX

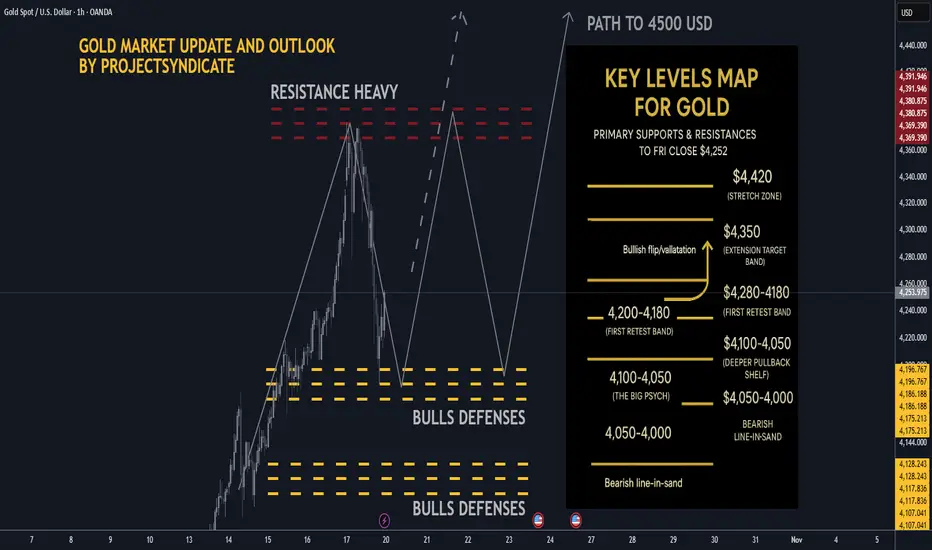
Gold next week: Key S/R Levels and Outlook for Traders🔥 GOLD WEEKLY SNAPSHOT — BY PROJECTSYNDICATE
🏆 High/Close: $4,379 → ~$4,252 — higher close vs. last week’s pullback finish.
📈 Trend: Uptrend intact > $4,000; dip buyers continue to control rhythm.
🛡 Supports: $4,180–$4,140 → $4,100–$4,050 → $4,000 must hold.
🚧 Resistances: $4,260 / $4,300 / $4,350 → stretch $4,380–$4,420.
🧭 Bias next week: Buy-the-dip > $4,140–$4,200; momentum regain targets $4,300–$4,380+. Invalidation < $4,050 → risk $4,000/3,980.
🌍 Macro tailwinds:
• Fed: Markets lean to another cut into Oct 28–29; softer real yields buoy gold.
• FX: DXY under pressure = constructive backdrop.
• Flows: ETF interest & CB buying remain supportive on dips.
• Geopolitics: Tariff/trade and regional risks keep safe-haven bids live.
🎯 Street view: Several houses float $5,000/oz by 2026 scenarios on easing policy & reserve diversification narratives
________________________________________
🔝 Key Resistance Zones
• $4,260–$4,280 near-ATH supply / immediate ceiling from close
• $4,300–$4,350 extension target band
• $4,380–$4,420 stretch zone toward prior spike high and measured extensions
🛡 Support Zones
• $4,220–$4,200 first retest band just below close
• $4,180–$4,140
• $4,100–$4,050 deeper pullback shelf; $4,000 remains the big psych
________________________________________
⚖️ Base Case Scenario
Expect shallow pullbacks into $4,220–$4,140 to be bought, followed by rotation back into the $4,260–$4,300 resistance stack for an ATH retest.
🚀 Breakout Trigger
A sustained push/acceptance > ~$4,280 unlocks $4,300 → $4,350, with room toward $4,380–$4,420 if momentum persists.
💡 Market Drivers
• Fed cut expectations into late Oct(lower real yields = gold tailwind
• USD softness / DXY sub-100 tone supports metals
• Ongoing central-bank bullion demand; ETF inflows stabilizing
• Geopolitics & trade/tariff headlines keeping safety bids active
🔓 Bull / Bear Trigger Lines
• Bullish above: $4,140–$4,200
• Bearish below: $4,100–$4,050 risk expands under $4,000
🧭 Strategy
Accumulate dips above $4,140–$4,200.
On breakout > $4,280, target $4,300–$4,350+. Maintain tight risk under stepped supports; invalidate momentum below $4,050–$4,000.
________________________________________
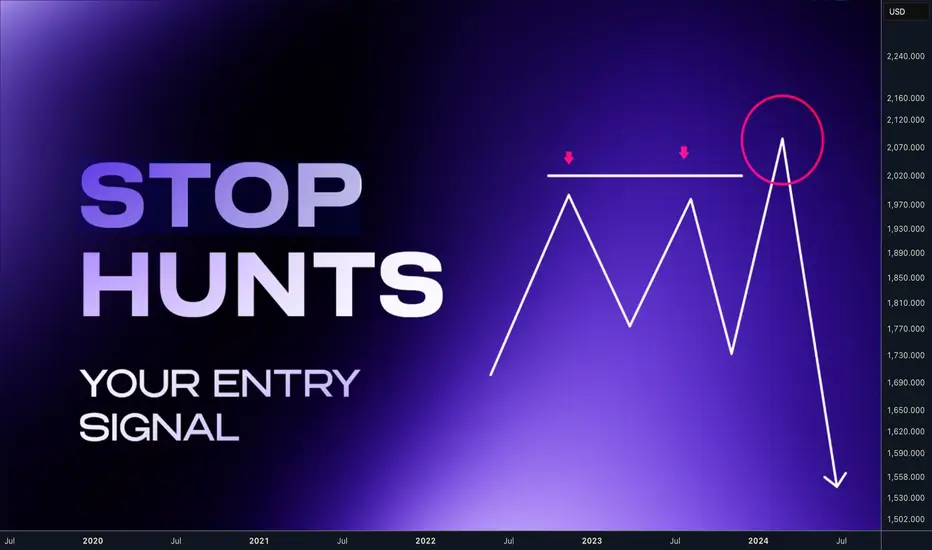
The Art of the Stop Hunt Trading. Hey traders In this post, you’ll learn how to the liquidity is engendered and how to avoid being stop hunted and actually use stop hunts to your advantage
📌If you placing your stop loss below the level before it was visited to grab the liquidity, you will become the liquidity. In the fact market makers doesn't care about your or mine stop loss, its too small money. But they come there because they have to in order to move the market. 📌 Every trader has seen it happen: you take a position at the “obvious” level, only to get stopped out by a quick wick — and then the market runs exactly where you expected. That wasn’t bad luck. That was stop hunt in other words liquidity grab ‼️ Don't be a liquidity
Price doesn’t move randomly inside ranges. It hunts liquidity at the edges.
• Retail trap: Traders pile orders right at the Double top / bottoms and ranges
• Smart money: Hunt's double top / bottoms and ranges starting the move.
📌 Double Top / Double bottom
sometimes price leave this formation, sometime even triple top / Bottom. It's on purpose and its telling us price will go there again, Im using these as the targets. Traders still think that if price rejected somewhere for few times that its strong level and its safe to put stop loss above or below and thats the problem. As many traders thinks this way its create a huge stop loss cluster = Liquidity zone which is attractive for the market makers.
‼️ If you see a double top / bottom then never enter before price dip in to it. Not even when there is clear trend line break its trap. Wait , you will get much sharper and better risk reward trade. If a pivot level gets tapped multiple times, it's on purpose. Smart money are creating illusion of strong support / Resistance so they cant manipulate price above / bellow where they grab the liquidity and reverse the market.
🧪 Example 1 - Triple top stop hunt, if you enter before you would serve as liqudity 🧪 Example 2 - Triple top stop hunt, even if you are right with the direction, not eating for the stop hunt first will ruin your trade 🧪 Example 3 - Double top stop hunt - he was nice trend line break which attracted more sellers and as you can see they been right with the direction but setting your stop loss just right above double top is not working 🧪 Example 4 - market makers used triple top used to offload positions above this liquidity level. 💊 Les informed traders trades patterns like : Double bottom, Double top and they put the stop losses above the range - This creates a Liquidity cluster which smart money needs to execute their orders. They will come for it before the real move happen. 🧩 How to use this information for your advantage
train your eyes and focus on the double tops / bottoms thats where the liquidity mostly will be resting. Always wait for the stop hunt after that is your time enter the market. Im looking for the trades always after the stop hunt in other words range manipulation. Let's check few ideas bellow.
🧪 EURUSD - after double top liquidity manipulated Im targeting opposing double bottom liquidity. 🔗 Click the picture to see price action development 👇https://www.tradingview.com/chart/EURUSD/OI08qVGB-EURUSD-I-Weekly-Range-I-Manipulation-Time-for-pullback/ 🧪 DOLLAR - Weekly Range Low liquidity was taken - now targeting double top liquidity as easy target. 🔗 Click the picture to see price action development 👇 🧪 USDCHF - Double bottom liquidity taken, targeting opposing side 🔗 Click the picture to see price action development 👇https://www.tradingview.com/chart/USDCHF/2AbnD2TR-USDCHF-I-Daily-CLS-range-I-Key-Level-FVG-I-HTF-CLS/ 🧪 DOGE - Liquidity take and targeting opposing range. 🔗 Click the picture to see price action development This is happening over and over again across all assets
👉Once you see it you cant unsee it. Focus on the stop hunts and you will see the market structure differently. Not like higher highs, higher lows and vice versa but rather something like this.
📌 Uptrend
Price is in a bullish move and is consistently breaking abovehighs and rejecting below lows. (Sweeping liquidity) - heading to HTF liqudity 📌 Downtrend
Price is in a bearish move and is consistently breaking below lows and rejecting above highs.(Sweeping liquidity) - heading to HTF range liquidity whole new world will open for you. You will be entering only after stop hunts.
⭐ I have whole strategy build on that click the picture below for more inspiration and the most powerful thing is that price is fractal what you just learned in the post above is possible to scale down. So for example you analyze Monthly range manipulation and you have opposing target. Its target for the next few weeks until the price reaches the monthly target and if you scale down to Daily then you trade Daily ranges in the Monthly range sequence.
📌 Bullish LTF Range within HTF Range
Analyze HTF range and define models, then drop it to your TF and trade your ranges with the HTF range. Always follow the same process only on the LTF - Lower timeframe. 📌BearishLTF Range within HTF Range
Analyze HTF range and define models, then drop it to your TF and trade your ranges with the HTF range. Always follow the same process only on the LTF - Lower timeframe. Shift from being the exit liquidity to being the trader who patiently waits, confirms, and executes with precision.
🩸 Spot the Liquidity. 🩸 Wait for stop hunt. 🩸 Trade with intention.
Don't trust me and check this on your chart find the true.
David Perk aka Dave FX Hunter
XAU/USD | First LONG, then SHORT! (READ THE CAPTION)By analyzing the Gold (XAUUSD) chart on the 15-minute timeframe, we can see that gold hit all targets between $4,300 and $4,350 and even rallied to $4,380.99, marking a new all-time high (ATH)!
After that, gold started to correct below $4,300, briefly dipping to $4,258 before bouncing back above $4,285. I expect that if the price moves into the $4,300–$4,317 zone, we may see a negative reaction or rejection from this area.
If that scenario plays out, gold could drop toward $4,250 as its first key target.
Keep a close eye on these levels — and if you have questions about gold’s trend, feel free to leave a comment using the link below!
Please support me with your likes and comments to motivate me to share more analysis with you and share your opinion about the possible trend of this chart with me !
Best Regards , Arman Shaban

Gold Bull Market Outlook And Targets: 5000 USD/7500 USDGold Bull Markets Long Term Overview and 2025 Market Update
________________________________________
🌊 Five-Wave Roadmap — Targets & Timing
• Wave 1 (2016–2020): From ~$1,050–1,200 to the COVID-era spike; established secular up-trend.
• Wave 2 (2020–2022): Consolidation/corrective pullback (~–20%).
• Wave 3 (2023–2025/26): Power leg to ATHs (current). Room to extend toward $4,200–$4,500 on flow surges before pausing.
• Wave 4 (2026, base case): Re-accumulation/consolidation ~12 months; likely range-bound –10% to –15% from the Wave-3 peak as institutional buying digests gains.
• Wave 5 (2027–2030/32): Final thrust to the cycle’s terminal zone:
– First objective: $5,000–$5,500 (consistent with 2026 Street “bull wave” scenarios).
– Terminal extension: $7,500–$8,000 by 2030–2032 (our desk’s stretch path if real yields stay muted, official-sector demand persists, and private capital rotation broadens).
Why Wave-4 can last ~12 months: prior secular bulls often paused for a full year near major breakouts while flows “change hands.” Expect lower realized vol, fading retail FOMO, and steady official accumulation to define the tape.
📈 Top 10 Stats of the Current Bull 2025
1. Price & ATHs: Spot ~$3.75–$3.79k; fresh ATH $3,790.82 on Sep 23, 2025.
2. 2025 YTD: Roughly +40–43% YTD
3. Central Banks: 1,045 t added in 2024 (later revised to ~1,086 t as lagged data came in). H1/Q1’25 tracking remained elevated.
4. ETF Flows: Back-to-back strong quarters; Q2’25 total demand 1,249 t, value US$132bn (+45% y/y) with ETFs instrumental.
5. Gold vs Equities: Gold ≈+40% vs S&P 500 ≈+13% total return YTD.
6. Jewelry Demand: Tonnage softened as prices surged; value at records (2024 down y/y; weakness persisted into H1’25).
7. Gold–Silver Ratio: ~85–88 (silver torque improving as it pushes into the mid-$40s).
8. Macro Link: Safe-haven bid + expected policy easing keep real-yield headwinds contained.
9. Technical: Confirmed 13-yr cup-and-handle breakout (Mar ’24) underpinning trend.
10. Street Forecasts: GS baseline $4,000 by mid-’26; bulled-up houses (HSBC/BofA) flag $4.9–$5.0k potential into 2026 if private/ETF rotation persists.
• This cycle is different: record central-bank buying + renewed ETF inflows + lower real rates = powerful tailwind.
• Price: Gold notched fresh ATHs this month (up to $3,790.82). 2025 is shaping up as the strongest year since the late 1970s.
• Relative: Gold is crushing equities YTD (≈+40% vs S&P 500 ≈+13% total return).
• Setup: A 13-year “cup-and-handle” breakout in 2024 kick-started the move.
• Outlook: Street base cases cluster near $4,000 by mid-’26; several houses now publish $4,900–$5,000 stretch targets into 2026 as flows accelerate.
________________________________________
🏆 Historic Gold Bull Markets — Timeline & Stats
1. 1968–1980 “Super Bull”
• Start/End: ~$35 → $850 (Jan 1980)
• Gain: ~2,330%
• Drivers: End of Bretton Woods, oil shocks, double-digit inflation, geopolitical stress.
• Drawdown: ~–45% (1974–1976) before the final blow-off run.
2. 1999–2011/12
• Start/Peak: ~$252 (1999) → ~$1,920 (2011–12)
• Gain: ~650%
• Drivers: Commodities supercycle, EM demand, USD weakness, GFC safe-haven bid.
3. 2016/2018–Present (The “CB-Led” Cycle)
• Start Zone: $1,050–$1,200 → New ATH $3,790 (Sep 2025)
• Gain: ~215–260% (depending on 2016 vs 2018 anchor)
• Drivers: Record central-bank accumulation, sticky inflation/low real rates, geopolitics; 2024 13-yr base breakout.
________________________________________
📊 At-A-Glance Comparison (Updated 2025)
Metric | 1968–80 Super Bull | 1999–2012 | 2016/18–2025 Current
🚀 Total Gain | ~2,330% | ~650% | ~215–260% (so far)
⏲️ Duration | 12 yrs | 13 yrs | 7–9 yrs (ongoing)
💔 Max Drawdown | ~–45% (’74–’76) | ~–30% (’08) | ~–20% (2022)
🏦 Main Buyer | Retail/Europe | Funds/EM | Central Banks
🏛️ Pattern | Secular parabolic | Cyclical ramps | 13-yr base → breakout (’24)
Notes: current-cycle characteristics validated by WGC demand trends & the 2024 technical breakout.
________________________________________
________________________________________
________________________________________
🔄 What Makes This Bull Different 2025 Edition
• 🏦 Central-Bank Dominance — Third consecutive 1k+ tonne year in 2024; 2025 is still tracking strong on a run-rate basis. This “sticky” demand is from price-insensitive reserve managers.
• ⚡ Faster Recoveries — Drawdowns are shallower/shorter vs the 1970s analog, consistent with a structural rather than speculative buyer base.
• 📈 Coexisting With Risk Assets — ATHs with equities positive YTD = macro hedge + diversification bid, not just “panic buying.”
• 📐 Structural Breakout — 13-yr base cleared in 2024; market now in multi-year price discovery.
________________________________________
🎯 Strategy Ideas 2025 & Beyond
• Buy/Hold on Dips: Stagger entries (DCA) into physical (allocated), ETFs (e.g., GLD/IAU), and quality miners/royalties.
• Prefer Physical/Allocated where counterparty risk matters; use ETFs for liquidity and tactical tilts.
Satellite/Leverage
• Silver & GSR Mean-Reversion: With GSR ~85–88, silver historically offers torque in up-legs. Pair with high-quality silver miners.
• Factor Tilt in Miners: Prioritize low AISC, strong balance sheets, reserve growth, rule-of-law jurisdictions; emphasize free-cash-flow yield and disciplined capex.
Risk-Management
• Define max drawdown per sleeve; pre-plan trims near parabolic extensions or if macro invalidates (e.g., real-yield spike).
• Use options overlays (collars on miners; long-dated calls on physical proxies) to shape payoff in Wave-3 late innings and Wave-4 digestion.
________________________________________
🧪 Reality Check: What Could Invalidate the Bull?
• Real yields + USD rip higher (sustained) → compress gold’s opportunity cost.
• Official-sector buying stalls (policy or FX-reserve shifts) → removes the anchor bid.
• Growth re-acceleration + faster-than-expected disinflation → weaker safe-haven + fewer rate cuts.
• Technical break: a persistent move below ~$3,600–3,700 would question Wave-3 extension and pull forward Wave-4.
________________________________________
🧭 Quick Reference Tables
🧾 Summary: Historic vs Current
Feature | 1968–80 | 1999–2012 | 2016/18–2025
Total Gain | ~2,330% | ~650% | ~215–260%
Duration | 12 yrs | 13 yrs | 7–9 yrs (ongoing)
Correction | ~–45% | ~–30% | ~–20% (’22)
Main Buyer | Retail/Europe | Funds/EM | Central Banks
Pattern | Parabolic | Cyclical | Cup & Handle → Secular
🧩 “If-This-Then-That” Playbook
• If real yields fall & CB buying persists → Ride trend / add on consolidations.
• If USD + real yields jump → Trim beta, keep core hedge.
• If GSR stays >80 with silver momentum → Overweight silver sleeve for torque.
________________________________________
🔚 Key Takeaways Updated
• Twin pillars: relentless official-sector demand + 2024 structural breakout.
• Base case: Street ~$3.7–4.0k by mid-’26 with upside to $4.5–5.0k on accelerated private/ETF rotation.
• Roadmap: Extend Wave-3 → Wave-4 re-accumulation (~12 months) → Wave-5 to $5,000–$5,500, then $7,500–$8,000 by 2030–2032 under favorable macro/flow dynamics.
• Operating stance: keep core, add on dips/sideways phases, manage beta and drawdowns proactively.

XAUUSDHello Traders! 👋
What are your thoughts on GOLD?
Gold has seen a sharp and powerful rally over the past few weeks and continues to trade in a bullish structure.
From a fundamental perspective, there are still no major signs of weakness, as macro factors continue to support gold’s long-term uptrend.
However, from a technical standpoint, a short-term correction appears increasingly likely.
On the 4-hour chart, gold has recently broken its ascending trendline and is now trading below a key resistance zone.
If price pulls back to retest the broken trendline and then breaks below the 4180 support level, we could see a deeper move toward the next support zone.
Volatility in gold has been extremely high in recent days, with sharp intraday swings.
It’s advisable to avoid aggressive entries at the moment and wait for clearer confirmation signals before taking new positions.
Don’t forget to like and share your thoughts in the comments! ❤️

Why I Didn’t Buy Gold in the Last Few WeeksI’ve been bullish on gold since the beginning of the year — expecting it to reach $3000, and in a very optimistic scenario, maybe even $3500. My previous posts are proof of that.
But I definitely wasn’t expecting $4000, and certainly not $4200, for one simple reason:
Some time ago, my crystal ball broke, and since then I’ve been trying to base my trades on technical analysis and what I’ve actually seen happen in the past — not on wishful thinking.
________________________________________
When Price Doesn’t Correct, But You Still Profit Selling
Ever since gold hit the $3700–$3800 zone, I’ve been expecting a correction.
It never came.
Even so, I still made money selling against the trend — something I usually avoid and definitely don’t recommend anyone to do.
But this post isn’t about my trades. It’s about why I didn’t buy gold in the last two or three weeks.
And the answer is right there — on the chart.
________________________________________
The Chart Tells the Truth
If you look closely, you’ll see yellow rectangles highlighting the sharp drops that happened during this period.
It’s easy to look at the chart after the fact and say:
“I should’ve bought there.”
But imagine you don’t see the right side of the chart.
You’re sitting in front of your screen, looking at the current price, trying to decide what to do.
And then — within minutes — gold drops 700-800 pips out of nowhere.
No signal. No alert on WhatsApp. No warning.
Where do you put your stop?
Do you trade without one?
Just because you know it will bounce?
And what if it doesn’t?
What if it drops another 1000 pips — the same way it just did — without even breathing?
That’s not trading. That’s hope disguised as confidence.
________________________________________
This Is an Exercise in Honesty
This is an exercise in honesty with yourself — not after you’ve seen the chart.
How many of you would’ve stayed in a position that’s -500 pips, just because you “know” it will turn around?
Even now, right after I finished recording the video, it dropped another 500+ pips like it was nothing.
I’ve explained this a thousand times:
1. If a trade is not there, it’s not there. Period.
I don’t force it. I don’t FOMO.
2. A trade must have a clear entry, stop, target — and most importantly, a reason.
“Gold is rising, can’t you see?” is not a reason. It’s FOMO.
________________________________________
If You Want to Be a Real Trader, Remember This
1. The market has two directions, even when it looks like it only has one.
2. In aggressive trends, even my cat becomes a great trader.
3. Every trade must have a clear reason. If it doesn’t, and you enter just because “it’s going up”, that’s FOMO — and we all saw what happened to crypto in 2021. People are still waiting for the mythical altcoin season, while some are still 70- 90% down on the bag
4. We’re all geniuses after seeing the chart: “should’ve bought there, closed there…”
5. The only real truth is in your equity — and mine is higher, even though I’ve been selling.
6. I can guarantee there are gold bulls reading this right now who lost money on long positions over the past month.
7. In the end, it all comes down to money management and timing.
________________________________________
Conclusion:
Trading isn’t about being bullish or bearish.
It’s about being disciplined, timing and money management; the rest is can-can, and "I told you so"
P.S. Once again, I’m looking to sell — and if it works out like my last five trades, that’s perfectly fine with me.
At the club, they don’t ask whether I paid for my champagne with profits from buying or selling gold. 🍾

Gold - The most obvious top!🪙Gold ( TVC:GOLD ) will reverse soon:
🔎Analysis summary:
After we witnessed a major breakout back in 2024, Gold has been rallying about +120% ever since. However, Gold is now approaching a monster resistance trendline of the long term rising channel. It is really just a matter of time until Gold will create its official top.
📝Levels to watch:
$4,500
SwingTraderPhil
SwingTrading.Simplified. | Investing.Simplified. | #LONGTERMVISION

New zone for xauusd Gold (XAU/USD) is showing strong bullish momentum, trading around 4164 with potential continuation toward the 4236 resistance. Price may retest the fair value zone near 4150 before pushing higher, while support remains around 4091.

Gold Extends Its 8-Week Winning Streak👋Hello everyone, what are your thoughts on OANDA:XAUUSD ?
Over the past week, gold prices climbed close to the $4,400 mark before pulling back sharply and closing the week around $4,250, up $223 from the weekly open of $4,022 — nearly a 6% gain, marking the eighth consecutive week of growth. Despite the volatility, Main Street investors remain confident that the precious metal will continue to rise this week.
Trade tensions and geopolitical uncertainties have been the key drivers supporting gold’s rally. Meanwhile, the Fed’s rate cut and the U.S. government shutdown have strengthened the dollar while simultaneously providing support for gold prices.
At the time of writing, gold is fluctuating around $4,255, showing little change since the start of the session. Overall, the bullish trend remains intact, and as long as the confluence zone holds, buying opportunities are still favored.
What about you — what’s your outlook on XAUUSD? 💬Share your thoughts in the comments below, and let’s discuss!
Good luck!
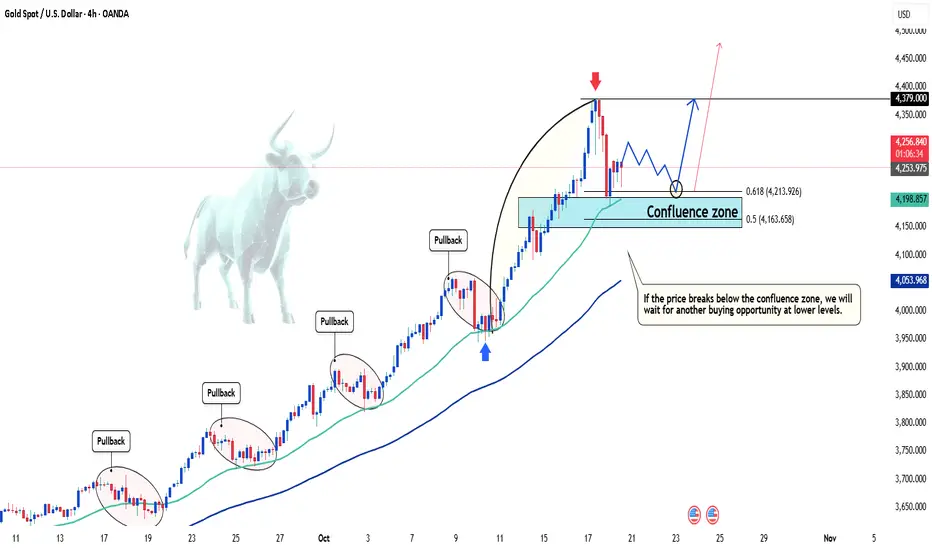
Lingrid | GOLD Weekly Analysis: Pullback From Record HighsThe price perfectly fulfilled my previous weekly idea . OANDA:XAUUSD market continues to navigate through considerable volatility as it pulls back from the recent spike that tested zone below the $4,400 resistance zone. After achieving a new all-time high, the metal is now experiencing natural selling pressure and technical correction, bringing some gravitational force into the equation. Despite this near-term weakness, the underlying trend structure remains constructively bullish, suggesting any substantial decline could present attractive entry opportunities for those seeking value.
The technical landscape reveals gold trading within a well-defined upward channel that has guided the rally since late September. The recent rejection from resistance has brought price action back toward the mid-channel area around $4,200, which aligns with the previous Monday high below and represents a crucial inflection, optimal entry point. The triangle pattern that formed during the consolidation phase earlier in the trend provided the springboard for the explosive breakout, and now the market may repeat this pattern, creating continuation formation.
The key support zone sits at $4,130-$4,135, and holding above this level would keep the bullish structure intact for another potential test of $4,400 and beyond toward the $4,500 projection zone. However, failure to hold could trigger deeper correction toward the lower channel boundary near $4,000 or even the stronger support at $3,730-$3,780, which would actually offer more compelling risk-reward for strategic accumulation. The coming week will clarify whether this represents healthy digestion or something more corrective in nature.
If this idea resonates with you or you have your own opinion, traders, hit the comments. I’m excited to read your thoughts!

Gold ready for retest ath 4380Gold (XAU/USD) showing bullish reaction from the support trendline. The circled candle indicates buyer strength, suggesting a possible recovery toward 4279–4380 resistance levels.
Support Trend Line:
Shows long-term bullish structure — price respecting the ascending trendline.
Support Zone (4181 – 4253):
Key demand area where buyers are stepping in to defend the trend.
4279 Level:
Immediate resistance; a breakout above could confirm short-term bullish momentum.
4313 Level:
Next resistance target after 4279; possible area for partial profit-taking.
4380 Level (ATH Retest):
Major resistance zone — potential final target if bullish move continues.
Indicates buyer reaction at the trendline, signaling possible reversal toward 4279.

GOLD → After the pullback, growth may continue. 4250 - 4300?FX:XAUUSD continues to break records, approaching the $4,200 level amid escalating trade tensions and expectations of Fed policy easing. A correction is forming before the possible continuation of growth...
Key growth drivers: Trump is considering a ban on Chinese vegetable oil imports, and the parties are imposing reciprocal port fees. The probability of a Fed rate cut in October and December exceeds 90%, despite Powell's cautious comments. The current correction in gold is seen as a buying opportunity.
Growth to $4250+ will continue if trade tensions persist and the Fed maintains its dovish rhetoric.
Resistance levels: 4200, 4218, 4250
Support levels: 4179, 4166, 4155
A pullback is forming. A false breakdown of the specified support zone could support further growth, provided that the bulls hold their defense above the specified levels. The market remains bullish and aggressive, and there are currently no technical or fundamental reasons for a deep correction
Sincerely, R. Linda!

Gold Holds Above the Cloud – Bulls Wait for Confirmation PushHello everyone,
Gold continues to maintain a constructive structure after its strong recovery from the 4,100 USD zone, currently trading around 4,345 USD/oz on the H4 chart. Technically, the bullish structure remains intact as previous Fair Value Gaps (FVG) below price are still unfilled and price continues to respect the upper boundary of the Ichimoku cloud (Kumo). As long as price stays above 4,300 USD, upside potential toward 4,400–4,450 USD remains valid. However, a healthy retest toward 4,200–4,100 USD (overlapping FVG + lower Kumo boundary) should not be ruled out as part of liquidity collection.
On the macro side, fundamentals continue to support the bullish bias. Reuters reported gold gained over 2% in the latest session as markets increased bets on Fed rate cuts amid cooling economic signals in the US. Concerns over a potential US government shutdown also boosted demand for safe-haven assets. HSBC recently raised its gold forecast for 2025–2026, citing strong central bank accumulation, while Goldman Sachs emphasised that this rally is driven by genuine capital flows—not emotional fear. Financial Times, however, noted that the “debasement trade” effect (gold rising strongly due to a weaker USD) has yet to fully ignite, suggesting the uptrend still has room to extend.
I remain bullish overall. Above 4,300 USD, buying pullbacks remains my preferred strategy, targeting 4,400–4,450 USD initially and potentially 4,500 USD if momentum strengthens. A dip towards 4,200 USD would not negate the trend—instead, it would provide a better accumulation opportunity. If trading this setup, I would protect long positions with a stop-loss below 4,200 USD given upcoming high-impact events such as US GDP, CPI and Fed speeches.
In short, gold continues to follow a medium-term uptrend. Rather than chasing tops, it is wiser to wait patiently for clean entry points and trade with the trend, not against it.

#XAUUSD: Massive Drop Is In Making! Bears In ControlDear all,
We are seeing significantly increased bearish volume since yesterday now we think price is likely to remain bearish for couple of days or week so price could make major correction. Please wait for price to settle down.
Good Luck
Team Setupsfx_

Gold 1H – Bullish Rebound After Strong Correction🟡 XAUUSD – Intraday Trading Plan | by Ryan_TitanTrader
📈 Market Context
Gold is attempting to rebound near $4,320 after a sharp correction earlier this week, as traders weigh the recent pullback in U.S. Treasury yields and renewed expectations of a dovish Federal Reserve tone.
Markets are now positioning ahead of key U.S. housing and manufacturing data, which could shape short-term sentiment for both the dollar and real yields.
• Softer economic numbers may reinforce the case for policy easing in early 2026, supporting gold’s safe-haven appeal.
• Conversely, stronger data could momentarily pressure XAUUSD, yet the broader uptrend remains intact amid central-bank accumulation and geopolitical tension.
Expect a liquidity-driven environment, with price potentially sweeping lower before reclaiming bullish momentum.
🔎 Technical Analysis (1H / SMC Style)
• Structure: Overall bias remains bullish following consecutive Breaks of Structure (BOS) and a confirmed Change of Character (ChoCH) indicating corrective retracement.
• Discount Zone: The $4,270–$4,272 demand area sits within the discount zone of the recent range (swing low to 4454 high), ideal for re-accumulation.
• Liquidity Sweep: Recent wicks near $4,300 suggest liquidity has been collected, potentially setting up for another bullish push.
• Premium Zone: Upside liquidity clusters near $4,454–$4,452, aligning with a premium supply area where short-term selling may appear.
🔴 Sell Setup
• Entry: 4454 – 4452
• Stop-Loss: 4463
• Take-Profit Targets: 4400 → 4330
🟢 Buy Setup
• Entry: 4270 – 4272
• Stop-Loss: 4260
• Take-Profit Targets: 4340 → 4380 → 4450 +
⚠️ Risk Management Notes
• Wait for M15 BOS/ChoCH confirmation before triggering entries.
• Avoid entries during high-volatility windows around U.S. data releases.
• Secure partial profits near intermediate liquidity zones, trail stops after BOS confirmation.
✅ Summary
Gold maintains a bullish re-accumulation structure following a healthy correction.
A retest into the discount zone around $4,270 offers potential long entries targeting the premium zone near $4,450+.
Only a decisive break below $4,260 would invalidate the intraday bullish scenario.
FOLLOW RYAN_TITANTRADER for more SMC trading insights ⚡

GOLD: STOP TRADING GOLD TODAYGOLD: STOP TRADING GOLD TODAY
Yesterday gold hit a new record high of 4380.
The price went up for no reason in an exponential way.
I have no idea what is going on because these crazy moves are not related to normal market conditions. It is impossible to be a normal market and go up like this moreover, at a time that we don't have any news.
If you made profits, then well done:)
I think everyone should at least stop trading gold today. We could also face some aggressive sell-off that could come out of nowhere.
⚠️Gold could also rise further but I don't believe to this market anymore.
⚠️Yesterday we had movements also on the currency pairs and that are going on also today for no reasons. I can't explain and I couldn't find any news related to the movements.
The only thing that can be read is that the FED will lower interest rates and it will not lower them. Just nonsense. All major economies lowered interest rates and nothing happened. Why this pointless focus only on the US dollar? Just manipulation to hide the real truth behind these transactions.
You may find more details in the chart!
Thank you and Good Luck!
❤️PS: Please support with a like or comment if you find this analysis useful for your trading day❤️

Gold: Watch for a corrective pullback toward 4,230Price was in a strong bullish trend. However, momentum started to fade as price created a double top pattern, a classic signal of buyer exhaustion.
After the second top, sellers stepped in aggressively, breaking below the neckline, confirming a shift in market structure from bullish to bearish. This breakdown accelerated as trapped buyers began exiting their positions, fueling a sharp decline.
From here, a short-term bullish pullback may develop, buyers could push price back toward the 4,230, aligning with the 0.5–0.618 Fibonacci retracement zone.

THE KOG REPORTTHE KOG REPORT:
In last week’s KOG Report we gave the bias level as bullish above 4003 and the red box we would be looking for to break to then confirm the move into the region we wanted. The move played well from the opening going on to complete all the red box targets together with our algo targets on gold.
Although it being risky we wanted to short from the given region, but due to price breaking through without even halting, we updated traders with the higher region we were looking to target, which also worked well.
On Friday, we managed to identify the pattern we wanted and activated a target of 4197 together with the break below the bias level. This for us again worked well to end the week with a wonderful short and then a TAP AND BOUNCE from the indicator level giving those who missed the short and opportunity to capture a 200pip long to end the week.
A phenomenal week in Camelot, not just on Gold but the many other pairs we trade and analyse.
So, what can we expect in the week ahead?
So, this week I have a bit of a concern with this bearish move. I have a sneaky suspicion that they may not have completed upside as yet, and instead, want to get traders in to thinking the retracement has started. Just a inkling for now so let’s see how the week opens and what region we attack first.
Above, I have a reversal on the hourly and the 4H chart but the daily, weekly and monthly are still suggesting higher pricing. Ideally, we need another bearish day for price to leave the 4200’s and come close to the 4150 level to hold before we decide we’re going to either consolidate and accumulate here or get a deeper pull back. Below, we have 4220 which is the level that will need to break for us to go lower with the initial target below being 4165 and below that 4129.
Our key level here initially is the 4295 level and above that 4310. 4310 is the line in the sand for bulls to attempt to break to go higher and complete the move back above to create another all time high. Failure, and we should get more confirmation of a deeper pull back that should attempt to target the lower 4000 mark.
As usual, we’ll let the algo confirm the move, the indicators will tell us which way to stay in, and the liquidity indicator will tell us when to play caution. For now, the path is on the chart, let’s see how we open and begin the week.
KOG’s bias of the week:
Bullish above 4230
Bearish below 4220
RED BOXES:
Break above 4255 for 4265, 4270, 4284 and 4304 in extension of the move
Break below 4237 for 4230, 4220, 4210, 4206, 4185 and 4177 in extension of the move
Please do support us by hitting the like button, leaving a comment, and giving us a follow. We’ve been doing this for a long time now providing traders with in-depth free analysis on Gold, so your likes and comments are very much appreciated.
As always, trade safe.
KOG
