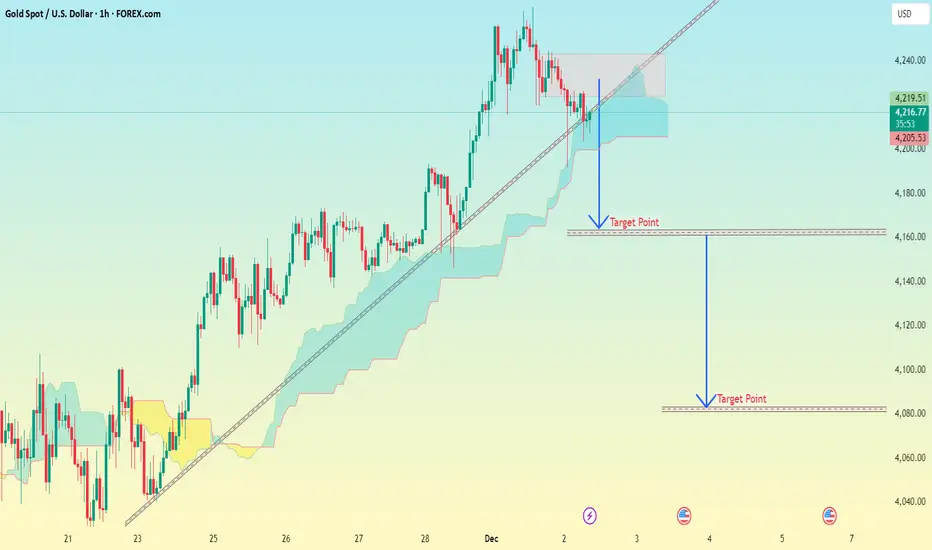
Xauusd 1H chart Pattern..Here is a clean professional analysis with accurate targets based on the chart I'm shared (trendline break + cloud retest + liquidity zones):
---
📉 XAUUSD Analysis & Targets
Market Structure
Price broke the ascending trendline
Currently retesting the cloud support zone
Sellers are strong from 4235–4245 supply zone
Liquidity is resting below 4180 & 4160
---
🎯 Target Levels (Based on Analysis)
🔻 TP1: First Breakdown Target
4185 – 4178
Reason: First liquidity pocket + trendline retest.
---
🔻 TP2: Major Support Target
4165 – 4155
Reason: Imbalance fill + cloud lower band + horizontal demand.
---
🔻 TP3: Extended Drop Target
4120 – 4105
Reason: Large imbalance area + my lower drawn target zone.
---
🔻 TP4 (Deep Target / Final)
4095 – 4085
Reason: Strong historical demand + liquidity sweep zone.
---
📌 Summary
Target Level
TP1 4185–4178
TP2 4165–4155
TP3 4120–4105
TP4 4095–4085
Trade ideas
GOLD Resistance Ahead!
HI,Traders !
#GOLD keeps growing
But will soon hit a horizontal
Resistance of 4229.11
So after the retest we will
Be expecting a local
Bearish correction !
Comment and subscribe to help us grow !

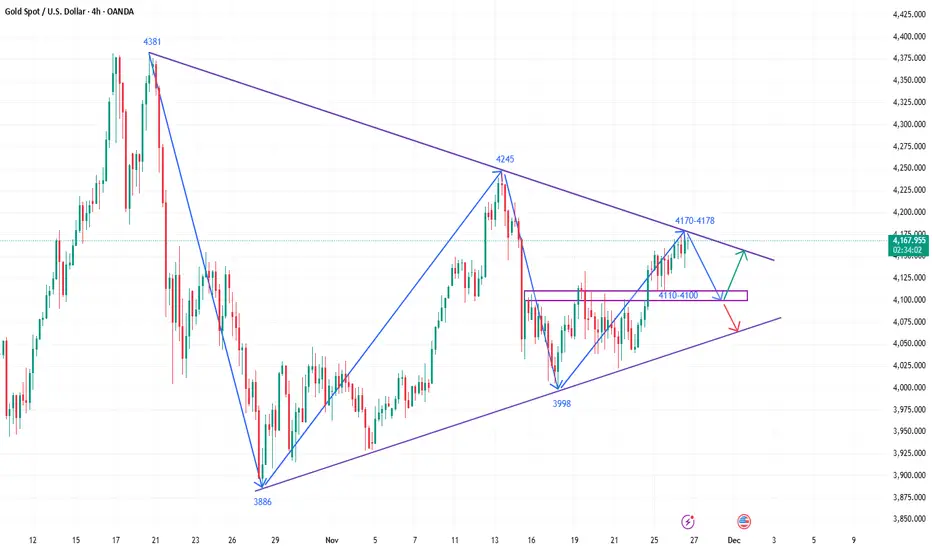
How to grasp the convergence of the golden triangle pattern?Gold Price Trend Analysis: After rising on Monday, gold closed with a doji on Tuesday and continued its upward trend today, reaching a high of around 4173. Overall, the market remains relatively strong. On the larger timeframe, the weekly chart shows solid support at the MA10 level, while the daily chart shows a tendency to form a triangle pattern. The upper edge of this triangle, around 4170-4180, will likely provide short-term resistance. Furthermore, considering the Thanksgiving holiday in the US market later this week, market activity is expected to be low. Therefore, range-bound trading is currently a suitable strategy for gold, but it may not be ideal for trading. This special timeframe could easily trigger a high degree of market manipulation, leading to abnormal price fluctuations.
Gold Technical Analysis: Looking at the 4-hour chart, the triangle consolidation pattern for gold remains unchanged. The downward trendline resistance is around 4170-4180. Only a decisive break above this trendline resistance will allow for further upward movement and a new round of opportunities. Otherwise, it will remain in a consolidation phase. On the 1-hour chart, gold is expected to continue its high-level consolidation today. The key support level to watch is the 5- and 10-day moving averages around 4110-4100. On the upside, the first resistance level to watch is 4170-4180. The possibility of testing 4200 depends on both technical and fundamental factors. Specifically, if gold holds above the moving averages throughout the second half of the week and provides further bullish fundamental catalysts, it might attempt to reach 4200 in the second half of the week. However, the uncertainty brought by the holiday season should be carefully considered in the second half of the week. In summary, today's gold trading strategy is to primarily sell on rallies and secondarily buy on dips. The key resistance level to watch in the short term is around 4170-4180, while the key support level is around 4110-4100. Traders must follow the trend, manage their positions and stop-loss orders carefully, strictly set stop-loss orders, and avoid holding losing positions.
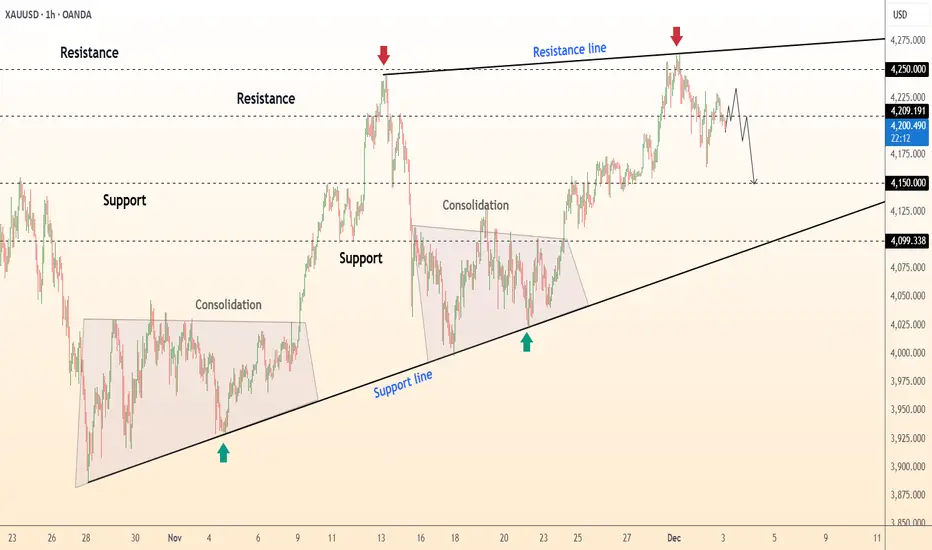
DeGRAM | GOLD is correcting from the resistance line📊 Technical Analysis
● XAU/USD rejected the upper resistance line three times, forming a clear bearish reaction near 4250. Price is losing momentum and sliding back toward the mid-range support after failing to sustain highs.
● Repeated consolidations along the rising support line show weakening bullish pressure, increasing the probability of a corrective drop toward 4150–4100.
💡 Fundamental Analysis
● Gold softens as U.S. yields rebound and Fed officials signal that policy easing is not imminent, limiting upside appetite.
✨ Summary
● Bearish bias below 4250. Targets: 4150 → 4100. Resistance: 4250. Support: 4150 / 4100.
-------------------
Share your opinion in the comments and support the idea with a like. Thanks for your support!
GOLD BEARS WILL DOMINATE THE MARKET|SHORT
Hello, Friends!
GOLD is making a bullish rebound on the 4H TF and is nearing the resistance line above while we are generally bearish biased on the pair due to our previous 1W candle analysis, thus making a trend-following short a good option for us with the target being the 4,132.94 level.
Disclosure: I am part of Trade Nation's Influencer program and receive a monthly fee for using their TradingView charts in my analysis.
✅LIKE AND COMMENT MY IDEAS✅

GOLD ALERT: Sharp and Clean Sell OutlookHello my friends. Without wasting any time, I’m sharing my concise and clear bearish outlook with you.

GOLD (XAUUSD): Another BoS
A quick follow-up for the yesterday's post for Gold.
The price successfully bounced and broke another intraday resistance,
setting one more local higher high on a 4H.
The market will most likely continue rising following the plan
and reach 4205 soon.
❤️Please, support my work with like, thank you!❤️
I am part of Trade Nation's Influencer program and receive a monthly fee for using their TradingView charts in my analysis.

GOLD 4H CHART ROUTE MAP UPDATE & TRADING PLAN FOR THE WEEKHey Everyone,
Please see our updated 4h chart levels and targets for the coming week.
We are seeing price play between two weighted levels with a gap above at 4124 and a gap below at 4042. We will need to see ema5 cross and lock on either weighted level to determine the next range.
We will see levels tested side by side until one of the weighted levels break and lock to confirm direction for the next range.
We will keep the above in mind when taking buys from dips. Our updated levels and weighted levels will allow us to track the movement down and then catch bounces up.
We will continue to buy dips using our support levels taking 20 to 40 pips. As stated before each of our level structures give 20 to 40 pip bounces, which is enough for a nice entry and exit. If you back test the levels we shared every week for the past 24 months, you can see how effectively they were used to trade with or against short/mid term swings and trends.
The swing range give bigger bounces then our weighted levels that's the difference between weighted levels and swing ranges.
BULLISH TARGET
4124
EMA5 CROSS AND LOCK ABOVE 4124 WILL OPEN THE FOLLOWING BULLISH TARGETS
4212
EMA5 CROSS AND LOCK ABOVE 4212 WILL OPEN THE FOLLOWING BULLISH TARGET
4328
EMA5 CROSS AND LOCK ABOVE 4328 WILL OPEN THE FOLLOWING BULLISH TARGET
4422
EMA5 CROSS AND LOCK ABOVE 4422 WILL OPEN THE FOLLOWING BULLISH TARGET
4494
BEARISH TARGETS
4042
EMA5 CROSS AND LOCK BELOW 4042WILL OPEN THE FOLLOWING BEARISH TARGET
3964
EMA5 CROSS AND LOCK BELOW 3964 WILL OPEN THE FOLLOWING BEARISH TARGET
3873
EMA5 CROSS AND LOCK BELOW 3873 WILL OPEN THE SWING RANGE
3767
3646
As always, we will keep you all updated with regular updates throughout the week and how we manage the active ideas and setups. Thank you all for your likes, comments and follows, we really appreciate it!
Mr Gold
GoldViewFX

4100 Zone Protected: Eyes Now on the Symmetrical Trendline📌 Yesterday’s Outlook – What Happened
In my yesterday's analysis, I highlighted that Gold turned bullish the moment price broke above resistance, shifting the entire short-term structure in favor of the buyers. I also mentioned that 4100–4110 is the key zone where bulls should stay active.
During yesterday’s session, the market validated this view:
🔹 Price dipped into 4100–4110 three separate times,
🔹 Each dip was defended aggressively,
🔹 And eventually Gold pushed into a new intraday high.
This shows clear buyer interest and confirms that the zone is currently acting as strong demand.
❓ Key Question Today
Has Gold built enough momentum to break the falling trendline of the symmetrical triangle that started from the all-time high?
This trendline is the major short-term decision area. What happens here will set the tone for the next leg.
📉 Why the Trendline Matters & What Comes Next
Gold is now pressing directly into the falling trendline of the larger symmetrical triangle structure.
This zone is crucial because:
1. It’s the first major dynamic resistance since ATH.
2. A break above it would CLEARLY shift the medium-term bias back in favor of the bulls.
3. Momentum is building — dips are being bought with consistency.
4. Buyers have defended yesterday’s lows multiple times.
If the trendline breaks cleanly, the door opens toward the 4250 zone.
That’s the next logical magnet for price.
📈 Trading Plan – Still a “Buy-the-Dip” Market
As long as yesterday’s lows remain intact, the structure stays bullish.
🟢 Smart play: Buy dips into intraday support levels
🔒 Invalidation: A break below yesterday's low
🎯 Upside focus: Trendline break → 4250
Until the market shows a reason to flip, momentum is in favor of the bulls.
🚀 Let’s see if Gold has the strength to break that trendline today.

XAUUSD_15MGold Analysis
Short Time
Elliott Wave Analysis Style
The market can enter five waves of ascent by crossing the number 4155 and move towards the $4200 area

XAU/USD — Market Blueprint > Bullish Road Ahead📊 Asset:
XAU/USD – “Gold vs U.S. Dollar”
Metals Market Opportunity Blueprint — Swing Trade Outlook
📈 Plan:
Bullish Bias (Swing Trade Setup) ✨
Gold continues to hold strong above major structural support, reflecting continued demand during USD volatility and broader risk hedging.
🎯 Entry Zone:
Any active market level based on your strategy
(Traders may enter on dips, breakouts, or momentum confirmation. Adapt to your preferred model.)
🛑 Stop Loss (Risk Control):
This is my SL: 4140.00
Dear Ladies & Gentlemen (Thief OG’s), kindly adjust your stop loss according to your strategy, account size, and personal risk management.
⚠️ Note: I am not recommending you use only my SL. Always manage your own risk—your money, your rules.
🎯 Target (Take Profit):
Primary Target: 4350.00
Price is approaching a major resistance zone, entering overbought conditions, and potential liquidity traps may form.
Be alert and secure profits when the market gives them.
⚠️ Note: Dear Ladies & Gentlemen (Thief OG’s), I am not recommending you use only my TP. Your exit depends on your own rules and risk appetite.
📡 Correlated Pairs to Watch (USD & Metals Market)
Tracking related instruments helps confirm direction, detect fakeouts, and build higher-conviction entries.
1️⃣ DXY (U.S. Dollar Index)
Gold moves opposite the dollar
Falling DXY = bullish support for XAU/USD
Watch for divergence between DXY strength and gold price action
2️⃣ XAG/USD (Silver)
Silver often moves ahead of gold in momentum shifts
Strong silver breakout = supportive signal for gold continuation
3️⃣ USD/JPY
Risk sentiment + yield fluctuations influence gold
Weak USD/JPY sometimes signals softer USD → bullish for gold
4️⃣ US10Y (U.S. 10-Year Treasury Yield)
Gold rises when bond yields drop
Falling yields = reduced opportunity cost → boosts gold attractiveness
5️⃣ SPX / NASDAQ
Equities sell-offs often push liquidity into gold
Risk-off flows = bullish gold environment
🔍 Key Market Notes:
Gold remains a preferred hedge while markets digest macro uncertainty
Overbought structure near resistance—tight management recommended
Liquidity zones ahead may trigger fake breakouts before true moves
Bullish continuation remains valid above key swing support

Recovery - Gold price continues to increase above 4200✍️ NOVA hello everyone, Let's comment on gold price next week from 12/01/2025 - 12/05/2025
⭐️GOLDEN INFORMATION:
Gold (XAU/USD) pulls back from its two-week high near $4,200 in early European trading on Friday, sliding toward the lower end of its intraday range. A firmer US Dollar—extending its rebound from a one-and-a-half-week low—combined with upbeat equity sentiment is redirecting flows away from the safe-haven metal.
⭐️Personal comments NOVA:
Gold prices continue to recover as December rate cut odds increase: heading towards resistance 4244, 4356
🔥 Technically:
Based on the resistance and support areas of the gold price according to the H4 frame, NOVA identifies the important key areas as follows:
Resistance: $4244, $4356
Support: $4145, $4089
🔥 NOTE:
Note: Nova wishes traders to manage their capital well
- take the number of lots that match your capital
- Takeprofit equal to 4-6% of capital account
- Stoplose equal to 2-3% of capital account
- The winner is the one who sticks with the market the longest

Gold price tries to return to 4194⭐️GOLDEN INFORMATION:
Gold (XAU/USD) edges lower in Thursday’s Asian session, slipping from Wednesday’s near two-week high, though losses remain limited. Expectations of lower US rates and optimism over a potential Russia-Ukraine peace deal are supporting broader risk sentiment, diverting some flows away from safe-haven gold amid light Thanksgiving-thinned trading
⭐️Personal comments NOVA:
maintain uptrend above 4100, continue to accumulate and try to return to 4194. Market is optimistic about December interest rate
⭐️SET UP GOLD PRICE:
🔥SELL GOLD zone: 4193 - 4195 SL 4200
TP1: $4180
TP2: $4170
TP3: $4150
🔥BUY GOLD zone: 4063 - 4061 SL 4056
TP1: $4078
TP2: $4090
TP3: $4108
⭐️Technical analysis:
Based on technical indicators EMA 34, EMA89 and support resistance areas to set up a reasonable BUY order.
⭐️NOTE:
Note: Nova wishes traders to manage their capital well
- take the number of lots that match your capital
- Takeprofit equal to 4-6% of capital account
- Stoplose equal to 2-3% of capital account

GOLD cut n reverse region? What's next??#GOLD.. perfect move as per our last couple of ideas regarding gold.
Now market current and immediate supporting region will be from 4205 to 4210 around
That region will be our most important supporting region and our cut n reverse region as well.
Keep close and stay sharp guys.
NOTE: we will goe for cut n reverse below 4205 on confirmation.
Good luck
Trade wisley

XAU/USD ANALYSIS 27-11-2025:Gold (XAU/USD) attracted some selling during Thursday's Asian session and erased some of the previous day's gains to hit its highest in nearly two weeks.
The prospect of lower US interest rates, along with hopes of a peace deal between Russia and Ukraine, has continued to support bullish market sentiment. This, in turn, is believed to have prompted some outflows from safe-haven bullion amid relatively low trading volumes following the US Thanksgiving holiday.
The chart is showing:
Price is inside a triangle compression with 2 converging trendlines.
Current price zone is right next to the upper downtrend line → short-term selling pressure is still present.
The area you marked Weak High shows that the most recent peak is not strong enough to confirm a new uptrend.
Resistance zone above the current price
Located around 4,165 – 4,185
→ This is the area with seller liquidity + the point of touching the downtrend line.
→ There will likely be a strong reaction if the price retests.
Nearest support zone
Smaller yellow zone: 4,130 – 4,140
Larger green zone: 4,095 – 4,110
Strong Low below 4,050 → final support.
If the price breaks 4,130, it will likely go straight to the green zone of 4,095 - 4,110.
Gold Trading Plan on November 27.
👉 Watch to BUY Gold 4123- 4128 SL 4120, TP 4148 - 4163 - Hold 4200.
👉 Watch to SELL Gold 4180- 4188, SL 4193, TP 4152 - 4130 - Open.

GOLD BIGGEST FALL COMING ? IS THE END OF BULL RUN ? GOLD H1 !!Greetings
Gold H1 Time Frame We Have A Strong Selling Zone On Multi Time Frames And Gold Has Gaves Us Confirmation For Sell , It Has Respected The Selling Zone And Gold Price Gives Rejection From Selling Zone Now We Have To Sell Gold With A Confirmation Patterns And Structures Target Will Be Sell Side Liquidity
200 / 500 Pips Move We Need To Capture, Pending Sell Side Liquidity
Gold Buying Zone

Gold Early-Week Long Setup — Sharp Pullback → Swift Upside MoveGold closed the week and month with strong bullish momentum. Historically, this often leads to a swift early-week continuation move if we get a tradable pullback.
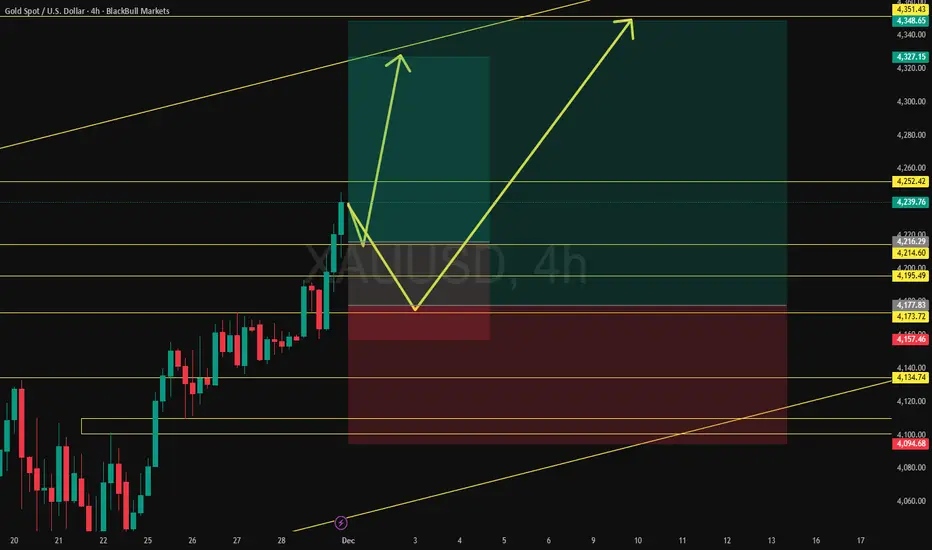
XAUUSD – Bullish Ascending Triangle Ready for Breakout After a strong impulsive move from 3,600 to 4,250, Gold is now consolidating inside a clear ascending triangle on the 4H timeframe.
Key observations:
Higher lows are perfectly respected along the rising yellow trendline
Upper resistance (blue descending line) is getting tighter → classic compression
Multiple tests of the 4,000 psychological zone turned it into strong support
Bullish scenario
Break and 4H close above 4,165–4,175 → triggers triangle breakout
Target 1: 4,200
Target 2: 4,250 (recent swing high)
Target 3: 4,300+ (measured move)
Stop-loss below 3,980 (invalidates the triangle)
Risk/Reward → 1:1.8 to 1:3 depending on scaling Bearish invalidation only on decisive break below 4,000 with volume (then target 3,880–3,800). Until then, bias remains firmly bullish. Watching for post-Thanksgiving momentum on Friday.
Long setup active.
#XAUUSD #Gold #Bullish

Gold: eyeing breakout levels?After some consolidation, the price of gold continued its rally on Friday, closing the week at $4.230. The latest move was triggered by investors' expectations that the Fed might cut interest rates, two weeks from now, by another 25 basis points. Also investors' sentiment is turned toward the expectation that the economic output in 2026 will be lower. Analysts are also noting that the demand for gold has weakened among Asia retail buyers, considering its all time highest levels.
During the week, the RSI was slowly moving toward the overbought market side. The indicator reached the level of 63 at Friday's trading session, leaving some space for the upside until the clear overbought market side is reached. The MA50 and MA200 continue to move without a change, as two parallel lines with an uptrend.
Current charts are showing that the price of gold has some space to move toward the upside, until the peak from id-November is reached, at the level of $4.240. In case that this level is breached, then the gold will continue toward the latest ATH at $4.377. In case of a short-term reversal, the trend line bottom currently stands around $4.100. For the week ahead, both levels are open, based on the current charts.

GOLD – TECHNICAL UPDATE | Watching 4243 for DirectionGOLD – Technical Outlook
Gold is trading near six-week highs around $4,260, supported by strong expectations of a Federal Reserve rate cut.
Markets are currently pricing an 88% probability of a December cut, while the U.S. dollar is heading for its worst weekly performance in four months after failing to hold above 101.
A break of trend support in the dollar index could deepen the decline, providing additional bullish momentum for gold.
Today’s focus turns to the ISM Manufacturing PMI.
Weaker-than-expected data could pressure the dollar further and reinforce gold’s upside momentum ahead of the upcoming Fed meeting.
Overall, gold maintains a strong upward trend, underpinned by expectations of looser monetary policy.
Technical Analysis
A retest of 4243 remains possible before gold resumes its bullish trend.
However, a 1H close below 4243 would signal a deeper correction toward 4228 and potentially 4207.
If price holds above 4243, gold may continue consolidating between 4245 and 4207 until a breakout is confirmed.
A 1H close above 4265 will strengthen the bullish scenario, targeting 4300 and then 4323.
Pivot Line: 4243
Support: 4228 · 4207 · 4190
Resistance: 4265 · 4300 · 4323

Gold prices continue to recover 4277⭐️GOLDEN INFORMATION:
Gold (XAU/USD) trades firmer near $4,230 in early Asian hours on Monday, supported by rising expectations of a Fed rate cut in December. Markets now look ahead to Monday’s US ISM Manufacturing PMI for further direction.
Speculation of continued Fed easing remains a key driver for gold, with weaker US data and dovish comments from policymakers boosting bets on a December cut. The CME FedWatch Tool now shows an 87% probability of a rate reduction at the December 9–10 meeting, up from 71% last week. Lower rates reduce the opportunity cost of holding non-yielding gold, further supporting the metal
⭐️Personal comments NOVA:
Continued recovery momentum - gold price maintained its increase above 4205. Bulls believe in the last rate cut in December 2025
⭐️SET UP GOLD PRICE:
🔥SELL GOLD zone: 4275 - 4277 SL 4282
TP1: $4260
TP2: $4245
TP3: $4230
🔥BUY GOLD zone: 4195 - 4193 SL 4188
TP1: $4210
TP2: $4225
TP3: $4240
⭐️Technical analysis:
Based on technical indicators EMA 34, EMA89 and support resistance areas to set up a reasonable BUY order.
⭐️NOTE:
Note: Nova wishes traders to manage their capital well
- take the number of lots that match your capital
- Takeprofit equal to 4-6% of capital account
- Stoplose equal to 2-3% of capital account

XAUUSD H1🟡 XAUUSD H1 — Technical Outlook
1. Market Context
Price recently rejected from the 4267–4270 supply zone (red zone).
Strong downward leg into a bullish reaction from the 0.786 Fibonacci and key support zone around 4186–4180.
A clear liquidity sweep under the previous swing low → price printed a long wick and bounced sharply.
2. Key Technical Levels
Support Zones
4186 – 4180 (0.786 Fibo + Demand + FVG touch) → strong reaction area.
4165 – 4170 deeper liquidity pool (0.9 extension).
Resistance Zones
4219 – 4225
4260 – 4270 (major supply, previous distribution block)
4295 (projection target | -0.272 Fibo)
3. Structure & Liquidity
Price broke a short-term bearish trendline, signaling a potential shift.
Sharp bullish impulse suggests smart money buy orders filled at FVG (Fair Value Gap).
Market now forming a reversal structure:
Sweep → Pullback → Impulse.
4. Fibonacci & Projection
0.618 retracement sits around 4195–4200, aligning with a retest zone.
If price holds above 4190, bullish continuation is favored.
Target aligns with your chart’s projection:
→ 4290 – 4295 (-0.272 expansion)
5. Expected Price Path
Primary Bullish Scenario (favors chart direction)
✔️ Price retests 4195–4190
✔️ Forms bullish confirmation
➡️ Moves back to 4220 → 4260
➡️ Breaks supply → Target 4290–4295
Invalidation
❌ Break & close below 4178
➡️ Price may fall to 4165 before next bounce.
🎯 Summary
Bias: Bullish
Reason: Liquidity sweep + FVG fill + reaction from 0.786 + trendline break
Targets: 4220 → 4260 → 4290–4295
Critical Support: 4180 / 4178

Gold (XAUUSD) – 28 Nov | Key POI Zones in Focus🟡 Gold (XAUUSD) Analysis – 28 November
Hello Disciplined Traders,
Welcome to the Chart Is Mirror Community 👋
Market Context
• Gold continues in strong bullish momentum as the previous higher high 4173.5 has been taken out — confirming a new break of structure.
• As per our 26 Nov analysis , the 4142–4138 POI zone was respected and price delivered a strong rally toward the 4188 target , which was successfully achieved today.
• The M15 structure remains bullish and aligned with the H4 structure .
Key Observations
• A healthy pullback is expected before bullish continuation, as the next upside target is 4244.5 .
• Once price retraces into our POI zones, we will observe carefully to plan the next execution based on confirmation.
• Our first POI for long setup is the 4165–4162 zone .
• If respected with LTF bullish confirmation , we will execute a long setup accordingly.
• If price moves deeper, the next strong buy zone is the 4154–4149 zone .
• This will be our secondary long setup zone — only valid with confirmation.
Execution Plan
• Wait for retracement to 4165–4162 or 4154–4149 .
• No confirmation, no entry — stay aligned with structure.
• Upside continuation target remains 4244.5 .
• The market is very volatile — manage position size and risk accordingly .
Price returns to structure — patience returns the reward.
📘 Shared by @ChartIsMirror
