Trade ideas

Xauusd.Chart Pattern...✅ TARGET Visible on my XAUUSD Chart
I have one main target marked with a blue upward arrow:
📍 Target Point: ~ 4,240 – 4,245 USD
This is the horizontal zone I highlighted above the current price, likely projected from the previous range height.
📈 What the Chart Structure Suggests (Based on What my Drew)
Price is riding an ascending trendline.
It’s above the Ichimoku cloud, which I'm using as bullish confirmation.
Breakout from a consolidation box appears to be measured and projected upward → giving the ~4,240 target.

XAUUSD Possible continuation entries?Nothing major on Weekly, daily chart due to the impulsive bullish momentum on Gold.
Using the H12/H4 timeframe, price is in a bullish trend, I am currently expecting price to push higher and take out the daily high/ATH 4381.440.
Following the internal structure price did break above last LH created and formed a new HH which confirmed a shift in market trend. Price then pulled back into discounted levels around the 79.5% Fib level and weekly key level 3997.372, That's when we saw buyers stepping in again and pushed price higher and broke above the last HH created, which was also situated just below a key weekly level of 4259.577. This new HH is not confirmed yet, but I do expect price to push lower towards the marked OB if the new HH is confirmed.
That will be in discounted levels and just around a strong OB that caused last BOS and has clear IMB (4100-4025). I will be looking for longs targeting the daily HH/ATH.

Gold on expected upswingTechnical analysis: Gold is showcasing increasing Buying presence on Monthly chart as it is virtually unchanged (the #1M candle at # +2.74% currently) as Price-action is on parabolic uptrend within July’s High’s and October Low’s. This has effectively constructed an series of green candles on Daily chart hence the Neutral values on Hourly 1 chart which was an ideal Buying opportunity for Short-term Traders however Gold is struggling to stage more serious recovery even though we are already Trading above #4,100.80 benchmark comfortably. Personally I remain on Medium-term Buying set-up as Weekly chart (#1W) remains heavily Bullish indicating that the latest consolidation was simply another accumulation and distribution phase of the recently started Bull market. However the Price-action just touched the Weekly chart’s #4,171.80 Resistance and is currently Trading just below it.
My position: After Profiting on multiple Medium-term Buying orders, I have turned now to more Intra-day calls as announced and am Buying Gold literally from #4,138.80 on multiple occasions and will continue to do so, and will Buy Big if #4,130.80 is delivered. I will not Sell Gold and my practical suggestion is to not Sell Gold at all costs.


Gold Breakout, Record Highs in PlayGold has broken out of the bull pennant it’s been coiling within since late October, signalling a potential resumption of the prior bullish trend and a move back toward record highs. Bullish momentum is building, with RSI (14) pushing above 50 and MACD staging a bullish crossover, favoring long setups.
If the breakout holds, longs could be initiated above the downtrend with a stop beneath for protection, targeting 4245 initially—the high from November 13. Should the move extend beyond that level, the record highs may act like a magnet for price.
Good luck!
DS

Gold Trade Plan 26/11/2025Dear Traders,
Here’s the English translation:
“The price has reached the top of the descending channel in the 4160–4180 range. I expect a fake move upward, followed by a drop to the first level at 4080, and lower. If there is a daily close above the descending channel with a strong candle, the analysis will be invalidated.”
Regards,
Alireza!

BUY GOLD BUY!!!Xauusd have been on a bullish bias and have been swinging of my poi am looking forward to long gold from this zone after completing +150pips from my first entry am looking forward to see price revisit back to 4,186....

GOLD XAUUSD 60mins BUY Trade ForecastStalking Xau for a potential bullish movement.
All we need now as confirmation to proceed Long with gold on 15/60mins TF is t he inability of price to continue short beyond the drawn line as depicted on the chart.
Will update you once the ticks are green and ready for the launch.
:)

THE KOG REPORTTHE KOG REPORT:
In last week’s KOG Report we gave the potential path as well as the red box defence to look for any reaction in price. We managed to support the lower red box defence giving us a nice long to start the week then resulting in the higher defence holding and giving us an extremely decent short. It was only during the later part of the week we faced some choppy and whipsawing ranging which we decided wasn’t worth committing too much into, so we returned to scalping the red boxes only for the remainder of the week.
A decent week in Camelot, not only on Gold but the numerous other pairs we trade and analyse.
So, what can we expect in the week ahead?
It’s likely to be another week of choppy price action and potential for a range to develop even smaller than we’ve seen in previous sessions. We have the key level of support below again at 4040 while resistance above sits at key level of 4104. Economic news on Tuesday should bring volume and we would expect one of these levels to break open and the range to have accumulated enough to then move us into a clear direction.
We have added the red box defence up and down, ideally wanting a test of that low, so price going up on the open could represent opportunities to attempt the short unless defence is breached. Otherwise, we’ll look to take this into that 4000-3980 levels before we look for any RIPs.
RED BOXES:
Break below 4060 for 4055, 4050, 4041, 4033 and 4010 in extension of the move
Break above 4081 for 4095, 4103, 4120 and 4130 in extension of the move
Please do support us by hitting the like button, leaving a comment, and giving us a follow. We’ve been doing this for a long time now providing traders with in-depth free analysis on Gold, so your likes and comments are very much appreciated.
As always, trade safe.
KOG

How high will gold go next week How much room is there to go up?Gold Technical Analysis: Gold has seen several highlights this week, breaking through the 4200 mark again, a figure that has caused considerable panic. Coupled with consecutive daily gains and high-level consolidation, this is the first sign of a strong upward move. The daily chart shows a reversal from a bearish to a bullish pattern, and if this pattern continues for two more days, forming a consecutive bullish formation, it will likely evolve into a second upward move. On Friday, gold experienced a relatively strong surge, falling to a low of around 4153 and rising to a high of around 4226. Currently, the bullish trend remains unchanged, and pullbacks present opportunities to enter long positions. The next key resistance level to watch is around 4245; if this level holds, a short position can be considered before going long.
This week, the key resistance area for gold is around 4240-4250. If it can break through effectively, the price of gold is expected to further test the previous highs of 4300 and even 4380. On the downside, 4175-4160 has turned from resistance into the first strong support, and the more critical support is at the 4150 level, a trading zone between bulls and bears. From the 4-hour chart, the main support for the price is at 4200. As long as the market maintains its strong upward momentum, it will not retrace too deeply. Therefore, it is necessary to pay attention to the short-term bullish trend. On the hourly chart, the price rose from 4155, and after a retracement from 4170-4180, it rose to 4226. The bullish trend support is at 4155. As long as the price does not break 4155, it will continue to rise and move towards the 4240-4250 area. In summary, the recommended strategy for gold trading next Monday is to primarily buy on dips and secondarily sell on rallies. The key resistance level to watch in the short term is 4240-4250, while the key support level is 4180-4160. Please keep up with the pace of the market.
possible buy on goldprice has been consolidating around 4160 area,, so i am expecting more push to the higher price previously..

Gold buy ideaGold Analysis
Gold has been trading between 4167 and 4149 for the past 6 hours, building accumulation during NY Pre-Market and NY Open. A breakout from this zone can create a clean directional move.
How to Trade It
1️⃣ Wait for the 30m candle to close
This confirms whether price is breaking out of the accumulation range.
2️⃣ Breakout Condition
The 30m candle must close at least 30 pips above the previous candle to confirm momentum and continuation.
Targets
• TP1: 4167
• TP2: 4180
Invalidation
❌ If the candle closes below the previous candle or with less than a 30-pip range, do not take the trade — it does not meet the plan

Gold prices continue to recover 4277⭐️GOLDEN INFORMATION:
Gold (XAU/USD) trades firmer near $4,230 in early Asian hours on Monday, supported by rising expectations of a Fed rate cut in December. Markets now look ahead to Monday’s US ISM Manufacturing PMI for further direction.
Speculation of continued Fed easing remains a key driver for gold, with weaker US data and dovish comments from policymakers boosting bets on a December cut. The CME FedWatch Tool now shows an 87% probability of a rate reduction at the December 9–10 meeting, up from 71% last week. Lower rates reduce the opportunity cost of holding non-yielding gold, further supporting the metal
⭐️Personal comments NOVA:
Continued recovery momentum - gold price maintained its increase above 4205. Bulls believe in the last rate cut in December 2025
⭐️SET UP GOLD PRICE:
🔥SELL GOLD zone: 4275 - 4277 SL 4282
TP1: $4260
TP2: $4245
TP3: $4230
🔥BUY GOLD zone: 4195 - 4193 SL 4188
TP1: $4210
TP2: $4225
TP3: $4240
⭐️Technical analysis:
Based on technical indicators EMA 34, EMA89 and support resistance areas to set up a reasonable BUY order.
⭐️NOTE:
Note: Nova wishes traders to manage their capital well
- take the number of lots that match your capital
- Takeprofit equal to 4-6% of capital account
- Stoplose equal to 2-3% of capital account

XAU/USD Today's Market OutlookGold remains supported by expectations of a Federal Reserve rate cut in December, with markets pricing an 80–87% probability of easing. Lower interest rates reduce the opportunity cost of holding non-yielding assets like gold, fueling bullish sentiment.
Additionally:
US Dollar weakness and geopolitical uncertainty continue to underpin demand.
Central banks and ETFs maintain strong buying momentum, adding structural support.
Risks: A stronger-than-expected U.S. economic data release or hawkish Fed tone could trigger a pullback toward key supports.
Gold is currently consolidating near $4,200–$4,250, after hitting an all-time high of $4,381 in October. Analysts project a bullish medium-term outlook, with forecasts ranging between $4,450–$4,950 in 2026, driven by central bank diversification and potential Fed cuts.
The Asian session range (4215 – 4256) has set the tone for today’s trading.
Bullish Scenario
Price must hold above the previous month’s high at 4246 to confirm bullish continuation.
If this level holds, I’ll wait for a break above the double top at 4256 to enter long positions.
Targets:
First: 4300
Second: 4380
Bearish Scenario
The support belt at 4225 – 4230 is critical.
If this zone fails early in the New York session, expect a move to:
Invade the Asian session bottom (4215)
Then extend all the way toward 4155

XAUUSD H1🟡 XAUUSD H1 — Technical Outlook
1. Market Context
Price recently rejected from the 4267–4270 supply zone (red zone).
Strong downward leg into a bullish reaction from the 0.786 Fibonacci and key support zone around 4186–4180.
A clear liquidity sweep under the previous swing low → price printed a long wick and bounced sharply.
2. Key Technical Levels
Support Zones
4186 – 4180 (0.786 Fibo + Demand + FVG touch) → strong reaction area.
4165 – 4170 deeper liquidity pool (0.9 extension).
Resistance Zones
4219 – 4225
4260 – 4270 (major supply, previous distribution block)
4295 (projection target | -0.272 Fibo)
3. Structure & Liquidity
Price broke a short-term bearish trendline, signaling a potential shift.
Sharp bullish impulse suggests smart money buy orders filled at FVG (Fair Value Gap).
Market now forming a reversal structure:
Sweep → Pullback → Impulse.
4. Fibonacci & Projection
0.618 retracement sits around 4195–4200, aligning with a retest zone.
If price holds above 4190, bullish continuation is favored.
Target aligns with your chart’s projection:
→ 4290 – 4295 (-0.272 expansion)
5. Expected Price Path
Primary Bullish Scenario (favors chart direction)
✔️ Price retests 4195–4190
✔️ Forms bullish confirmation
➡️ Moves back to 4220 → 4260
➡️ Breaks supply → Target 4290–4295
Invalidation
❌ Break & close below 4178
➡️ Price may fall to 4165 before next bounce.
🎯 Summary
Bias: Bullish
Reason: Liquidity sweep + FVG fill + reaction from 0.786 + trendline break
Targets: 4220 → 4260 → 4290–4295
Critical Support: 4180 / 4178

Gold at Major Confluence Zone — 4170 is the Key Breakout LevelGold is currently testing a major confluence area formed by multiple structural levels.
Price is now touching:
The upper boundary of the black descending channel
– A confirmed breakout would signal the end of the bearish leg.
The 50% midpoint of the blue channel
– Breaking above it opens the door toward the upper side of the main ascending channel.
The upper boundary of the yellow channel
– Not completed or validated yet, so considered secondary until structure develops further.
All these technical elements meet around the 4170$ level,
making it the key breakout point to unlock bullish continuation.
A strong close above 4170 may shift momentum upward
and push price toward higher channel targets.
Failure to break it keeps price inside current structure.
Further updates will follow with confirmation.
XAUUSD – Possible Ending Diagonal Completing Wave (5)Gold appears to be forming a classic Ending Diagonal structure for the final Wave (5). Price action is compressing inside a narrowing wedge, with each push up showing clear loss of momentum — typical behavior for a terminal wave.
🔍 Structure Breakdown
Wave (3) is confirmed.
Wave (4) retracement respected the lower structure.
Current price action is unfolding inside a rising wedge, matching all characteristics of an Ending Diagonal:
Overlapping waves
Converging trendlines
Weakening momentum on each new high
Waves (A)(B)(C)(D)(E) of the internal wedge are completed.
🔻 Bearish Implication
If this diagonal is valid, Wave (5) is likely in its final stage.
A break below the lower wedge trendline would confirm the reversal and open the road toward the next major support — the base trendline of the larger channel.
This would signal the beginning of a sharp corrective move, as Ending Diagonals usually unwind aggressively.
📉 What I’m Watching
Breakdown of the wedge = confirmation
Volume/momentum expansion on the break

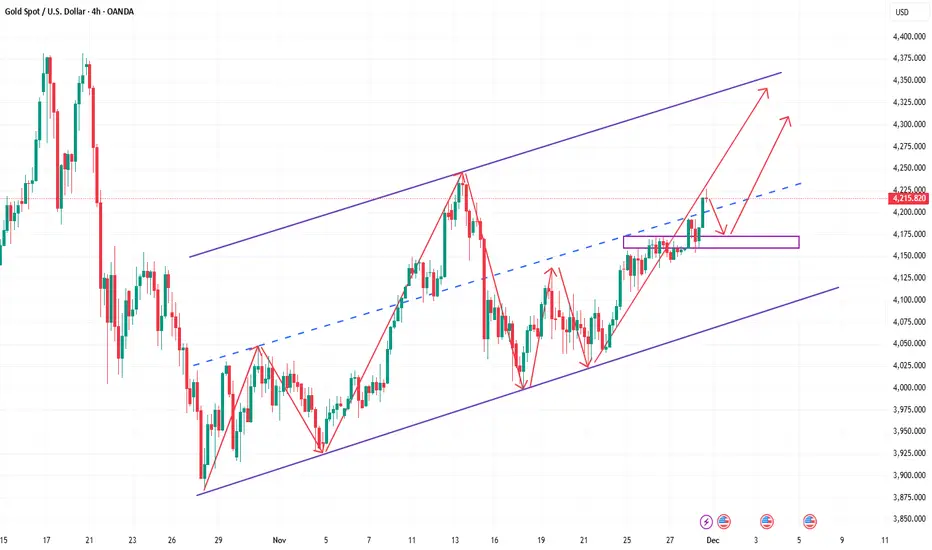
How did gold move in the first week of December? CONCISE & COMPREHENSIVE TECHNICAL ANALYSIS
1. Trend Lines
Ascending trend line (lower black line)
This is the main dynamic support of the current uptrend structure.
The price has bounced off this trend line several times → the short-term trend remains bullish as long as this line is not broken.
Major descending trend line (upper black line)
This is strong dynamic resistance on larger time frames, and the price recently touched this area.
This is an area where selling pressure frequently arises.
2. Support – Resistance
Resistance
4,243–4,245 (red zone):
This is the confluence of the previous peak and the descending trend line → selling pressure appears right in this area.
4,315–4,320 (next major resistance):
If this area is broken, the price will likely head towards 4,375–4,380.
Support
4.147–4.150 (green zone confluence):
Confluence of moving averages, the nearest swing low, and Fibonacci levels → important support that maintains the bullish structure.
4.105–4.120 (lower trendline):
If the price breaks through this area → the short-term trend has the potential to turn bearish.
3. Fibonacci
Fibonacci 0.618 = 4.194
→ Area with a high probability of a rebound if the price corrects.
Fibonacci 0.5 = 4.135
→ Confluence with strong support + trendline → potential buy zone if a deeper pullback occurs.
4. Price Scenarios
Scenario 1 – Continue Upward (Priority)
If the price remains above 4,200–4,215, there is potential for a retest:
➡️ 4,230 → 4,315 → 4,375
Scenario 2 – Downward Correction
If the price breaks through 4,190 and breaks through the green zone of 4,144–4,150, then:
➡️ Risk of a downward movement towards the 4,105–4,120 trend line
📌 Trading Plan
BUY GOLD: 4,148 – 4,250
Stop Loss: 4,138
Take Profit: 100–300–500 pips
SELL GOLD: 4,313 – 4,315
Stop Loss: 4,325
Take Profit: 100–300–500 pip
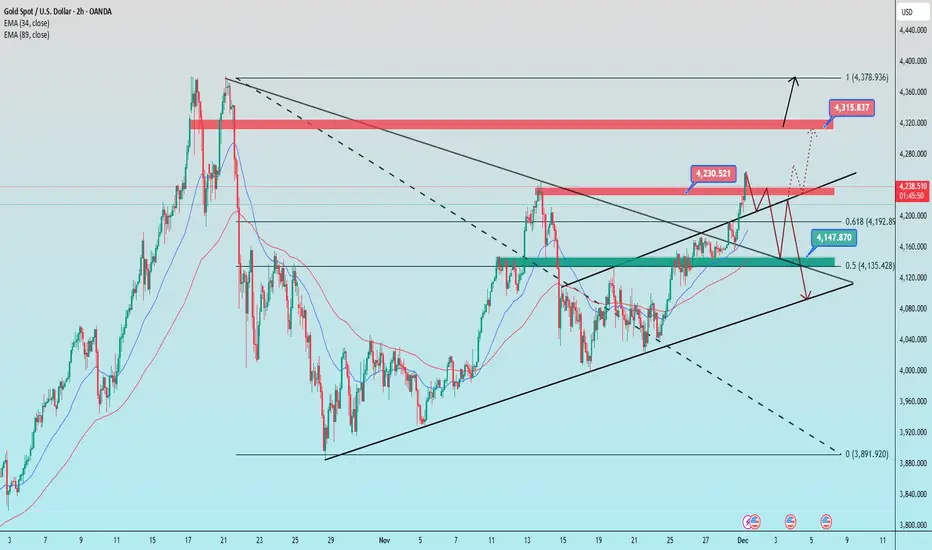
Gold Holds Strong Inside Trend Channel,Prepares for New ATH PushGold continues to maintain impressive bullish momentum, trading steadily within its rising trend channel. With structure firmly supported and macro sentiment leaning dovish, the market appears to be positioning for a new short-term ATH if liquidity aligns.
📊 Technical Outlook (M30 – MMF Flow)
Gold has respected the ascending channel perfectly, with each corrective leg finding buyers along channel midline and lower boundary.
The most recent impulse broke through the 4,23x region before pulling back into local liquidity.
Key Liquidity Zones
4,236 – 4,254 → Short-term supply reacting
4,218 – 4,220 → Minor demand zone
4,196 – 4,199 → Major BUY Zone (channel support + imbalance fill)
Market structure remains bullish as long as price holds above 4,196, the confluence level where:
✔️ Demand zone
✔️ Trend channel support
✔️ Fibonacci retracement
all align.
A clean bounce from this zone could trigger the next expansion leg.
🎯 MMF Trading Plan – BUY Priority
Scenario 1 – Continuation Bounce
Entry (Buy): 4,218 – 4,220
SL: 4,210
TP: 4,254 → 4,272 → 4,281
Scenario 2 – Strong Liquidity Sweep BUY (Preferred for RR)
Entry (Buy): 4,196 – 4,199
SL: 4,188
TP: 4,236 → 4,254 → 4,281
SELL Trades
Only scalp sells at supply zones
(4,254–4,257 / 4,281–4,283)
→ Not a main strategy while trend remains bullish.
⚜️ MMF View
Gold is showing healthy bullish structure, with clear liquidity engineering and controlled corrections.
As long as price stays within the trend channel and above 4,196, the path of least resistance remains up.
A breakout toward 4,281+ is highly likely before any deeper correction.
“In bullish markets, the best trades come from buying the dip—never chasing the pump.”XAU/USD – Gold Holds Strong Inside Trend Channel, Prepares for New ATH Push
Gold continues to maintain impressive bullish momentum, trading steadily within its rising trend channel. With structure firmly supported and macro sentiment leaning dovish, the market appears to be positioning for a new short-term ATH if liquidity aligns.
📊 Technical Outlook (M30 – MMF Flow)
Gold has respected the ascending channel perfectly, with each corrective leg finding buyers along channel midline and lower boundary.
The most recent impulse broke through the 4,23x region before pulling back into local liquidity.
Key Liquidity Zones
4,236 – 4,254 → Short-term supply reacting
4,218 – 4,220 → Minor demand zone
4,196 – 4,199 → Major BUY Zone (channel support + imbalance fill)
Market structure remains bullish as long as price holds above 4,196, the confluence level where:
✔️ Demand zone
✔️ Trend channel support
✔️ Fibonacci retracement
all align.
A clean bounce from this zone could trigger the next expansion leg.
🎯 MMF Trading Plan – BUY Priority
Scenario 1 – Continuation Bounce
Entry (Buy): 4,218 – 4,220
SL: 4,210
TP: 4,254 → 4,272 → 4,281
Scenario 2 – Strong Liquidity Sweep BUY (Preferred for RR)
Entry (Buy): 4,196 – 4,199
SL: 4,188
TP: 4,236 → 4,254 → 4,281
SELL Trades
Only scalp sells at supply zones
(4,254–4,257 / 4,281–4,283)
→ Not a main strategy while trend remains bullish.
⚜️ MMF View
Gold is showing healthy bullish structure, with clear liquidity engineering and controlled corrections.
As long as price stays within the trend channel and above 4,196, the path of least resistance remains up.
A breakout toward 4,281+ is highly likely before any deeper correction.
“In bullish markets, the best trades come from buying the dip—never chasing the pump.”

Momentum is fading — watch the breakdown.🔎 CURRENT MARKET ANALYSIS & TODAY’S EXPECTED MOVEMENT 🔎
The market is currently moving within a Rising Wedge structure – price pushes higher but momentum weakens, volatility narrows, and the probability of a bearish breakdown increases significantly.
📌 SETUP 1 – SELL ZONE (Primary Setup)
XAUUSD SELL: 4203 – 4206
✔️ Take Profit: 4200 – 4195
❎ Stop Loss: 4210
➡️ Use proper risk management as always.
📌 SETUP 2 – BUY ZONE (Secondary – Only with confirmation)
XAUUSD BUY: 4109 – 4112
✔️ Take Profit: 4115 – 4120
❎ Stop Loss: 4105
➡️ BUY only if price reaches this zone with a clear bullish reversal signal.
1. Current Market Situation
📉 Price Structure
- Price is nearing the upper boundary of the Rising Wedge.
- Newly formed highs are weakening → buyers are losing strength.
- Recent candles show long upper wicks, indicating heavy selling pressure at resistance.
- The lower support line has been tested multiple times → higher probability of a breakdown.
➡️ Key signal: buyers are losing control while sellers are gradually positioning.
2. Main Scenarios for Today
✅ Scenario 1 (Preferred) – Price breaks the lower edge of the Rising Wedge
- If a candle closes below the support zone, the market is likely to:
- Drop quickly towards the next support levels.
- Sellers will enter strongly when price retests the broken support (now acting as resistance).
🔔 This is a confirmation SELL signal.
🎯 Downside Targets:
TP1: nearest support zone
TP2: previous swing low of the pattern
TP3: deeper structure support (depending on your timeframe)
⚠️ Scenario 2 – Price holds above support but moves weakly
If price only bounces slightly from the lower wedge boundary but cannot break the upper edge:
- Market remains weakly bullish, fragile and easily pushed down.
- Not suitable for chasing BUY positions.
- Buyers need a strong breakout above the wedge’s upper boundary to reverse the structure, which is less likely.
3. Intraday Trend
⭐ Intraday bias: DOWN – or at least a corrective decline.
Signs supporting the bearish bias:
- The nearer price gets to support, the easier it becomes to break.
- Volume is weak during upward moves → insufficient buying pressure.
- Sideways movement is tightening → preparing for a breakout.
- Sellers are waiting for a clean retest to enter.
4. Conclusion
- The market is approaching the end of a Rising Wedge – a bearish reversal pattern.
- Priority strategy: Watch for breakdown → wait for retest → SELL.
- Avoid chasing BUYs; reversal risk is high.
Most probable development today: Support break → Retest → Continuation down
What are your thoughts on XAUUSD? Comment now or join my group to trade with me on description.

An Opportunity to Short GOLD You Can't MissOn the chart, gold continues to move smoothly within a clear downtrend channel, with highs and lows forming at progressively lower levels over time. Currently, the price is once again approaching the upper boundary of the channel and interacting with the same resistance area, where sellers have appeared multiple times before, pushing the market to reverse. This behavior indicates that the potential for a continued corrective move downward in line with the main trend remains intact.
In this context, I see a price decline toward the area around 4,080 as a logical and reasonable target for this corrective wave. As long as the price hasn’t decisively broken the upper boundary of the channel, I will continue to favor the scenario where the downward trend remains dominant, considering most upward movements as merely pullbacks within the existing structure.
This is not investment advice, but simply my personal viewpoint based on the current price action.

GOLD holidng upside ? going to supporting areas ??#GOLD... market hold our yesterday resistance area that was around 4170-73
and from yesterday market trade below that resistance area so be ready and stay sharp guys.
below that we can expect a drop towards our supporting areas.
NOTE: we will go for cut n reverse above 4172 on confirmation.
good luck
trade wisely
