Gold on side Swings on Fed aftermathAs discussed throughout yesterday's session: 'My position: I am Buying Gold aggressively throughout yesterday's session all along especially when #3,952.80 benchmark got invalidated to the upside. Gap to the downside on Asian market opening delivered excellent chances to Buy more as I closed all orders with #4,000.80 Take Profit. Keep in mind that I might Sell #4,024.80 now (aggressive Scalp to the downside) only to Buy more. #4,052.80 benchmark and #4,100.80 extension are my Targets.'
If you followed Trading plan I announced above, you would be in excellent Intra-day Profits. I have Sold Gold from #4,027.80 High's multiple times and re-Bought Gold from #4,004.80 especially delivering excellent results and altered all my Trading activity (no need to gamble on Fed Rate decision aftermath). My Profit is excellent and will sit out today's session as it will be full of side-Swings where I will continue comfortable Trading throughout tomorrow's session.
Trade ideas

GOLD $4,381 — Cyclical Top or Local Top?Has the price of gold reached its final bullish cycle high at $4,381 during the trading session of Monday, October 20? That session marked the end of an upward inertia phase in precious metals prices, triggering the first retracement since mid-August. However, a retracement does not necessarily mean a final cycle top or the start of a long-term bearish trend.
To confirm that gold has made its annual top this October in the commodities market, several technical and fundamental conditions must be met — and at this stage, they are not.
1) To confirm a major cycle top, a strong resistance level and a clear bearish reversal pattern must be observed
Looking back at gold’s price history, we can refer to the long distribution phase of 2011–2012, which concluded a bullish trend that had begun at the start of the century. This was followed by a four-year bear market, before a new long-term uptrend began in January 2016.
What about the current long-term technical setup? Monthly chart data provide insight into the broader cycle. Gold has been building its fifth bullish wave since the breakout above its former all-time high in March 2024, already exceeding several theoretical price targets based on Fibonacci extensions. The $4,300 region aligns with two major extensions, including the 1.618 “golden ratio” extension of wave 3.
However, that alone is not enough to confirm that the cycle top occurred at $4,381. At this stage, there is no distribution pattern or major support break. A drop below $3,400 would be a strong signal of a completed bullish cycle.
2) Gold’s cyclical top will occur when the US dollar confirms a medium-term bullish reversal
Gold’s cyclical top will coincide with the moment the US Dollar (USD) establishes a sustained bullish reversal. Gold and the dollar usually move in opposite directions: a stronger dollar reduces the appeal of gold for international investors. Once the dollar confirms an upward trend reversal, capital will progressively rotate away from gold — signaling the end of the metal’s bullish phase.
The chart below shows the weekly candlesticks of the US Dollar Index (DXY) against a basket of major currencies, highlighting the bullish reversals seen in 2018 and 2021.
3) Gold’s cyclical top will be reached when outflows dominate in GOLD ETFs
The gold cycle will top out when capital outflows from gold-backed ETFs become dominant. Inflows into these funds usually reflect investor appetite for the metal. When these inflows slow and reverse, it shows a gradual disengagement from gold’s financial demand — which has played a major role in its 2025 price rally.
This shift marks the maturity of the bullish phase. Therefore, the dominance of ETF outflows is an early indicator of an impending gold cycle reversal. For now, according to World Gold Council data, that situation has not yet materialized.
DISCLAIMER:
This content is intended for individuals who are familiar with financial markets and instruments and is for information purposes only. The presented idea (including market commentary, market data and observations) is not a work product of any research department of Swissquote or its affiliates. This material is intended to highlight market action and does not constitute investment, legal or tax advice. If you are a retail investor or lack experience in trading complex financial products, it is advisable to seek professional advice from licensed advisor before making any financial decisions.
This content is not intended to manipulate the market or encourage any specific financial behavior.
Swissquote makes no representation or warranty as to the quality, completeness, accuracy, comprehensiveness or non-infringement of such content. The views expressed are those of the consultant and are provided for educational purposes only. Any information provided relating to a product or market should not be construed as recommending an investment strategy or transaction. Past performance is not a guarantee of future results.
Swissquote and its employees and representatives shall in no event be held liable for any damages or losses arising directly or indirectly from decisions made on the basis of this content.
The use of any third-party brands or trademarks is for information only and does not imply endorsement by Swissquote, or that the trademark owner has authorised Swissquote to promote its products or services.
Swissquote is the marketing brand for the activities of Swissquote Bank Ltd (Switzerland) regulated by FINMA, Swissquote Capital Markets Limited regulated by CySEC (Cyprus), Swissquote Bank Europe SA (Luxembourg) regulated by the CSSF, Swissquote Ltd (UK) regulated by the FCA, Swissquote Financial Services (Malta) Ltd regulated by the Malta Financial Services Authority, Swissquote MEA Ltd. (UAE) regulated by the Dubai Financial Services Authority, Swissquote Pte Ltd (Singapore) regulated by the Monetary Authority of Singapore, Swissquote Asia Limited (Hong Kong) licensed by the Hong Kong Securities and Futures Commission (SFC) and Swissquote South Africa (Pty) Ltd supervised by the FSCA.
Products and services of Swissquote are only intended for those permitted to receive them under local law.
All investments carry a degree of risk. The risk of loss in trading or holding financial instruments can be substantial. The value of financial instruments, including but not limited to stocks, bonds, cryptocurrencies, and other assets, can fluctuate both upwards and downwards. There is a significant risk of financial loss when buying, selling, holding, staking, or investing in these instruments. SQBE makes no recommendations regarding any specific investment, transaction, or the use of any particular investment strategy.
CFDs are complex instruments and come with a high risk of losing money rapidly due to leverage. The vast majority of retail client accounts suffer capital losses when trading in CFDs. You should consider whether you understand how CFDs work and whether you can afford to take the high risk of losing your money.
Digital Assets are unregulated in most countries and consumer protection rules may not apply. As highly volatile speculative investments, Digital Assets are not suitable for investors without a high-risk tolerance. Make sure you understand each Digital Asset before you trade.
Cryptocurrencies are not considered legal tender in some jurisdictions and are subject to regulatory uncertainties.
The use of Internet-based systems can involve high risks, including, but not limited to, fraud, cyber-attacks, network and communication failures, as well as identity theft and phishing attacks related to crypto-assets.

XAUUSD 4H Chart – Bearish Structure in Play📉 Technical Outlook
XAUUSD 4H Chart – Bearish Structure in Play
Gold continues its corrective phase after breaking the previous bullish structure.
Price formed a Lower Low, confirming a short to mid-term downtrend.
The 4H bullish order block around 3917–3935 is being retested, while the bearish OB near 3960–3980 acts as resistance.
As long as price stays below the 4H bearish OB, further downside movement toward 3750–3770 remains likely.
The structure shows potential for a short-term pullback before continuation lower.

DeGRAM | GOLD is testing a resistance level📊 Technical Analysis
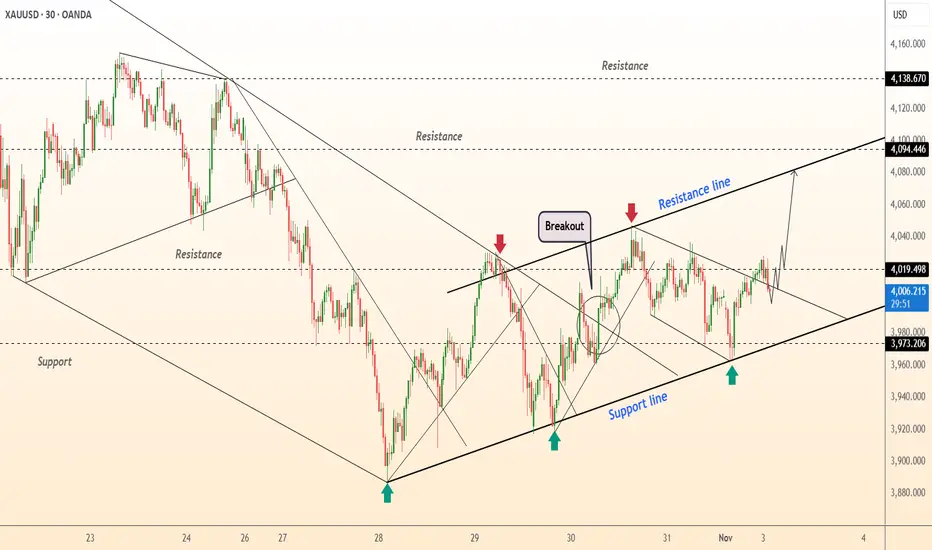
● XAU/USD has confirmed a breakout from the descending resistance line and continues to form higher lows along the rising support line, indicating growing bullish momentum.
● The pair targets the next resistance at 4,094–4,138, with immediate support seen at 3,973, maintaining a short-term upward structure inside a rising channel.
💡 Fundamental Analysis
● Gold gains traction as investors price in a pause in Fed tightening and geopolitical risk supports safe-haven demand.
✨ Summary
● Long bias above 3,973; targets 4,094–4,138. Breakout structure and macro sentiment favor bullish continuation.
-------------------
Share your opinion in the comments and support the idea with a like. Thanks for your support!
BUY SETUP – Smart Money Style (GOLD / USD – 30m)Analysis:
Price has formed a clean bullish structure after rejecting the demand zone (gray area). Multiple rejections confirm strong buyer presence around $3975–$3988, indicating liquidity absorption below the previous low.
Trade Plan:
Entry: Within the reaccumulation zone near $4026
Stop Loss: Below the demand base at $3975
Take Profit: Toward the upper liquidity and supply zone at $4097
Risk/Reward: ~1:3
Concept:
This setup aligns with Smart Money and FU (Failed Breakout) principles — price swept liquidity below the prior structure, tapped into unmitigated demand, and is now targeting the next high. A clean break and hold above $4053 would confirm momentum continuation to the upside.

Gold Trade Plan 06/11/2025 ( Buy Deep)dear Trader,
The price is above the 20 moving average, and the 4020–4030 zone will be a very important area for gold buyers. I expect the price to break this zone soon, with the first target at 4070 and the second at 4130. As long as the price remains stable above 4000, these targets will be achievable.
Regards,
Alireza!

XAUUSD – GOLD IS GATHERING ENERGY FOR THE NEXT MOVEXAUUSD – GOLD IS GATHERING ENERGY FOR THE NEXT MOVE
🧲 1. Market Overview
Gold continues to consolidate inside a symmetrical triangle, showing clear compression as liquidity builds up on both sides.
This kind of structure often precedes a strong breakout, so whichever direction price breaks, momentum could be powerful.
At the moment, price is reacting around the trendline support, while a bearish OB forms near the upper boundary – giving both buyers and sellers tactical opportunities.
📊 2. Technical Breakdown (ICT Perspective)
The market is currently trading between two key areas of liquidity.
Buy-side liquidity lies above 4035–4060, aligning with an H1 FVG.
Sell-side liquidity sits near 3990–3980, where trendline support meets an older OB.
The price could sweep liquidity at one end before moving decisively in the opposite direction.
🎯 3. Trade Scenarios (for reference)
Buy Setup
Entry: 3992.38
SL: 3982
TP: 4012 – 4035 – 4060
Sell Setup
Entry: 4023
SL: 4032
TP: 4020 – 4012 – 3989
⚠️ 4. Key Points to Watch
Trendline support: 3985–3995
Order Block (OB) resistance: 4020–4030
Breakout zones: watch candle closures beyond 4035 or below 3980
📢 5. Final Note
Gold is coiling tight — a breakout is imminent.
Patience and confirmation are key: wait for price to react at the trendline or OB zone before taking action.
If you found this analysis useful, drop a comment and follow LanaM2 for more professional ICT-based gold insights.

How to trade gold stably as the weekly and monthly charts close?#XAUUSD TVC:GOLD OANDA:XAUUSD
As we expected, gold broke through the previous strong resistance at 4030 and continued its bullish trend, reaching a high of 4046, very close to our target of 4050. Although the price of gold retreated somewhat after the brief surge, from the daily chart, the short-term price of gold is still above the MA5 moving average, while from the 4-hour chart, the middle band coincides with the MA20. Therefore, I don't think this means the bulls have given up; on the contrary, it's more like a way to better accumulate momentum at the bottom. This strategy remains effective, and we can still consider going long on gold when the price retraces to the 3985-3975 range.

DeGRAM | GOLD is testing the resistance line📊 Technical Analysis
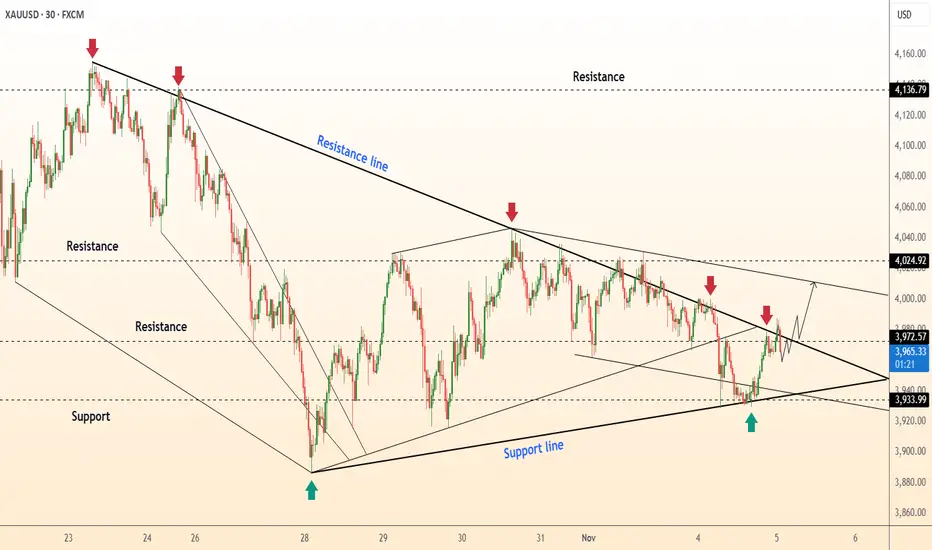
● XAU/USD has been respecting the support line at $3,933.99 and is approaching the resistance line near $4,024.92. The market has shown upward momentum after recent bounces from support, suggesting a possible breakout to higher levels.
● The price action is currently inside a rising channel, and a breakout above the resistance could lead to a move towards the next key resistance level.
💡 Fundamental Analysis
● A weaker USD and strong safe-haven demand could provide additional bullish support for gold in the near term.
✨ Summary
● Key levels to watch: Support at $3,933.99, resistance at $4,024.92. A breakout above $4,024.92 could target $4,046.60 for the next move.
-------------------
Share your opinion in the comments and support the idea with a like. Thanks for your support!
XAUUSD 15-Minute Chart Minor-Grade Short Entry Strategy XAUUSD 15-Minute Chart Minor-Grade Short Entry Strategy
Entry level around 4018 USD, stop-loss placed at 4053 USD.
1st target around 3940 USD: partial close (50% position), trail stop.
2nd target around 3870 USD: further partial close (50% of remaining), trail stop.
3rd target around 3800 USD: additional partial close (50% of remaining), trail stop.
Let the residual position run with progressive partial closures and stop trailing.

GOLD LONDON MARKET OPEN.
TECHNICAL OUTLOOK
GOLD,yesterday we posted buy floor at 3965-3955 ,this reaction was expected to be on the floor of the ascending trendline and 3966 holding 100pips buy in the early hours of market open.
should gold need mre discount the next zone will 3936--3930 for demand .
the retest of the current low 3887-38890 will be watched .
layer by layer .
FUNDAMENTAL OUTLOOK
Gold's reclassification as a Basel III Tier 1 asset marks a significant upgrade in how regulators and banks view gold within global financial systems.
Why Gold is Reclassified as Basel III Tier 1
Tier 1 Status Definition: Under Basel III, Tier 1 assets are the highest quality capital assets that banks can use to meet their core capital requirements. These assets carry a 0% risk weight, reflecting their safety, liquidity, and reliability as capital.
Gold’s Historical Status: Gold has already been recognized as a Tier 1 asset for capital adequacy since the Basel I Accords in 1988, due to its status as a safe store of value with very low default risk.
New Recognition (2025): Starting July 1, 2025, physical gold held by banks can be counted at 100% of its market value in regulatory capital calculations, instead of being subject to significant haircuts or lower classifications (e.g., previously it was treated as a Tier 3 asset with a 50% deduction).
High-Quality Liquid Asset (HQLA) Label: This reclassification means gold is now officially recognized as a High-Quality Liquid Asset under Basel III, allowing it to qualify as part of banks’ liquidity coverage ratios (LCR), an important step for liquidity and capital management.
Regulatory Shift: This reflects changing perceptions that gold is not just a commodity but a true monetary asset. It is increasingly accepted as a reliable reserve asset by central banks and financial institutions worldwide.
Central Bank Adoption: This move aligns with continued aggressive gold buying by central banks, recognizing gold’s importance for capital reserves, systemic stability, and as an inflation hedge.
Significance
Banks can fully count gold toward core capital reserves.
Reduces capital burden, improving bank balance sheets and financial resilience.
Endorses gold as a strategic, monetary asset, not just a commodity investment.
Encourages institutional demand for physical gold and gold-related financial products.
Summary
Gold was reclassified as a Basel III Tier 1 asset starting July 1, 2025, reflecting its highest quality capital standing with 0% risk weighting and full market value recognition. This elevates gold’s status to a High-Quality Liquid Asset (HQLA) for regulatory purposes, facilitating banks’ liquidity coverage and capital adequacy. The change signals a major regulatory and market shift, acknowledging gold as a core reserve and strategic financial asset in modern banking systems.
#GOLD #XAUUSD

Gold sideways consolidation capped at 4067Gold remains in a neutral trend, with recent price action showing signs of a corrective pullback within the broader uptrend.
Support Zone: 3887 – a key level from previous consolidation.
A bullish rebound from resistance: 4067 would confirm ongoing upside momentum, with potential targets at:
4067 – initial resistance
4110 – psychological and structural level
4165 – extended resistance on the longer-term chart
Bearish Scenario:
A confirmed break and daily close below 3887 would weaken the bullish outlook and suggest deeper downside risk toward:
3844 – minor support
3790 – stronger support and potential demand zone
Outlook:
Neutral bias remains intact while the gold trades around pivotal 4067 level. A sustained break below or above this level could shift momentum.
This communication is for informational purposes only and should not be viewed as any form of recommendation as to a particular course of action or as investment advice. It is not intended as an offer or solicitation for the purchase or sale of any financial instrument or as an official confirmation of any transaction. Opinions, estimates and assumptions expressed herein are made as of the date of this communication and are subject to change without notice. This communication has been prepared based upon information, including market prices, data and other information, believed to be reliable; however, Trade Nation does not warrant its completeness or accuracy. All market prices and market data contained in or attached to this communication are indicative and subject to change without notice.

XAUUSD.... SHORTThe market ticks all my entry strategy on the daily and the 4hrs... but I'm waiting for 30mins to close below my counter trendline for an entry.
Recently USD is getting stronger 💪. Lets see what the market does ✌

Gold: Focus on Selling, Watch Resistance at 3960–3975Gold bounced after pulling back to the 3948–3921 support zone yesterday, but was capped by the 4H MA5 and fell back toward support again. On the 30-minute chart, the price action currently shows signs of a potential rebound, with the MA60 serving as the key upside resistance in today's session.
As mentioned during yesterday’s live updates, if the 3948–3921 support area breaks, the next major level to watch will be the 3800 psychological mark along with support from the daily MA60. At that stage, trading strategies should be adjusted based on real-time market behavior and sentiment.
Overall, the short-term bias remains bearish, favoring trend-following sell setups. For medium- to longer-term traders, gradual long positioning can be considered. However, volatility remains elevated in this phase, so risk control is essential—manage position size carefully and avoid emotional trading.

GOLD XAUUSD GOLD XAUUSD ,GOLD ,AS earlier predicted on retest to 4030 zone, price is reacting but 4hr close shows a technical break of structure and if we take correction i will be watching 4000-4006 demand floor which is a descent 270pips drop from the close of the newyork high.
the next demand floor should 4000-4006 fails will be 3956-3954 zone ,a strong 1hr cross and a break and retest descending trendline .
if 4000-4006 holds and we break freely away from 4030 ,then we will target 4100 zone you can stop at 4068 another 300pips break of 4030 resistance zone and watch for correction .
am confident that 4100 is possible tomorrow.
technical failure of both zone will retest 3885-3889 current low which i think wont happen based on the current FEDERAL FUND RATE 3.75%-4.0%.
#GOLD #XAUUSD

Gold Accumulates on Support, 3,952 USD is the Gateway for a New🔍 Market Context
Gold is oscillating within a symmetrical triangle pattern , reflecting price compression and waiting for a breakout signal.
Buyers still maintain a short-term bullish structure, but the series of lower highs indicates increasing selling pressure.
The 3,959–3,964 USD zone is currently the “balance point” — if this area is breached, the downtrend could extend to the lower liquidity zone around 3,929–3,921 USD .
💎 Key Technical Zones
• Resistance Zone: 4,020 – 4,040 USD → the main resistance area of the triangle, where strong reactions are likely.
• Support Zone: 3,959 – 3,964 USD → the support area maintaining the bullish structure.
• Liquidity Zone: 3,929 – 3,921 USD → low liquidity area, potential to attract price stop sweeps before reversing.
🎯 Trading Scenarios
1️⃣ BUY Setup – Prioritize when price holds above support
• Entry: 3,959 – 3,964 USD
• Stop Loss: 3,940 USD
• Take Profit:
– TP1: 3,985
– TP2: 4,020
– TP3: 4,040
– TP4: 4,096
✳️ “Buy the discount” – Buy at the trendline convergence support area when confirmation signals appear (rejection or bullish ChoCH).
2️⃣ SELL Setup – Scenario if support breaks
• Entry: 3,950 – 3,955 USD (after candle closes below support zone)
• Stop Loss: 3,970 USD
• Take Profit:
– TP1: 3,935
– TP2: 3,925
– TP3: 3,912
✳️ “Sell the breakdown” – Sell when support is clearly breached, targeting the lowest liquidity zone (3,921 USD).
💬 Summary
Gold is in a phase of accumulation before major volatility .
If it holds above the 3,952 USD zone → prioritize BUY following the bullish structure .
If it breaks below 3,952 USD → SELL following the breakout towards the Liquidity Zone.
The scenario will be clearly confirmed when the current symmetrical triangle is broken.
💡 Today's Tagline:
“Liquidity defines direction — follow where the money hides.”
⏰ Timeframe: 1H
📅 Updated: 11/04/2025
✍️ Analysis by: Captain Vincent

Gold M15 LowsI expect one of those lows if not all of them to be taken out before we start to see some bullish momentum.

XAUUSD ONE MORE LEG DOWNSIDE🟡 Technical Overview: Gold (XAU/USD) 1-Hour Chart
This 1-Hour chart for Gold (XAU/USD) exhibits a clear shift from a short-term upward trend into a strong bearish impulse, followed by a minor corrective bounce.
The price action was characterized by an ascending channel/uptrend (marked by the blue parallel lines) which defined the market's structure. Crucially, the chart shows a decisive breakdown from the lower trendline of this channel, which occurred around the $3,980 level.
Following the breakdown, the price experienced an aggressive sell-off, dropping to a swing low around the $3,920 zone. This area, marked by a Horizontal Support Level (HS), successfully halted the immediate decline and initiated a modest corrective bounce.
📉 Analysis and Projection
The overall bias has shifted to bearish in the short term, due to the confirmed break of the prior uptrend structure. The current price action is interpreted as a bearish flag or consolidation phase following the sharp impulse move down.
Resistance (Key Bearish Zone): The most significant resistance is the prior uptrend's lower trendline, now acting as a ceiling for the price. This line intersects near the $3,980 - $3,990 area. A strong rejection from this zone would confirm the breakdown and the continuation of the downtrend. The $4,000 psychological level also sits just above this zone, providing further strong overhead resistance.
Support (Key Bullish Zone): The immediate support is the $3,920 Horizontal Support (HS). This level successfully stemmed the aggressive selling and is the critical line that buyers must defend.
Projection: The path of least resistance is to the downside. The high-probability scenario projects a move down from the current consolidation, breaking the $3,920 support. The next significant downside target would be the lower horizontal line marked on the chart, around $3,880 - $3,900, which would fill the most recent move's potential extension.
Alternative Scenario: A confirmed move and hourly close above the $4,000 psychological and former trendline resistance would invalidate the short-term bearish bias, suggesting a potential re-test of the recent swing high.
The technical indications strongly favor a continuation of the bearish move, with the $3,980 - $4,000 zone serving as the critical pivot for the next move.

GOLD (XAUUSD) - 4H - Down Trend - SELL SET UPCurrent Market Direction
Right now, Gold is in a downtrend on 4H:
Lower highs
Lower lows
Weak bullish momentum
Price is pressing against the support zone ~3925–3940
There is no buy signal yet — Support is weakening, not bouncing.
So we do NOT buy now.
The smart move is to wait for price to pull back to a resistance zone, then sell.
Key Levels on the Chart
Level / Purpose
4025 – 4045 / Strong resistance (Sell Here)
3925 – 3940 / Current support (weak, likely to break)
3855 – 3870 / Next major demand / Take Profit area
Best Trade Setup (High Probability)
We sell after pullback into previous broken support → now resistance.
Trade Plan Summary
SELL LIMIT: 4025 – 4045
STOP LOSS: 4080
TAKE PROFIT 1: 3930
TAKE PROFIT 2: 3870
Why Not Buy Now?
Stochastic oversold does not mean reversal — just means momentum is extended.
Price is not bouncing, it is sliding sideways → bearish continuation.
Buyers are weak, sellers control structure.
Buying here = catching falling knife.
Selling pullback = professional entry.

Gold Outlook after the Dip. What to expect NOW?The price correction has ended, and the price is now in a strong support zone according to Fibonacci levels. From this point onward, the price is expected to rise and retest its previous high.

XAUUSD LONG SETUP INTRADAY ( NOV 06, 2025 )If you have doubt on our trades you can test in demo.
OANDA:XAUUSD LONG SETUP
EP: 3993.469
TP: 4017.410
SL: 3981.518
Trade Ideas:
Idea is clearly shown on chart + we have some secret psychologies and tools behind this.
Trade Signal:
I provide trade signals here so follow my account and you can check my previous analysis. So don't miss trade opportunity so follow must.

WE ARE BUYING A buy at 3975-70,sl 3955 an update by 6am UTC on whether to hold or close of invalidity

Sell XAUUSDXAUUSD liquidity trade towards 3940. A head and shoulders pattern can be used as reference for the sells on the 15-minute chart. With ADP stat release favoring the USD, XAUUSD price could see sharp bears from here
