Gold 4H – Liquidity Plays Ahead of Fed Minutes & PMI Data🥇 XAUUSD – Weekly Smart Money Outlook | by Ryan_TitanTrader
📈 Market Context
Gold continues to trade inside a controlled 4H consolidation as markets brace for a highly event-driven week: U.S. PMI releases, updated Fed guidance, and renewed debates over the timing of future rate cuts.
Recent data has shown mixed momentum — softer employment trends but steady business activity — keeping the dollar volatile and gold reactive near mid-range liquidity.
Institutional flows remain cautious, reducing aggressive positioning ahead of major macro catalysts. This environment typically leads to engineered sweeps on both sides of the range as Smart Money hunts liquidity before revealing direction.
Expect short-term volatility spikes, especially around U.S. session opens and PMI releases.
🔎 Technical Analysis (4H / SMC View)
• Price is navigating a minor bearish structure, forming lower highs while protecting deeper liquidity beneath 4020.
• The recent 4H BOS + corrective pullback suggests the market may generate a liquidity grab toward the discount zone before any strong bullish leg develops.
• A Premium Sell Zone at 4225–4227 sits above resting liquidity, making it an ideal region for stop hunts and short-term distribution.
• The Discount Buy Zone at 4010–4008 aligns with structural reaction points, unmitigated demand, and a liquidity shelf — ideal for accumulation.
• Mid-range liquidity around 4060–4080 may be swept before the market chooses a larger weekly direction.
🟢 Buy Zone: 4010–4008
SL: 4000
TP targets: 4085 → 4120 → 4175 → 4220
Rationale:
• Deep discount zone beneath 4H liquidity
• Confluence of demand + structural mitigation
• High probability of engineered sweep before bullish expansion
🔴 Sell Zone: 4225–4227
SL: 4235
TP targets: 4175 → 4120 → 4060 → 4015
Rationale:
• Premium supply above equal-high liquidity
• Favors stop hunt + distribution before correction
• Aligns with previous 4H rejection and imbalance fill
⚠️ Risk Management Notes
• Wait for M15 ChoCH / BOS inside each zone before entering — avoid blind entries.
• Expect spreads and liquidity manipulation around news: US PMI, Fed speeches, and data surprises.
• Avoid trading 10–20 minutes before high-impact events.
• Scale partial profits at each structural target to secure gains and let runners develop.
✅ Summary
Gold remains trapped in a structured 4H range where Smart Money is likely to sweep one side before delivering a decisive expansion.
Discounted buys at 4010–4008 and premium sells at 4225–4227 remain the highest-probability weekly setups.
Stay patient, respect liquidity, and follow confirmation.
🔔 FOLLOW @Ryan_TitanTrader for more weekly SMC setups 🚀
Trade ideas

xauusd sell(gold)Price action from the weekly and daily closures give a sign plus the liquidity grab from the high is a sign for a sell.

Gold is poised for a significant surge.Gold closed slightly lower on the daily chart. In the NY market, after finding support at 4110, it surged to around 4160, maintaining its position above the 10-day moving average and trading within the upper Bollinger Bands. The RSI indicator is above the midline. On the shorter-term 4-hour chart, yesterday's price action saw repeated fluctuations within the 4110/4160 range, consistently adjusting within the upper Bollinger Bands, with moving averages maintaining an upward trend. Today's trading strategy is to continue buying at support levels; however, given the wide-range, discontinuous price action, short-term participation is preferred.
On the 1-hour chart, the moving averages continue to trend upwards, maintaining a bullish alignment. Reviewing the overall gold price movement, the overall trend remains upward. A short-term pullback occurred in the 4150-4160 area, with support at the 4110 level (a previous resistance level). The final close was above 4110. Therefore, today, pay attention to the support levels at 4110 and the psychological level of 4100; buying opportunities may arise there.
Key Levels:
First Support: 4123, Second Support: 4105, Third Support: 4092
First Resistance: 4160, Second Resistance: 4176, Third Resistance: 4190
Gold Intraday Trading Strategy:
BUY: 4105-4110, SL: 4090, TP: 4130-4140;
SELL: 4175-4180, SL: 4195, TP: 4150-4140;
More Analysis →

Gold Market UpdateDespite my constructive outlook on the US dollar—which typically weighs on gold—I believe the yellow metal is showing resilience.
• 📈 Trend Support: The market remains underpinned by the 55-day moving average on the daily chart.
• ☁️ Technical Cushion: The Ichimoku cloud continues to provide decent support on the daily timeframe.
• 📊 Longer-Term View: Weekly charts suggest consolidation rather than topping action, reinforcing the idea of an ongoing uptrend.
• 🔑 Key Level to Watch: A close above the recent interim high at 4245 would be the first signal of renewed upside momentum.
In my view, gold is not topping out—it’s consolidating within a broader bull trend. Once a breakout occurs, expect another measured upside target to emerge. For now, patience is warranted, but keep 4245 firmly on your radar.
⚠️ Disclaimer: This is market commentary and not trading advice.

GoldXAUUSD
- Change of Characteristics
- Fair Value Gap
- Fibonacci Level - 61.80% / 78.60%
- Bullish Channel as an corrective pattern in Short Time Frame
- Order Block

Gold Sell SetupHi Everyone,
Hope you all are doing well,
I Prefer to get into sell as of now as per my analysis however later on it will be buy too. So will try to catch both the moves. (This is just my personal view and analysis & not any suggestions from my end to trade, its just for the educational purposes, rest you can do your own analysis).
Hope to get Green Pips.
Amen

Gold: eyeing breakout levels?After some consolidation, the price of gold continued its rally on Friday, closing the week at $4.230. The latest move was triggered by investors' expectations that the Fed might cut interest rates, two weeks from now, by another 25 basis points. Also investors' sentiment is turned toward the expectation that the economic output in 2026 will be lower. Analysts are also noting that the demand for gold has weakened among Asia retail buyers, considering its all time highest levels.
During the week, the RSI was slowly moving toward the overbought market side. The indicator reached the level of 63 at Friday's trading session, leaving some space for the upside until the clear overbought market side is reached. The MA50 and MA200 continue to move without a change, as two parallel lines with an uptrend.
Current charts are showing that the price of gold has some space to move toward the upside, until the peak from id-November is reached, at the level of $4.240. In case that this level is breached, then the gold will continue toward the latest ATH at $4.377. In case of a short-term reversal, the trend line bottom currently stands around $4.100. For the week ahead, both levels are open, based on the current charts.

[Short] XAUUSD Bearish Harmonic PatternFollowing the previous Long then Short Idea posted on Nov 25. The Long setup has hit the TP on Nov 28.
Bearish Harmonic Pattern is at completion. Will look to short around the 4220 level with an RR of around 1:3.5.

GoldXAUUSD
- Completed " 12345 " Impulsive Waves
- Change of Characteristics
- Bullish Channel as an corrective pattern in Short Time Frame and Long Time Frame
- Order Block
- Fibonacci Level - 78.60%

XAUUSD - Bulls Still Stepping In at Demand… Watching the Retest!Gold remains overall bullish, holding firmly above the major support zone around $4,000–$4,050. This entire red area has been acting as a strong demand zone for weeks, with price bouncing from it multiple times, a clear sign that buyers are defending this level aggressively.
📈XAUUSD is also respecting the rising trendline , forming a clean higher-low structure. As long as Gold remains above both the trendline and the support zone, the bullish outlook stays intact. I will be looking for long setups on the next retest of this confluence area.
🏹If buyers step in again, the next move could push toward the previous highs near $4,385. But if price breaks below the support zone and the trendline, the bullish structure would weaken and open the door for a deeper correction.
For now, this zone is the key. Will Gold bounce again… or finally break through support? 🤔
⚠️ Disclaimer: This is not financial advice. Always do your own research and manage risk properly.
📚 Stick to your trading plan regarding entries, risk, and management.
Good luck! 🍀
All Strategies Are Good; If Managed Properly!
~Richard Nasr

GOLD VERY CLOSE TO BREAKING OUT VERSUS THE STOCK MARKET.Gold very close to breaking out vs stock market.
Lots of room left to outperform.

What is the intention behind the surge in gold prices at theopenLast Friday, due to Thanksgiving, market liquidity was limited. It was expected that the market would close early and the price movement would be minimal. However, gold still broke strongly above 4200 before the close, reaching the 4220-4230 area before a strong finish. Nevertheless, the trading strategy for this week should not be to blindly chase the rally. The key focus now is on the short-term resistance zone of 4245-4260, which is the high point after gold rebounded from the strong support of 4000 on November 18th. It is also a key resistance level in this upward structure. From the 4-hour chart, this area shows very clear resistance. If the bulls cannot break through effectively in the short term, shorting at higher levels remains the preferred strategy. On the downside, the key support level to watch is the psychological level around 4200-4190. If it retraces and stabilizes without breaking through, it can be used as a reference area for short-term long positions. The overall strategy remains the same: if the resistance level holds, prioritize shorting at higher levels; if the support level holds, then look for pullbacks to go long. The trend is there, but timing is more important. Blindly chasing the rise is not a wise choice. Trading according to the structure and key points is the key to continuous stability. Continue to follow my rhythm this week. We make decisions with discipline, not let the market lead us.
Wait and see to avoid CME technology risks!Gold Technical Analysis: Since the beginning of this week, gold has been trending upwards in a volatile manner. After breaking through the high point of the 4110-4130 trading range, it formed a small, one-sided upward trend, currently approaching the 4200 level. The increase has not been significant, and the process has been tortuous, with continuous oscillating upward movement. Currently, supported by positive news, there is still room for short-term upward movement, but overall, the upside potential remains limited. Moreover, as mentioned before, this bullish move is likely to trap many investors. Therefore, a relatively conservative approach has been consistently advised. The extent of this upward movement is uncertain and depends entirely on the strength of the news. It may reach the previous high of 4245, or it may break through. However, even if it breaks through, it is still recommended that long positions exit rather than hold on. The area above 4200 is a risk zone for longs. Once the news direction changes, the decline will be faster than the rise; a rise may take two weeks, while a fall may only take three days.
Looking at the overall performance of gold, after consolidating yesterday, it opened higher today. However, such a rapid rise should not be chased, especially as it approaches $4200, where the upside potential is limited and the risk outweighs the potential profit. The key resistance level to watch in the short term is $4200, a level we have consistently emphasized. If it breaks above $4200, short-term bulls should consider exiting their positions. Short-term support lies in the $4155-$4150 area. If this support is reached, short-term traders can continue to follow the trend, but if it rallies further, take profits quickly, as there is a possibility of stagnation or a pullback above $4200. Due to Thanksgiving in the US, trading markets closed early, resulting in limited market activity during the US session. The market is expected to oscillate between $4150 and $4190, and this oscillation is likely to continue. Recently, neither bulls nor bears have shown sustained momentum. Watch the $4190-$4200 resistance level above and the $4150 support level below, and be aware of the risks. Today is the last trading day of November. We should be cautious about the current rise, as there is a possibility of a large-scale sweeping fluctuation at the monthly closing price. Therefore, even if we are bullish now, we should be cautious and not chase the rise.

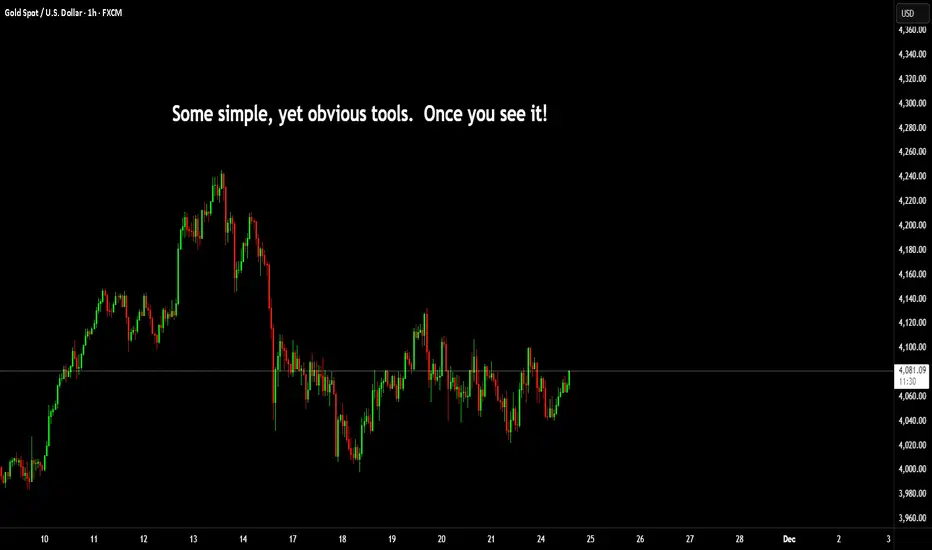
Very useful techniques to learnI have recently posted several posts around mechanical and simple charts. This is another insight into some professional techniques that are not often shown.
Gann talked about High and low candles and opposing ticks.
Lowest Tick of the Highest Bar: This refers to the lowest price point (or low tick) of the highest price bar (or highest price period) on the chart. It indicates a crucial support level. If the price falls below this point, it may signal a downward trend or a breakdown.
Highest Tick of the Lowest Bar: Conversely, this refers to the highest price point (or high tick) of the lowest price bar (or lowest price period). This represents a key resistance level. If the price rises above this level, it may indicate an upward trend or a breakout.
Here's an image showing this in an uptrend.
And another for a downtrend.
Then what you would expect from this, would be a move similar to this and of course you can't expect it every time. But to appreciate it, you need to understand the logic as to why this is important in the first instance.
The simple explanation of that is in an uptrend that lowest tick of the highest bar was in fact the exact area buyers failed and sellers took control. Obviously, the inverse is true of a downtrend. The highest point of the lowest candle, means buyers are back pushing prices higher.
Into the future you MIGHT but not always see these levels as support or resistance.
When you overlap this with the mechanical techniques, you can use this for range entries. Here's a post on mechanical techniques.
==========================================
Second tip is to do with volume.
Many people seem to have volume on their chart, but don't really know how to utilise it.
Now, imagine the areas I mentioned in the first tip. As price nears these zones (other other zones) order blocks, supply or demand, fib levels.
If you could quickly identify what story volume is trying to tell you. Then there is a huge benefit to know how you need to react to the price action.
In this image; Look at the spikes in volume until the orange arrow point.
What you can see from this next image, is the orange arrow is the turning point.
For it's next stop after breaking through the PoC of the range from the prior low to its high. You can draw a line, extended from the highest tick of the lowest candle.
Price comes back, and as explained in the example above. Buyers step back in and drive the price directly away from this level.
Now; let's go one step further.
In this image I have the volume profile on the left representing the swing low to high and then the profile on the right from that high to the fresh swing low.
You can see from the sell side pressure where price has interest to both parties.
Next you have both lines drawn on the chart of the opposing candles, like this.
Here. we can look at if the market is seeking outside or inside liquidity.
However, if you look back at the volume on the bottom of the chart. Are we seeing green candles and volume increasing? or red candles with volume increasing? This is where the second tip becomes very, very useful.
If you can identify the phase of internal or external, areas of interest. You can confirm this with volume clues on the chart and you will find yourself on the right side of the trade more often than not.
Have a great week all!
Disclaimer
This idea does not constitute as financial advice. It is for educational purposes only, our principal trader has over 25 years' experience in stocks, ETF's, and Forex. Hence each trade setup might have different hold times, entry or exit conditions, and will vary from the post/idea shared here. You can use the information from this post to make your own trading plan for the instrument discussed. Trading carries a risk; a high percentage of retail traders lose money. Please keep this in mind when entering any trade. Stay safe.
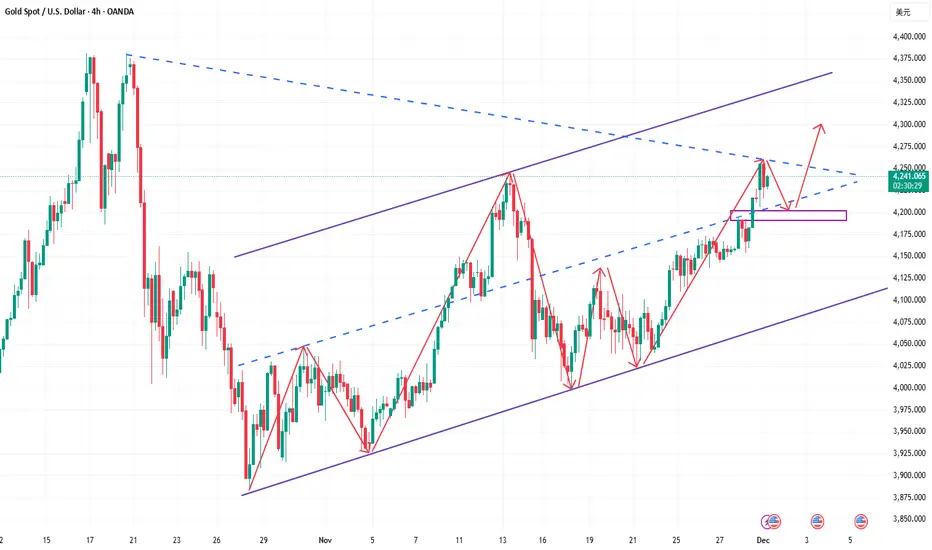
XAUUSD Daily – Five-Wave Impulse Toward 4,530On the XAUUSD daily chart I’m tracking a potential five-wave advance within the existing uptrend.
Wave (1)** marks the initial impulsive leg higher from trendline support
Wave (2)** is the corrective pullback that holds above the origin of wave (1) and respects the rising trendline
Wave (3)** extends beyond the wave
(1) high, confirming continuation of the bullish structure and establishing a new swing high.
* Price is now correcting as **wave (4)** back into the area of:
* the rising trendline drawn from prior lows, and
* the former consolidation / breakout zone around the previous highs.
While price holds above the wave (4) low and the trendline, I’m anticipating a continuation leg to the upside as **wave (5)**.
The projected wave (5) objective is around 4,527, where I have a confluence of measured extension and overhead resistance.
A decisive daily close below the wave (4) low and trendline support would invalidate this wave count and delay the bullish scenario.

XAU/USD – Gold Holds Above Key Support as Pullback Stays LimitedGold remains capped below its two-week high during the Asian session, but the downside is clearly limited.
Market sentiment is shaped by:
A weaker USD as dovish Fed expectations gain traction
Rising probability of rate cuts in upcoming meetings
Improving global risk sentiment amid hopes of progress in Russia–Ukraine negotiations
Even though Gold is retracing, the bigger picture remains bullish as long as price holds above key support zones.
📊 Technical Outlook – MMF Trading Style (M30/H1)
Price is currently consolidating below the resistance cluster 4,156 – 4,170, retracing into multiple demand zones.
Key Levels to Watch
Support 1: 4,131 – 4,137
Support 2: 4,115 – 4,118
Support 3 (major liquidity): 4,083 – 4,090
Main Resistance: 4,170 – 4,193
Market structure shows a clean zigzag pullback, suggesting a potential bullish continuation once liquidity is collected below.
🎯 MMF Intraday Trading Plan
Scenario 1 – Buy the Dip (Primary Bias)
Best trade today: Buying retracements into demand.
BUY: 4,115 – 4,118
SL: 4,103
TP: 4,131 → 4,156 → 4,170
BUY (extended liquidity sweep): 4,083 – 4,090
SL: 4,070
TP: 4,118 → 4,145 → 4,170 – 4,193
Reason: Fibo confluence + strong demand + liquidity zone = high-probability reversal area.
Scenario 2 – Short-Term SELL (Scalp Only)
Only valid if price rejects strongly at resistance.
SELL: 4,156 – 4,170
SL: 4,177
TP: 4,145 → 4,131
This is not the main bias today.
⚜️ MMF Trading View
Gold is forming a healthy pullback—not, at this stage, a bearish reversal.
As long as price stays above 4,08x, the bullish structure remains intact.
“In Gold, the goal isn’t chasing the breakout — it’s waiting for price to return to value.”
Today’s focus: Prefer BUY setups on retracement – SELL only for quick scalps.

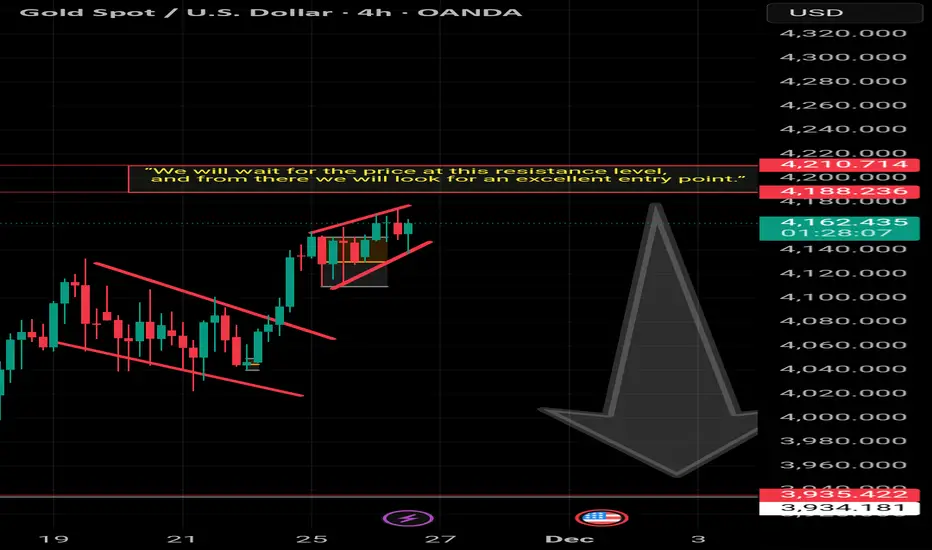
Waiting for a Key Entry Point at resistance Gold CAPITALCOM:GOLD
In trading, you must be patient. When the opportunity comes, it takes you—you don’t chase it. So keep watching and monitoring. The goal isn’t to take many trades.
THE GOLDEN-PRINT STRATEGY XAU/USD is currently trading around $4,100–$4,150. The chart shows a rising wedge pattern, indicating a potential bearish reversal. In the short term, Trump’s involvement in the crypto space could weigh on gold, but over the medium term, gold may strengthen as G20 nations move toward transactions outside of the dollar system.

The overall trend remains bullish📌 Scenario 1 – Gold completes its correction toward 3857 and then resumes the uptrend
In this scenario, Gold could complete its corrective move toward the 3857 zone before starting a clean bullish leg
This level represents:
A potential completion of the correction
A liquidity grab area
An institutional demand zone
If price taps this zone and shows a clean bullish reaction, I expect a strong continuation to the upside, targeting a new ATH
📌 Scenario 2 – If price breaks Wave 1 → Direct bullish explosion and new ATH
If Gold breaks the Wave 1 level without revisiting the lower correction zone this could trigger a direct bullish continuation what I call the “big pump”
A clean breakout above Wave 1 would be a strong technical signal that Gold is ready to push into a new all-time high

11.28 Asian early-session plan for goldYesterdays' plan has hit both TARGETS.
Current Market Context
1. Rhythm: Thursday (pre-Thanksgiving) sideways consolidation → Friday Asia session breakout (out of the range) → EU/US session expected to trade in a narrow sideways range (pink box in chart), waiting for a breakout next Monday.
2. Key Levels:
- Support Zone: 4171.34 (Asia session breakout launch point)
- Near-term Resistance: ~4190 (current price area, no strong pressure yet)
- EMA Support: 5-period EMA = 4172.45 (aligns with the support zone)
EU/US Session Trading Strategy (Low-volatility environment, light position short-term)
Core Strategy: Range Trading (4172–4190)
- Long Setup (Buy on Pullback to Support):
- Entry: 4175 ± 2 (dip to support zone/5-period EMA; avoid precise "pinpoint" entries)
- Stop Loss: 4168 (below the support zone, abandon bullish bias)
- Targets: 4185 (range upper bound) → 4190 (if EU session leans bullish)
- Short Setup (Sell on Bounce to Resistance):
- Entry: 4190 ± 2 (test current price resistance)
- Stop Loss: 4198 (above the breakout level, abandon bearish bias)
- Targets: 4180 (range lower bound) → 4175 (support zone)
NEXT Exception Handling (If Range Breaks)
- Break Above 4190: Hold long positions, target 4200 (next Monday’s expected breakout level).
**Do NOT chase highs in the EU session* (low liquidity);
**avoid holding positions over WEEKEND.
Core Rules
Today’s EU/US session is "consolidation after breakout" with limited volatility. Cap position size at ≤0.5% per trade; no overholding (no overnight positions, as US markets are closed for Thanksgiving).
GOOD LUCK!
LESS IS MORE!

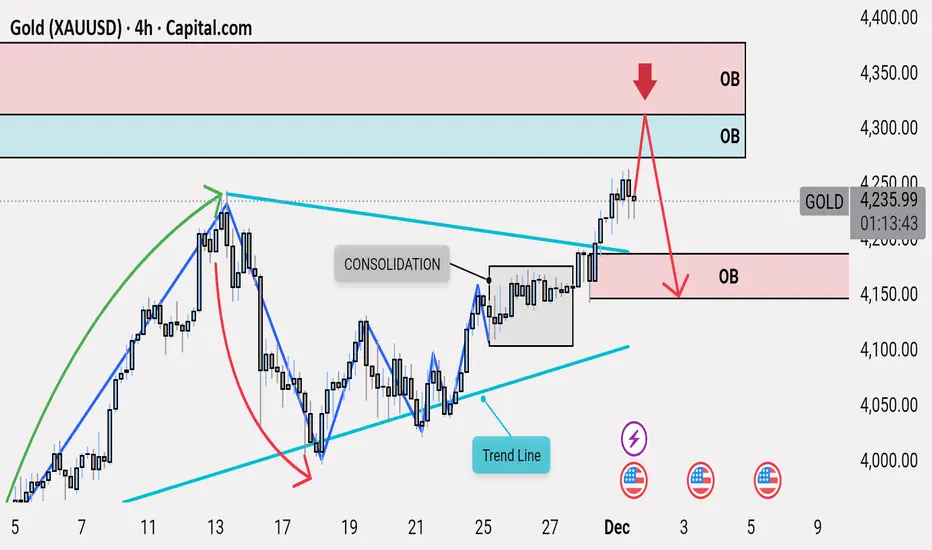
HIGH-PROBABILITY SELL | Upper Order Block RejectionThe market recently broke out of a consolidation zone, which had been holding price in a tight sideways structure. This breakout cleared the liquidity above the range, and price briefly surged past the trend line, showing temporary bullish momentum. However, this move is corrective within the broader bearish framework.
Price has now entered the imbalance region, leaving a clean Fair Value Gap (FVG) above, signaling inefficiency that the market is likely to revisit on the downside. Above this, the price is approaching a strong, unmitigated Upper Order Block — the key supply zone on the chart.
This Upper OB sits above the liquidity cleared during the consolidation breakout, making it the strongest potential rejection point. A reaction from this zone would likely trigger a sell-off back toward the Lower Order Block, filling the remaining FVG on the way down. This aligns with the original bearish structure, with the recent upward move being only a corrective retracement.
If the Upper OB holds, the expected move is a decline, making this a high-probability sell setup. Only a strong breakout above the OB with sustained closings would invalidate this bearish scenario.
XAUUSD: Short-Term Bullish Momentum Build-UpGold continues to shape a constructive bullish sequence on the 4-hour timeframe, with recent price action showing controlled momentum as the market transitions into December. The developing structure reflects an ongoing buyer-driven phase, keeping the upside scenario active while the trend maintains its current rhythm.
Disclosure: We are part of Trade Nation's Influencer program and receive a monthly fee for using their TradingView charts in our analysis.

Gold Pending Buy -4154 -4145 range target 4209expecting buy gold from 4154 to 4145 range,
Goldbach number
Goodluck
