XAUUSD (Gold) Is heading UPWARDS! - time to buyA few days back XAUUSD (Gold) was in a short term downtrend but finally broke out of it. The price broke through the downward channel to the upside, the price also held onto strong support (the white trendline which acted as a support level). The price tested the white trendline several times but kept bouncing back each time it hit the support zone. The price then broke through all recent resistance zones and will very likely hit the next resistance zone which is marked as the "Take profit" area. BUY GOLD NOW!
Trade ideas

GOLD at resistance? what's next??#GOLD... market trade near to his resistance area that is around 4140-45
keep close and if market hold it in that case you can see a drop towards supporting areas .
stay sharp.
NOTE.. we will go for cut n reverse above 4145 on confirmation.
good luck
trade wisely

“Resistance Rejection → Bearish Pullback Toward Support🟡 GOLD (XAU/USD) – Bearish Rejection from Major Resistance 🟥📉
🔍 Key Technical Insights
Price rejected the major resistance zone around 4,245 – 4,255
Rising Support Line has been broken → signals weakening bullish momentum ❌
Current structure favors a pullback toward demand area
Market seeking liquidity below recent swing lows 💰
🎯 Suggested Targets (with stickers)
Target Type Price Area Sticker
TP1 → Support Retest 4,210 – 4,215 🎯
TP2 → Demand Zone 4,195 – 4,205 📉💰
📌 TP1 is your high-probability target
📌 TP2 is for extended move if bearish momentum continues ⬇️
📌 Trade Setup Idea
📍 Sell Entry Zone:
➤ 4,238 – 4,245 (after failed breakout)
❌ Stop-Loss:
➤ Above 4,255
🎯 Take Profit:
➤ TP1: 4,215 🎯
➤ TP2: 4,200 📉💸
🧭 Overall Market Outlook
Factor Bias
Short-term Trend Bearish Pullback 🔻
Liquidity Downside targets in focus 💧
Resistance Reaction Strong rejection 🚫

Gold delivers my first Target of #4,252.80 markAs discussed throughout my Friday's session remark: 'My position: I have waited for Gold to deliver decent pullback and I found such on #4,185.80 Support test. I have engaged big Lot set of Buying orders (#4,177.80 Stop) and closed my orders on #4,202.80 extension. I will use this chance to congratulate Traders who followed my calls and had patience to hold the orders, well done / enjoy the Profits and have a great weekend!'
My position: I have made excellent Profits throughout Friday's session and spectacular Profits last night as Gold delivered #4,130.80 Gap, which I used and engaged #100 Lot Selling order there and closed on #4,118.80 delivering around #120k EUR Profits (remember every Gap has to be closed) and will not Trade for today's session anymore, very satisfied with Profits. On the contrary, I mentioned that #4,000.80 is and will represent Ultimate Bottom and 'floor' as I referred so if you Bought on #4,033.80 local Low's (then), you would be in excellent Profits by now as I expect #5,100.80 benchmark Price Target on Medium to Long-term on Gold. I have used #4,033.80 - #4,192.80 and utilized with engaging multi-Month Buying orders as I announced it many times on my recent ideas.

XAUUSD 30M — Retest Setup Toward Premium ZoneFOREXCOM:XAUUSD
Price is currently trading below trendline resistance after rejecting earlier highs. A potential pullback toward the 4,140–4,150 retest zone may offer a liquidity-based entry before continuation higher. As long as price holds above the invalidation zone, bullish structure remains valid.
Key Conditions
🔹 Bullish Scenario (Primary Bias)
Entry confirmation from: 4,140–4,150 zone
🎯 Target: 4,245–4,260
🛑 Invalidation/Stop: Below 4,120
A strong candle close above the trendline would further strengthen continuation.
Key Levels
Zone Type Level
Entry Zone 📍 4,140–4,150
Invalidation ❌ Below 4,120
Target 🎯 4,245–4,260
Trendline Break Confirmation Above 4,175
⚠️ Disclaimer: This analysis is for educational purposes only and not financial advice.

GOLD Free Signal! Sell!
Hello,Traders!
GOLD taps a clean supply zone after an extended move, showing rejection wicks and shifting orderflow that signal potential distribution. A short-term pullback into discounted levels may unfold toward the downside target.
--------------------
Stop Loss: 4,246$
Take Profit: 4,192$
Entry Level: 4,216$
Time Frame: 2H
--------------------
Sell!
Comment and subscribe to help us grow!
Check out other forecasts below too!
Disclosure: I am part of Trade Nation's Influencer program and receive a monthly fee for using their TradingView charts in my analysis.

Decent Profits on re-Buy ordersAs discussed throughout my yesterday’s session commentary: “ My position: After Profiting on multiple Medium-term Buying orders, I have turned now to more Intra-day calls as announced and am Buying Gold literally from #4,138.80 on multiple occasions and will continue to do so, and will Buy Big if #4,130.80 is delivered. I will not Sell Gold and my practical suggestion is to not Sell Gold at all costs.”
My position : I have engaged multiple Buying orders throughout yesterday’s session on #4,151.80 test and even though Volume was almost non-existent, I was well aware that Gold is Trading within Ascending Triangle and ready to deliver upside break-out. I have kept my order and on market opening Gold delivered slow but steady break1-out of #4,167.80 Resistance and I closed my set of aggressive Buying orders on #4,172.80 extension. I have re-Bought Gold this morning with #4,167.80 entry point and will continue Buying Gold from my key entry points. Congratulations on Profits and have a great weekend!

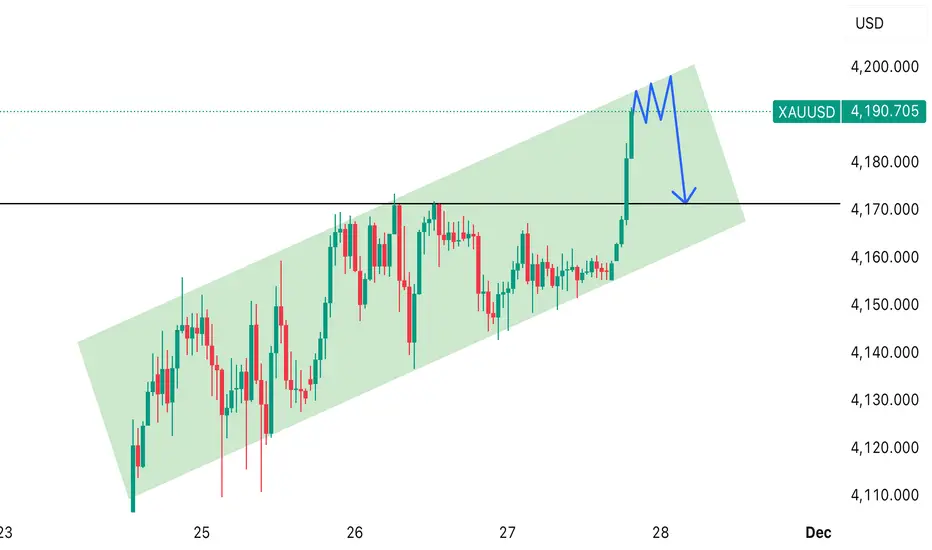
Gold is at the top of the channel and showing rejection, indicatGold (XAUUSD) is moving inside an upward channel. The price has reached the top of the channel and is showing rejection. The blue M-pattern suggests a possible pullback downward, targeting around the 4,170 zone
Gold market projection , (London opens )The 4160 zone has been mitigated , signaling continued momentum shift. Current price action shows increasing zeal to revisit the 4080–4070 imbalance pocket, with confluences to fully neutralize it before any decisive directional move.
This revisit would align with the broader structural flow, allowing price to reset and regain liquidity for the next phase of bullish or corrective expansion. follow for more insights , comment and boost idea

Gold Trade Plan 25/11/2025Dear Traders,
Gold is near the top of the descending channel. I expect the price to reach the 4160–4180 area, which is the channel's upper boundary, and based on the price action, we will assess whether the corrective wave will continue or a drop toward the trendline's lower boundary will occur in the first phase.
Regards,
Alireza!

XAUUSD – Bearish setup 15M Price has pushed deeply into the upper volatility bands, showing clear signs of exhaustion after a strong impulsive leg. The most recent candles are rejecting the premium zone, forming a potential short-term distribution area.
There are multiple bearish confluences lining up:
Price rejecting the upper band after extended upside
Momentum slowing as candles consolidate near resistance
Fib retracement aligning with key liquidity levels
If the rejection holds, I’ll be watching these 3 Fibonacci downside targets:
38.2% → ~4139
61.8% → ~4130
100% → ~4080
A break below the mid-channel should confirm downside continuation.

GOLD Will Move Higher! Buy!
Please, check our technical outlook for GOLD.
Time Frame: 9h
Current Trend: Bullish
Sentiment: Oversold (based on 7-period RSI)
Forecast: Bullish
The market is approaching a significant support area 4,165.22.
The underlined horizontal cluster clearly indicates a highly probable bullish movement with target 4,240.67 level.
P.S
Please, note that an oversold/overbought condition can last for a long time, and therefore being oversold/overbought doesn't mean a price rally will come soon, or at all.
Like and subscribe and comment my ideas if you enjoy them!

CLOSE THIS SELL
Close this trade because it would likely buy more , the bullish momentum i was expecting last week is rather back this week so we will be looking for buy entries rather, bullish momentum is strong now

GOLD Consolidation Starts (Correction zone) Buyers Slow ExitNow after the all time high of 3482.
GOLD enters into a Consolidation zone Starts or (Correction zone) Buyers Slow Exit.
So at current market price 4180 Sell and again buy at 4000 and again sell at 4170 range and again buy at 3890 and again sell at 4050 and again buy at 3890 and again sell at 4160 and again buy at 3737.
This is for Education Purpose only, am still testing WD Gann theory!

Elliott Wave Analysis XAUUSD – 28/11/2025Hello my friends, let’s update the Elliott Wave analysis on Gold together to see how the wave development may unfold today.
1. Momentum
Momentum D1
D1 momentum is currently contracting. We need to wait for a strong bearish daily close to confirm a momentum reversal. Once confirmed, the market may enter a downward phase lasting 4–5 days.
Momentum H4
H4 momentum is also narrowing, suggesting a potential short-term downside reversal. However, note the following:
• Price highs and momentum highs are forming higher highs and higher lows, which still supports the bullish structure.
• If H4 momentum truly reverses and moves into the oversold zone, price must break below 4142 to confirm a structural break and signal a genuine trend reversal.
Momentum H1
H1 momentum is turning downward and is aligned with H4. I expect the current price area to be the potential wave top.
________________________________________
2. Wave Structure
Wave Structure D1
The D1 wave structure remains unchanged. With D1 momentum still converging, price action continues to show slow upward movement.
• If price breaks above 4243, the 5-wave structure of the purple Y wave is invalidated.
• In that case, a different wave structure will be triggered (as mentioned in the previous plan), and I will update you when it occurs.
Wave Structure H4
We continue to follow the green ABC corrective structure, with price currently in wave C (green).
• As H4 momentum is in the overbought zone, I expect the current region to be the top of wave C.
• If H4 momentum dips into the oversold zone and price breaks below 4142, this will confirm a structural breakdown.
• However, if momentum enters oversold while price stays above 4142, we must be prepared for a continued bullish move.
Wave Structure H1
Yesterday, the RSI on H1 showed divergence, suggesting a possible completion of wave C. However, with the additional push during the Asian session, wave C likely extended further. Price is now at the target zone calculated earlier.
• With D1, H4, and H1 momentum all preparing to reverse, I expect the current price zone to be the top of wave C.
________________________________________
3. Trading Plan
The current price region remains our preferred SELL zone.
During the next H4 momentum cycle:
• If momentum enters the oversold zone but price fails to break below 4142, we should consider exiting early to protect capital.
Trade Setup
• Sell Zone: 4187 – 4190
• Stop Loss (SL): 4210
• TP1: 4158
• TP2: 4112
• TP3: 4081

“Sell-Side Reaction Zone – Personal Analysis Only”“Price is reacting from the sell-side area and I’m observing a possible bearish move.
This is only my personal market analysis for educational purposes, not financial advice.”

Double dipper XAUUSD *I am in no way a financial advisor and you should always do your own due diligence before placing any trade. Do not trade what you are not comfortable with losing. No trade is guaranteed.
Why not?👀

FVG- Order Block- ChocH- H2 gold🔥 Why the ENTRY is at 4186
It sits inside the premium zone (between 0.618–0.786 Fibonacci), which is where smart money prefers to SELL.
There is an unmitigated H2 FVG + Supply zone exactly there.
There is liquidity above (equal highs / wick highs), so price is likely to spike into this zone first.
It aligns with a previous swing high, making it a perfect reaction area.
➡ 4186 = Premium + Supply + FVG + Liquidity = A+ short entry
🛡 Why the STOP LOSS is at 4223
4220–4225 is the final liquidity pool above the supply.
If price breaks this level, the entire bearish idea becomes invalid.
Above 4223, H2 would create a bullish BOS, killing the short idea.
➡ 4223 = structural invalidation + liquidity protection
🎯 Why the TAKE PROFIT is at 3998
3998 is the next major H2/H4 demand zone.
It is the full imbalance (iFVG) fill target.
It aligns with the next liquidity pool below.
➡ 3998 = perfect smart money target


XAUUSD How to become successful in forex and stock trading:
1.Master fundamentals and technical analysis.
2,Build and follow a solid trading plan.
3.Apply strict risk management (1–2% rule).
4.Stay disciplined—control fear and greed.
5.Record and analyze every trade.
6.Focus on high-quality setups only.
7.Diversify across assets and markets.
8.Keep evolving—study, adapt, and grow daily.

GOLD Will Move Lower! Short!
Take a look at our analysis for GOLD.
Time Frame: 9h
Current Trend: Bearish
Sentiment: Overbought (based on 7-period RSI)
Forecast: Bearish
The price is testing a key resistance 4,126.79.
Taking into consideration the current market trend & overbought RSI, chances will be high to see a bearish movement to the downside at least to 4,038.14 level.
P.S
Please, note that an oversold/overbought condition can last for a long time, and therefore being oversold/overbought doesn't mean a price rally will come soon, or at all.
Like and subscribe and comment my ideas if you enjoy them!

Update on XAU Swing trade adjust the correction for wave 3. if buyers return to the demand zone.
as is the sell position

XAUUSD – Potential Reversal Zone Forming After BOS & CHoCH StrucChart Analysis
Based on the structure shown in your TradingView screenshot:
1. Market Structure
The chart shows a clear bullish trend leading into the current price.
Multiple Break of Structure (BOS) marks confirm buyers have been in control.
The earlier CHoCH indicates a temporary shift, but price reclaimed bullish momentum afterward.
2. Current Zone
Price has pushed into a potential reversal or supply area, shown by the shaded region around the “ENTRY” label.
This suggests you are planning a sell (short) position from that zone.
3. Premium/Discount Logic
Price is currently in the premium zone of the swing leg.
The “50% TP” line marks the midpoint of the recent bullish impulse—typical target when expecting a corrective move.
4. Short Setup Elements
Entry: At the top of the shaded zone (likely an imbalance or order block).
Stop-Loss: Presumably above the swing high inside the grey shaded area.
Take-Profit: At the 50% retracement of the previous impulse, which aligns with structure.
5. Momentum & Candlestick Behavior
The latest candles show slowing momentum into your entry zone—wicks and smaller bodies indicate weakening buyer pressure.
This supports the idea of a potential short-term reversal.
6. What Would Invalidate the Setup?
A decisive close above the upper boundary of the shaded zone → would signal continuation upward and invalidate the short.
7. What Strengthens the Setup?
Rejection wicks
Bearish engulfing from the entry zone
Lower time-frame BOS to the downside as confirmation
