GOLD its breakout? its selling turn??#GOLD... market just broke again his supporting area and in last turn market gave is a fake breakout.
so again if market holds below 4178-80 then we can expect further drop towards next supporting area.
stay sharp guys..
good luck
trade wisely
Trade ideas

Gold buy idea Gold Analysis
Gold stopped dropping since yesterday’s NY open. It continued falling during today’s Asia and London sessions, but failed to continue the drop into the Asia close, showing signs of weakening bearish momentum.
How to Trade It
1️⃣ Wait for price to drop to 4210
4210 is the closest psychological level and a key reaction zone.
2️⃣ Look for entry confirmation
At 4210, wait for either:
A bullish engulfing candle
A bullish pin bar
with above-average volume
This signals strong buyers defending the level.
If Price Does NOT Retrace to 4210
If gold continues rising without touching 4210, then:
Check the volume
If volume is above average, this confirms bullish continuation without a retest.
Targets
TP1: 4245
TP2: 4265
Invalidation
❌ If price drops to 4210 but none of the confirmations appear, do not take the trade.

XAUUSD structure is still bullish XAUUSD structur is still bullish
I will buy on every DIP
As I mentioned 4180-4190 area is my buy zone .
Secondly if H4 closed below 4175 then market will retest my 4145-4135 structural demand zone where I will start buying again .
Target remain same 4245 then 4275 on intraday

XAUUSD: Gold Wave HarmonyXAUUSD: Gold Wave Harmony
According to its wave structure, gold is completing a correction phase and preparing to form a new impulse. The chart shows a transition from sideways movement to a more dynamic wave, which could set the direction for the near term.
Main scenario: after the correction ends, a downward impulse sequence is expected to develop. Alternative scenario: if the market consolidates above recent highs, it could continue to rise, delaying the start of a new downward wave.
Idea for traders: watch for confirmation of the structure on lower timeframes and enter only after clear reversal signals appear.
Risk management: use clear stop levels and adjust the plan as new impulses emerge.
Friends, more wave analysis is available in our profile.
Subscribe to stay up to date with wave analysis!

GOLG SMC BUY IDEA 4160 DEMAND ZONE📌 SMC Buy-Side Idea (XAUUSD) — Entry 4160
Bias: Bullish
Timeframe: 15m
🔍 Market Structure
Market has broken previous structure with a clean BOS, confirming bullish order flow.
Price retraced back into the 15m Demand Zone (IDM).
4160 is sitting inside discount pricing, aligned with HL formation.
🟦 Entry Plan
Buy Limit: 4160 zone (inside 15m Demand)
Stop Loss: Below HL / Below the demand rejection
Take Profit: Three partial exits
🎯 Targets (3-Stage TP Distribution)
TP1: 4175
TP2: 4185
TP3 (Final): 4200
💡 Why Buy at 4160?
4160 = Perfect discount level
Confluence with 15m demand + IDM
Bullish BOS already printed
Liquidity above HH targeting 4200
📈 Expectation
If bulls defend 4160 demand, price should move toward 4175 → 4185 → 4200, sweeping all buy-side liquidity.

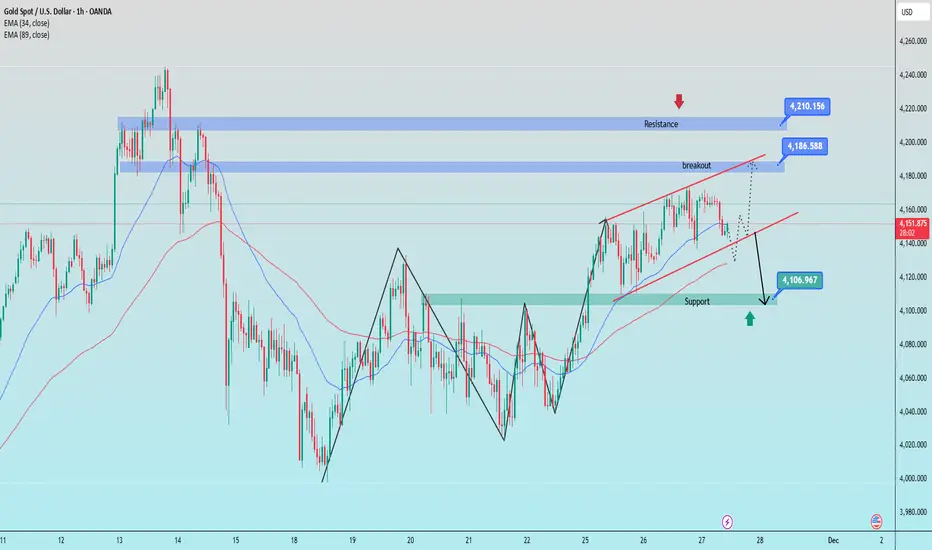
Gold is still moving sideways and waiting for a breakout1. Trendline Structure
Ascending Channel (red)
Upper trendline: price has been repeatedly rejected at the upper boundary → strong dynamic resistance.
Lower trendline: recently pierced slightly → indicates weakening buying pressure and increased correction risk.
2. Key Resistance
4,186 – 4,210: Strong supply zone + confluence with the upper trendline.
This is a zone that price will struggle to break without strong volume.
→ If price breaks above and successfully retests → the next target is the 4,210 area.
3. Key Support
4,105 – 4,110: Major support zone, confluence with EMA & the 0.5 Fibonacci level.
→ High probability that buyers will step in around this area.
4. Overview
Major Resistance: 4,186 – 4,210
Major Support: 4,105 – 4,110
Short-term Trend: weakening, leaning toward a corrective move.
Key Signal: a break below 4,140 → confirms a drop toward the support zone.
Bullish Scenario: only activated if the price reclaims 4,186.
BUY GOLD : 4107 - 4109
Stoploss : 4097
Take Profit : 100-300-500pips
SELL GOLD : 4209 - 4211
Stoploss : 4221
Take Profit : 100-300-500pips
XAU/USD Looking sell from supply zone at 4240 strong sellXAUUSD (Gold) – 1H Bearish Setup
Price is currently reacting from the 4240 supply zone, showing signs of weakness on the 1-hour timeframe.
I’m looking for a sell opportunity at the 4220 level.
Targets:
• TP1: 4207
• TP2: 4190
• TP3: 4171
Market structure remains bearish for now, but always remember:
✔️ Follow your trading plan
✔️ Use proper risk management
✔️ Protect your capital first
If you find this analysis helpful—Like, Follow, Comment & Share 🔄

XAUUSD – Key Support Reaction & Potential Breakout ZoneThis chart highlights a short-term support area around 4148 where price showed a strong reaction. If price continues to hold above this zone, it may attempt a move toward the next resistance region near 4170.
The structure shows a possible shift in momentum, but confirmation would require a clean break above the marked resistance line. The lower horizontal level is used as an invalidation point for the idea.
This analysis is for educational purposes only and is based on chart structure, support/resistance levels, and market behavior.

XAUUSD – Liquidity Grab Done, Bearish Continuation ExpecteGold (XAUUSD) – Bearish Retracement After Buy-Side Liquidity Sweep
Price has tapped into a major buy-side liquidity zone, clearing the previous highs and triggering liquidity grab. After the sweep, market structure shifted and price started forming a clean descending channel, showing controlled bearish momentum.
Currently, price has pulled back into the premium retracement zone, aligning with the channel’s upper boundary — a strong confluence for a potential short setup.
If the bearish structure continues, I am expecting:
Short-term retracement + bearish continuation
Targeting the next demand imbalance zone marked on the chart
A deeper drop toward the 4,155 – 4,160 zone where strong buy orders may appear
Reasons for Bearish Bias:
• Buy-side liquidity already cleared (reversal signal)
• Clear bearish channel structure
• Retest of broken structure + premium zone
• Multiple imbalance zones below waiting to be filled
This idea remains valid as long as price stays below the highlighted rejection area.

Downmove for goldHi traders,
Last week gold made a bigger upmove then expected. This changed the pattern for me. I think the correction (orange wave 4) is a Triangle that rejected from the 38.2 fib level.
So next week we could see a downmove. If it's corrective, we could see the next impulsive upmove.
If the upmove is corrective it could come down for the last time.
Let's see what price does and react.
Trade idea: Wait for a correction down and a change in orderflow to bullish to trade longs.
This shared post is only my point of view on what could be the next move in this pair based on my technical analysis.
But I react and trade on what I see in the chart, not what I've predicted or expect.
Don't be emotional, just trade your plan!
Eduwave

Gold 4H – Bearish Harmonic Rejection SetupGold is currently testing a major descending trendline drawn from the previous swing high (Point A). Price has tapped into a strong supply zone / rejection block around 4150–4170, which also aligns with the 0.618 and 0.70 Fibonacci retracement levels taken from the C–D leg projection.
The structure shows a potential harmonic completion, where the market has printed an A–B–C pattern and is now forming the final leg toward D. The repeated rejections from the shaded supply zone indicate weakening bullish momentum.
As long as price remains below this supply region and fails to break the descending trendline, the setup favors a downside continuation, targeting the lower trendline support near 3800–3850, completing the projected D-leg.
Key Highlights:
Price reacting to multi-touch descending trendline
Strong supply zone (4150–4170) aligned with 0.618/0.70 fib
Bearish harmonic structure aiming for D-leg completion
Potential downside target: 3800–3850
Bias remains bearish unless price breaks and holds above the supply zone

GOLD at cut n reverse area? whats next??#GOLD - market perfectly moved as per our last idea regarding gold and now market just trade above his resistance area.
that resistance area is turned into supporting area after break above and sustain. that is 4245
keep close that area 4245 and holding of that area means we can expect further bounce otherwise not at all.
NOTE: we will go for cut n reverse below 4245 on confirmation.
good luck
trade wisely

Gold Trade Plan 01/12/2025Dear Traders,
“The price has penetrated the previous pivot, and I expect the bullish move to continue toward the top of the channel. Considering the news about potential rate cuts and the U.S.–Venezuela conflict, buyers are currently stronger than sellers in the market. Since there are no major news events today and trading volume is low, I don’t expect significant volatility.”
Regards,
Alireza!

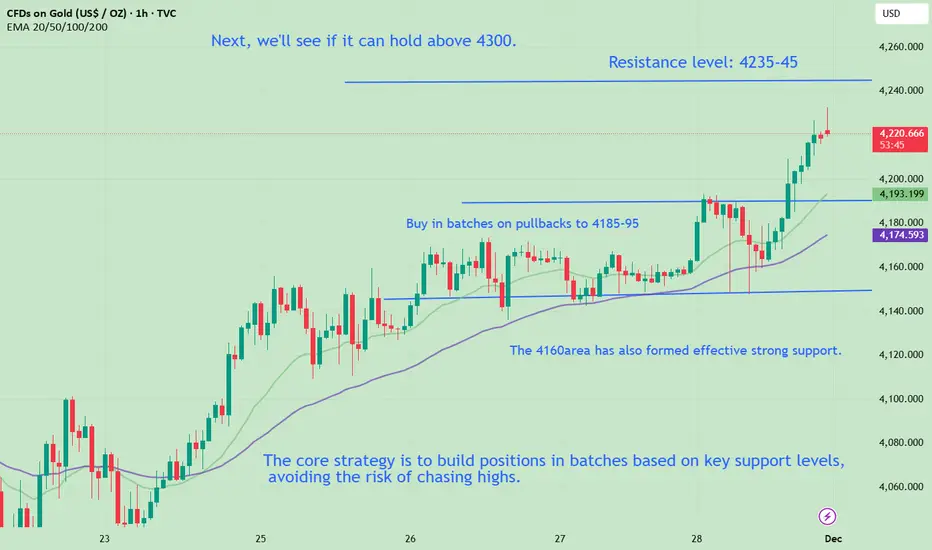
How Much Upside Potential Is There This Week? Strategy Update
Gold continued its upward trend. Despite the early closure of the US market on Thursday and Friday for Thanksgiving, and the technical glitch on Friday causing insufficient market liquidity and abnormal gold prices, our bullish momentum continued. Gold's sharp rise on Friday not only successfully broke through and held the key $4200 level but also reached a new high in nearly two weeks, providing a strong conclusion to the week. We repeatedly advised buying in the $4165-75 range, emphasizing the perfect buy-on-dips strategy, and gold ultimately rebounded as expected. You can check our historical recommendations to verify their accuracy.
News:
As the week draws to a close, market focus shifts to the upcoming "data deluge week." From Monday to Friday next week, major global economies will release a series of key economic indicators, the most anticipated being the US September Personal Consumption Expenditures (PCE) price index, to be released next Friday (December 5th). As the Federal Reserve's most important indicator for measuring inflation, this data will be released before the Fed's December interest rate meeting, and its impact is self-evident.
This Week's Gold Market Analysis:
Based on last week's closing price, we continue to focus on the 4185-95 support level at the open. Our strategy is to buy on dips that hold above this level, with the core strategy being to build positions in batches based on key support levels. Looking at the 4-hour chart, the key resistance level to watch is 4235-45; avoid chasing highs. This is the overall strategy, and we will update it again based on the specific market conditions at the open. Market fluctuations are normal; maintain a calm attitude towards rises and falls. Let's work together next week to flexibly and steadily pursue greater profits in this unpredictable market.
I focus solely on short-term trading and clear market analysis. In short-term trading, there is no market that rises or falls forever, only the right entry point at any given moment. Find the rhythm and follow the trend. This is the essence of trading. Currently, you must seize every opportunity to buy on pullbacks. If you cannot execute trades precisely, try my method: first test the market with a small position, then add to your position on pullbacks. This way, you won't miss any opportunities. If you need to recover significant losses or obtain precise trading signals, please contact me. There may be delays in article updates; you can find the channel entry here.
XAUUSD: Will It Continue to Decline?Last week, I had been continuously suggesting going long on gold, and the market aligned with my analysis by breaking through the $4,200 level rapidly. However, not every trader followed my strategy to go long.
There are likely still many traders who chose to go short and thus incurred losses. A downward correction is expected next week, which may be your last chance to exit .
I send out accurate signals every day after the market opens, so don’t miss out.

XAUUSD: Market Analysis and Strategy for November 27Gold Technical Analysis:
Daily Resistance: 4210, Support: 4000
4-Hour Resistance: 4180, Support: 4110
1-Hour Resistance: 4170, Support: 4130
The weekly chart continues its bullish trend. Tomorrow's monthly/weekly chart closes, directly impacting the December technical outlook.
The daily chart continues its upward trend. The newly formed "rounded bottom" needs to be monitored for its sustainability. Bollinger Bands are widening upwards, and the middle band and moving average support are gradually moving upwards. As mentioned in recent analyses, the main strategy is to follow the trend and be bullish. The next key level to watch is 4200. Long-term holders can wait for the Fed's interest rate decision before buying. The ideal long-term entry point for gold remains below 4000; however, short-term traders can buy low and sell high.
Based on the 1-hour chart, gold continued its upward trend during the European session, with the candlestick pattern indicating an upward channel. The next resistance level to watch is around 4180, followed by the psychological resistance at 4200. Support levels are around 4150/4140.
Trading Strategy:
BUY: 4150~4140
Selling strategies should be determined based on the real-time candlestick pattern.
More Analysis →

XAUUSD – H1 uptrend channel, short-term downside risk increasingXAUUSD – H1 uptrend channel, short-term downside risk increasing Brian – Prioritize short selling at the channel peak, wait to buy back at lower support
I. Strategy Summary Gold is trading in an uptrend channel on H1, but the rise around 4.160 shows signs of weakening, increasing short-term correction risk.
Preferred Scenario: Short sell at the channel peak 4.162–4.164, targeting support areas 4.145 – 4.130 – 4.115 – 4.100.
After the correction, the 4.100–4.080 area may become the foundation for the next rise in the larger trend.
Important price areas to watch: 4.139 – 4.127 – 4.110 – 4.088.
II. Macro Context & News 27/11
02:00 – Fed releases Beige Book This document updates the Fed branches' assessment of the US economic situation.
Describing slower growth, cooling price pressures will further reinforce expectations that the Fed will soon cut interest rates → supporting gold.
Conversely, if the Beige Book describes the economy as still “resilient,” the market may temporarily slow down pricing in rate cuts → causing a short-term adjustment for gold.
19:30 – ECB releases October meeting minutes
If the minutes lean towards the scenario of keeping high interest rates longer, the EUR may be supported, indirectly affecting the USD and gold inflows.
However, the impact is usually not as strong as US data, mainly affecting the overall risk-on/risk-off sentiment.
General Context: Gold has surpassed 4.160 USD/oz as the market increasingly expects the Fed to cut interest rates as early as December, reducing the appeal of interest-bearing assets and increasing the allure of gold – a non-yielding asset. This creates a support foundation for the medium-term uptrend, but after a hot rise, technical adjustments on H1 are normal.
III. Technical Structure – H1 uptrend channel
The price is within the H1 uptrend channel, with rising peaks and troughs, but the upper area near 4.160 coincides with:
The upper boundary of the price channel. The “Sell POC” area on the chart – where liquidity and sell orders are concentrated.
Preferred scenario on the chart: The price may slightly rebound to the POC area 4.162–4.164, then be rejected and slide to the important support area around 4.110 before extending the adjustment down to 4.100–4.080.
The lower trendline of the uptrend channel also acts as a short-term buy area if a clear candle reaction appears.
Notable price areas on H1: Resistance: 4.162–4.164 (channel peak + POC). Intermediate support: 4.139 – 4.127 – 4.110. Deep support: 4.088 – 4.080 – 4.100 (area that may form the bottom for the next rise).
IV. Trading Plan 1. Preferred Scenario – Short sell at the channel peak Idea: Short sell when the price rebounds to the upper boundary of the H1 uptrend channel and POC 4.162–4.164, expecting a correction to support.
Sell: 4.162–4.164 SL: 4.168 TP targets: TP1: 4.145 TP2: 4.130 TP3: 4.115 TP4: 4.100
This is a counter-move order in the uptrend channel, only targeting a short-term correction, not a major trend reversal scenario.
2. Supplementary Scenario – Short buy at support trendline Idea: When the price hits the lower trendline of the H1 uptrend channel and a nice candle reaction appears, consider a short-term buy according to the channel, prioritizing areas:
4.139 – 4.127 – 4.110 – 4.088
Specific Entry/SL levels will depend on the actual price reaction at the trendline, but the general principle:
Buy close to the trendline,
SL placed below the immediate support area,
TP aimed at the middle of the channel or the nearest resistance.
V. Risk Management & Notes
Do not open new positions right before or at the time of the Beige Book and ECB minutes release, as volatility may suddenly increase, widening spreads.
The sell order at 4.162–4.164 is a short-term counter-trend order in the uptrend channel, requiring moderate volume and strict adherence to SL 4.168.
If the price clearly breaks and holds above the 4.170 area, the H1 correction scenario weakens – in that case, stay out, wait for a new structure instead of trying to maintain a sell view.

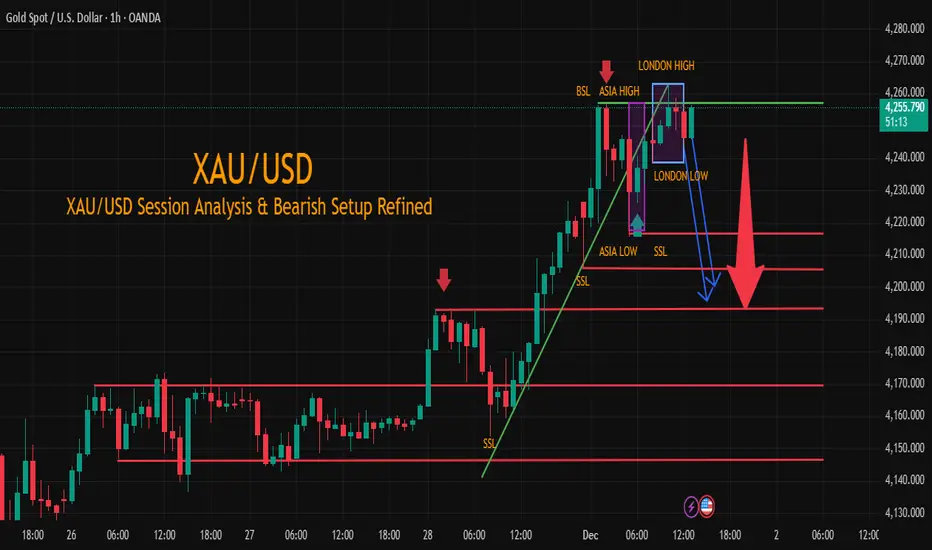
XAU/USD BSL Swept Liquidity Grab Confirms and wait for SSL.The bullish momentum in Gold (XAU/USD) has hit a major wall! On the 1-hour chart, we witnessed a classic Buy Side Liquidity (BSL) sweep as the price briefly moved above the Asia High and tagged $4,260, forming the definitive London High. This liquidity grab confirms the initiation of a high-probability reversal setup.
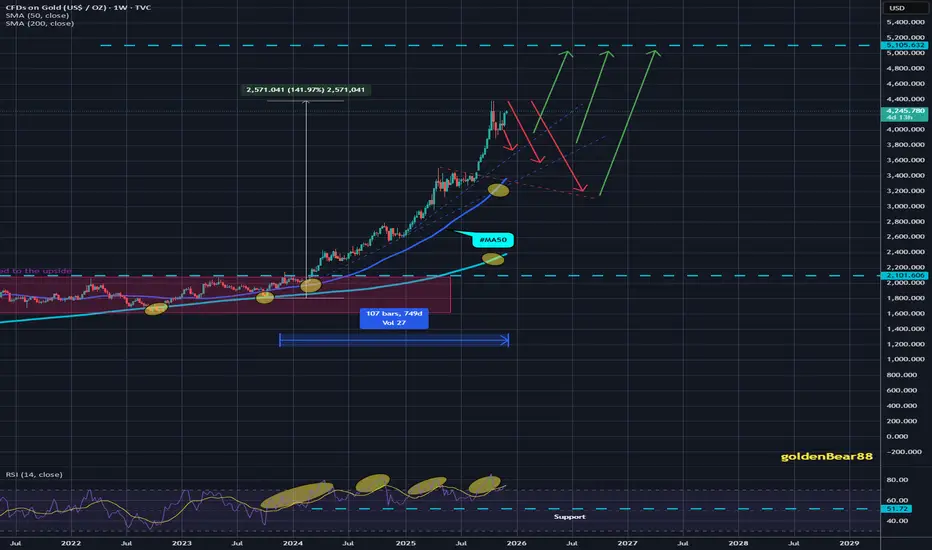
Gold delivers my first Target of #4,252.80 markAs discussed throughout my Friday's session remark: 'My position: I have waited for Gold to deliver decent pullback and I found such on #4,185.80 Support test. I have engaged big Lot set of Buying orders (#4,177.80 Stop) and closed my orders on #4,202.80 extension. I will use this chance to congratulate Traders who followed my calls and had patience to hold the orders, well done / enjoy the Profits and have a great weekend!'
My position: I have made excellent Profits throughout Friday's session and spectacular Profits last night as Gold delivered #4,130.80 Gap, which I used and engaged #100 Lot Selling order there and closed on #4,118.80 delivering around #120k EUR Profits (remember every Gap has to be closed) and will not Trade for today's session anymore, very satisfied with Profits. On the contrary, I mentioned that #4,000.80 is and will represent Ultimate Bottom and 'floor' as I referred so if you Bought on #4,033.80 local Low's (then), you would be in excellent Profits by now as I expect #5,100.80 benchmark Price Target on Medium to Long-term on Gold. I have used #4,033.80 - #4,192.80 and utilized with engaging multi-Month Buying orders as I announced it many times on my recent ideas.

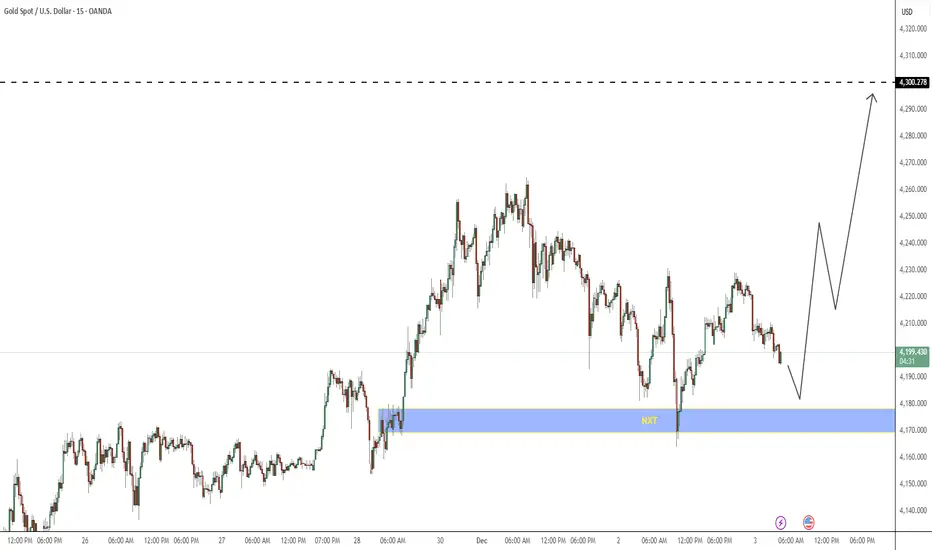
The $4200 Re-Fueling Scenario Before $4300 Blast Off?Market Scenario: Gold is expected to enter a consolidation (ranging) phase between $4170 and $4200 to gather the necessary liquidity and energy.
Bullish Condition: To confirm the move higher, the price must decisively break the $4200 resistance and successfully flip it into support.
Ultimate Target: If the consolidation and breakout are successful, the next target is $4300.
XAUUSD – Bullish Structure Holding Above EMAsXAUUSD – Bullish Structure Holding Above EMAs
Gold continues to trade in an upward structure, with price respecting both the 7-EMA and 21-EMA on the 15-minute chart. Momentum remains constructive as buyers maintain control above the intraday trendline and volume supports the ongoing push.
The setup highlights a potential continuation zone, with price consolidating above key EMAs and forming higher lows. As long as structure holds, the market may look for liquidity toward the next intraday highs.
This idea focuses on the current price behavior, EMAs alignment, and bullish market sentiment—not financial advice.

GOLD bounces back amid Fed signals and political turmoilOANDA:XAUUSD opened the Asian trading week with strong upward momentum, reflecting rising confidence that the Federal Reserve will cut interest rates as early as December. Spot gold reached $4,256.31/oz, gaining $37 within just a few hours — the highest level in five weeks.
Shifting rate-cut expectations remain the dominant driver. A series of dovish comments from Fed officials, combined with weakening economic data following the U.S. government shutdown, has led the market to price in an 87% probability of a rate cut, according to FedWatch. As the opportunity cost of holding gold decreases, capital is rapidly flowing into non-yielding safe-haven assets.
Long-term support remains intact: accelerating purchases by central banks and significant inflows into gold ETFs helped push prices to a historical peak of $4,380/oz in October. With an almost uninterrupted rally since the start of the year, gold is on track for its strongest annual performance since 1979.
However, the monetary-policy outlook is clouded by political uncertainty. President Trump announced he had chosen a successor to Chairman Jerome Powell and asked the nominee to commit to a more aggressive rate-cutting cycle.
Kevin Hassett, a senior White House economic advisor, is now estimated by markets to have a 64% probability of being appointed — a sharp rise from last week. A more politically influenced Fed could increase volatility across asset markets.
On the geopolitical front, early signs of reconciliation between the U.S. and Ukraine have temporarily reduced safe-haven demand, but not enough to slow gold’s upward momentum. Washington’s decision to send envoy Steve Witkov to Moscow this week signals a new diplomatic phase, though risk levels remain elevated.
Today’s main focus is the ISM Manufacturing PMI. A stronger-than-expected reading may support the USD in the short term, slowing gold’s advance. Conversely, weaker data would reinforce rate-cut expectations and continue to support the metal’s upward trend.
With rapidly changing policy expectations, firm technical momentum, and persistent geopolitical risk, the gold market enters December with a clearly bullish structure — but also heightened sensitivity as the Fed and the White House reshape policy direction simultaneously.
Technical Analysis & OANDA:XAUUSD Outlook
• Trend structure: Price is maintaining a medium-term ascending channel, continuously forming higher lows and higher highs, indicating that the primary uptrend remains intact.
• Key level has been reclaimed: Price closed above the 4,128–4,216 USD resistance zone (Fib 0.236 and horizontal resistance), while also holding above the short-term MA21. This satisfies both the necessary condition (holding above support/trendline) and the sufficient condition (breaking and confirming a key resistance zone) for an uptrend cycle to be considered underway.
• Momentum indicators: RSI has recovered above the mid-range and is not yet overbought, suggesting there is still room for upside momentum.
• Technical conclusion: With a close and sustained move above 4,216 USD, the bullish structure is confirmed. The next immediate technical target is to retest the all-time high around ~4,380 USD/oz, with the next extension zone near 4,500 USD in a strong capital-inflow scenario.
SELL XAUUSD PRICE 4331 - 4329⚡️
↠↠ Stop Loss 4335
→Take Profit 1 4323
↨
→Take Profit 2 4317
BUY XAUUSD PRICE 4191 - 4193⚡️
↠↠ Stop Loss 4187
→Take Profit 1 4199
↨
→Take Profit 2 4205
