XAUUSD: Gold Wave HarmonyXAUUSD: Gold Wave Harmony
According to its wave structure, gold is completing a correction phase and preparing to form a new impulse. The chart shows a transition from sideways movement to a more dynamic wave, which could set the direction for the near term.
Main scenario: after the correction ends, a downward impulse sequence is expected to develop. Alternative scenario: if the market consolidates above recent highs, it could continue to rise, delaying the start of a new downward wave.
Idea for traders: watch for confirmation of the structure on lower timeframes and enter only after clear reversal signals appear.
Risk management: use clear stop levels and adjust the plan as new impulses emerge.
Friends, more wave analysis is available in our profile.
Subscribe to stay up to date with wave analysis!
Trade ideas

GOLG SMC BUY IDEA 4160 DEMAND ZONE📌 SMC Buy-Side Idea (XAUUSD) — Entry 4160
Bias: Bullish
Timeframe: 15m
🔍 Market Structure
Market has broken previous structure with a clean BOS, confirming bullish order flow.
Price retraced back into the 15m Demand Zone (IDM).
4160 is sitting inside discount pricing, aligned with HL formation.
🟦 Entry Plan
Buy Limit: 4160 zone (inside 15m Demand)
Stop Loss: Below HL / Below the demand rejection
Take Profit: Three partial exits
🎯 Targets (3-Stage TP Distribution)
TP1: 4175
TP2: 4185
TP3 (Final): 4200
💡 Why Buy at 4160?
4160 = Perfect discount level
Confluence with 15m demand + IDM
Bullish BOS already printed
Liquidity above HH targeting 4200
📈 Expectation
If bulls defend 4160 demand, price should move toward 4175 → 4185 → 4200, sweeping all buy-side liquidity.

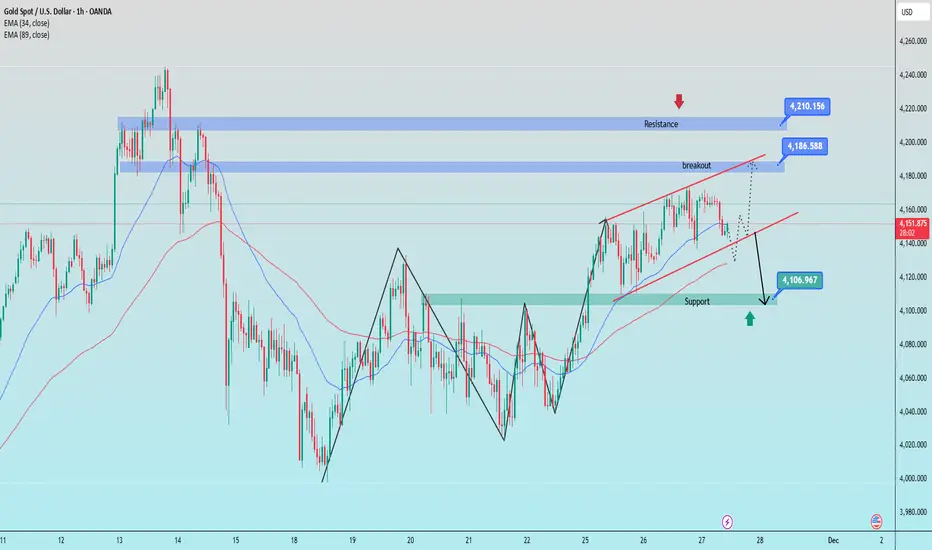
Gold is still moving sideways and waiting for a breakout1. Trendline Structure
Ascending Channel (red)
Upper trendline: price has been repeatedly rejected at the upper boundary → strong dynamic resistance.
Lower trendline: recently pierced slightly → indicates weakening buying pressure and increased correction risk.
2. Key Resistance
4,186 – 4,210: Strong supply zone + confluence with the upper trendline.
This is a zone that price will struggle to break without strong volume.
→ If price breaks above and successfully retests → the next target is the 4,210 area.
3. Key Support
4,105 – 4,110: Major support zone, confluence with EMA & the 0.5 Fibonacci level.
→ High probability that buyers will step in around this area.
4. Overview
Major Resistance: 4,186 – 4,210
Major Support: 4,105 – 4,110
Short-term Trend: weakening, leaning toward a corrective move.
Key Signal: a break below 4,140 → confirms a drop toward the support zone.
Bullish Scenario: only activated if the price reclaims 4,186.
BUY GOLD : 4107 - 4109
Stoploss : 4097
Take Profit : 100-300-500pips
SELL GOLD : 4209 - 4211
Stoploss : 4221
Take Profit : 100-300-500pips
XAUUSD – Key Support Reaction & Potential Breakout ZoneThis chart highlights a short-term support area around 4148 where price showed a strong reaction. If price continues to hold above this zone, it may attempt a move toward the next resistance region near 4170.
The structure shows a possible shift in momentum, but confirmation would require a clean break above the marked resistance line. The lower horizontal level is used as an invalidation point for the idea.
This analysis is for educational purposes only and is based on chart structure, support/resistance levels, and market behavior.

XAUUSD – H4 Trend Structure Awaiting BreakoutXAUUSD – H4 Trend Structure Awaiting Breakout
Brian – Strategy to Buy on Pullback in Uptrend Channel
I. Strategy Summary
Gold continues its uptrend on H4, supported by the upward trendline from the 3,880–3,900 region.
The price is testing the resistance zone of 4,133–4,150, coinciding with the H4 supply and descending trendline, making short-term corrections likely.
Main strategy: wait for a pullback to support/FVG to buy with the trend, avoid FOMO buying at resistance.
Key levels to note: closing below 4,000 weakens the uptrend structure; below 3,884 risks shifting to a medium-term downtrend.
II. Macro Context
Unemployment Claims (weekly unemployment benefits):
Forecast: 226K
Previous: 220K
Higher-than-expected figures → indicate a weakening labor market, cooling economy, increasing the likelihood of the Fed easing sooner → real yields decrease, supporting gold.
Better-than-expected figures (lower than forecast) → support USD and bond yields, potentially causing short-term pressure on gold.
Geopolitical:
Trump's statement on easing "deadline" pressure for Russia–Ukraine negotiations ("the deadline will be when the issue is resolved") helps the market worry less about a hard deadline, but conflict risks remain. The demand for gold as a safe haven remains stable, not overly inflated but also unlikely to disappear entirely.
III. Fundamental Picture
Expectations for a rate cut cycle in 2025 continue to support gold as the market gradually prices in lower real interest rates in the medium to long term.
The demand for holding defensive assets persists amid slowing global growth and unresolved geopolitical hotspots.
In the short term, USD and US bond yields remain the two leading variables; any USD recovery can pull gold back to technical support areas, creating opportunities for buy-on-dip strategies.
IV. Technical Structure – H4 Trend Channel & FVG Zone
On H4, the price is moving within an uptrend channel, with the support trendline respected multiple times since the end of last month.
Above is the descending trendline connecting the nearest peaks, creating a price compression zone as the market approaches the 4,133–4,150 area. This is a confluence resistance zone:
The nearest swing high.
H4 supply zone.
Intersection with the descending trendline.
Notable price zones:
Resistance: 4,133–4,150 – a zone that may trigger short-term profit-taking and create a correction.
Near support/FVG: 4,078–4,080 – FVG zone combined with support after the previous breakout.
Psychological support: 4,000 – if H4 closes below this area, the uptrend structure weakens.
Medium-term reversal level: 3,884 – closing below here opens the risk of shifting entirely to a medium-term downtrend.
V. Trading Plan
Scenario 1 – Buy with the Trend (Priority)
Idea: wait for a shallow pullback to near support in the H4 uptrend channel and then buy.
Entry: 4,111–4,114
SL: 4,005
TP: 4,133 – 4,150 – 4,172 – 4,190
Scenario 2 – Buy Deep at FVG Zone
Idea: if a stronger pullback to FVG 4,078–4,080 occurs, take advantage of the good price zone to buy.
Entry: 4,078–4,080
SL: 4,073
TP: 4,100 – 4,115 – 4,142
VI. Risk Management & Notes
Limit opening new orders at the time of Unemployment Claims announcement due to potential volatility and spread widening.
If H4 closes below 4,000, reassess all current buy positions.
If H4/Daily closes below 3,884, consider the medium-term uptrend structure broken; prioritize staying out to observe or wait for a new downtrend scenario instead of continuing to look for buying points.

Gold 4H – Bearish Harmonic Rejection SetupGold is currently testing a major descending trendline drawn from the previous swing high (Point A). Price has tapped into a strong supply zone / rejection block around 4150–4170, which also aligns with the 0.618 and 0.70 Fibonacci retracement levels taken from the C–D leg projection.
The structure shows a potential harmonic completion, where the market has printed an A–B–C pattern and is now forming the final leg toward D. The repeated rejections from the shaded supply zone indicate weakening bullish momentum.
As long as price remains below this supply region and fails to break the descending trendline, the setup favors a downside continuation, targeting the lower trendline support near 3800–3850, completing the projected D-leg.
Key Highlights:
Price reacting to multi-touch descending trendline
Strong supply zone (4150–4170) aligned with 0.618/0.70 fib
Bearish harmonic structure aiming for D-leg completion
Potential downside target: 3800–3850
Bias remains bearish unless price breaks and holds above the supply zone

Can Gold Accelerate its Rise? Updated Recommendation
Gold prices have continued to rise, but have shown signs of pullback three times around 4170. Moreover, while gold has maintained an upward trend for the past two days, there is still significant room for pullback during the rise, thus shorting gold still has good profit potential. In the short term, the 4168-78 range has become the last line of defense for bears. This may be our last chance to short gold, so I will still consider shorting gold in the 4168-4178 range.
Gold broke through the 4160 resistance area in Asian trading today, and is facing a short-term correction. However, it continues to maintain its strength at high levels. As long as the center of gravity continues to move upward today, the gold bulls may continue to exert force at any time. I believe the price will complete a valid breakout after the correction, and the entry point for long positions is 4120-30.
Our current trading plan is to first buy short positions and then buy long positions. I only focus on short-term trading and clear market analysis. In short-term trading, there is no market that rises or falls forever, only the right entry point at the moment. Find the rhythm and follow the trend. This is the essence of trading. If you don't yet have a gold trading plan or strategy and are seeking consistent and stable returns, feel free to contact me. Let's work together to flexibly and steadily pursue greater profits in the ever-changing market!


XAUUSD – Inverted Head and Shoulders Pattern Not Fully Played...XAUUSD – Inverted Head and Shoulders Pattern Not Fully Played Out, Continue to Prioritize Buying at POC
I maintain the view: the current main trend is to buy according to the inverted head and shoulders structure, the upward wave is not yet complete. The plan is to wait for the price to adjust to the POC area to re-enter the trend, not to chase buying at high levels.
🎯 Main Scenario – BUY THE DIP AT POC
Buy: 4.133 – 4.130
SL: 4.123
TP: 4.155 – 4.178 – 4.200 – 4.250 – extend if the trend remains strong
For me, the total risk for each order does not exceed 1–2% of the account. A good order with poor capital management is still a wrong order.
1. Basic Context
Gold is maintaining its upward momentum, trading near the highest levels in about two weeks.
The USD weakens as the market increases bets on the scenario of the Fed cutting interest rates soon, following data showing that inflation continues to cool down.
Lower yields and USD mean the opportunity cost of holding gold decreases, supporting the trend of money flow returning to safe-haven assets like gold.
In this context, I do not prioritize looking for large sell orders. Every adjustment is mainly seen as an opportunity to accumulate buying positions.
2. Technical Analysis & Market Sentiment
On the H1 frame, gold has formed and activated an inverted head and shoulders pattern, confirming the upward reversal phase.
The price is returning to test the POC area around 4.133–4.130, coinciding with the previous accumulation area – where the market once absorbed a large number of sell orders. This is the area I prioritize waiting to buy.
Below is a deeper FVG area that acts as a secondary support; I do not wait for the price to go too deep to avoid missing the main rhythm of the pattern.
Regarding price behavior, recent adjustments have been quickly absorbed, with continuous wick candles appearing, showing that buyers still hold the initiative. I wait for a neat pullback to the POC, with a strong enough buying reaction to trigger the entry scenario.
3. Action Plan
Only start disbursing when the price reaches the 4.133–4.130 area, absolutely no FOMO chasing buys.
Take partial profits at levels 4.155 – 4.178 – 4.200 – 4.250, leaving the rest open if gold continues to expand the upward wave.
If the price breaks through 4.123 and closes below this area, I decisively cut losses, stand aside to re-evaluate the structure – do not hold onto a view when the market has changed.
If this analysis is useful to you, please follow the TradingView channel and leave a comment with your perspective. I always read feedback to adjust and improve the way I share in future posts.

Gold Tests Channel High Amid Divergence RiskGold is approaching a key inflection point on the hourly chart as a potential (A)-(B)-(C) corrective structure matures beneath a well-defined ascending channel. Price is currently testing the upper boundary of this channel while momentum begins to soften, reflected in an emerging bearish divergence against short-term oscillators.
The advance off the mid-month low appears corrective, with the internal structure of wave (B) unfolding as a three-legged zigzag. The wave count suggests limited room for further upside: the channel ceiling aligns closely with the invalidation level for the developing zigzag, reinforcing the risk of a turn.
A break lower from the upper boundary would open the way for a targeted wave (C) decline. Key Fibonacci projections cluster between 4,045 (the 0.618 extension) and 3,993 (the 0.786 retracement), forming a natural demand zone where the larger wave ② may complete. This region also coincides with internal trendline support from the prior November low.
Although the medium-term structure remains constructive while the deeper bullish invalidation level holds, the immediate picture shows gold vulnerable to a near-term pullback before a potential resumption of the broader wave ③ advance later in December.

XAUUSD: Market Analysis and Strategy for November 27Gold Technical Analysis:
Daily Resistance: 4210, Support: 4000
4-Hour Resistance: 4180, Support: 4110
1-Hour Resistance: 4170, Support: 4130
The weekly chart continues its bullish trend. Tomorrow's monthly/weekly chart closes, directly impacting the December technical outlook.
The daily chart continues its upward trend. The newly formed "rounded bottom" needs to be monitored for its sustainability. Bollinger Bands are widening upwards, and the middle band and moving average support are gradually moving upwards. As mentioned in recent analyses, the main strategy is to follow the trend and be bullish. The next key level to watch is 4200. Long-term holders can wait for the Fed's interest rate decision before buying. The ideal long-term entry point for gold remains below 4000; however, short-term traders can buy low and sell high.
Based on the 1-hour chart, gold continued its upward trend during the European session, with the candlestick pattern indicating an upward channel. The next resistance level to watch is around 4180, followed by the psychological resistance at 4200. Support levels are around 4150/4140.
Trading Strategy:
BUY: 4150~4140
Selling strategies should be determined based on the real-time candlestick pattern.
More Analysis →

ANALYSIS ON GOLDI see a Complete W structure formation double top and OB formation at levels 4174-4178 pushing the gold downwards to 4145-4135 levels
Gold sell 4164-4168
Safe sell 4174-4178
Tp levels on the chart
Happy trading

Elliott Wave Analysis XAUUSD – November 26, 20251. Momentum Analysis
D1 (Daily)
Daily momentum is deeply inside the overbought zone, meaning the probability of a bearish reversal is very high—possibly today or tomorrow. This upcoming downward phase will align with the next downward cycle of D1 momentum.
H4
H4 momentum is currently rising. Therefore, price may:
• Continue with another upward push, or
• Move sideways to push H4 momentum into the overbought zone.
H1
H1 momentum is preparing to turn downward, suggesting that a short-term bearish move on H1 may appear very soon.
________________________________________
2. Wave Structure
D1
The overall D1 structure remains unchanged from the previous plan.
The only difference is that D1 momentum has pushed deeper into the overbought region, increasing the likelihood of a reversal either today or tomorrow.
H4
Price is forming a green ABC corrective structure, and it appears price is approaching the final stage of wave C (green).
With H4 momentum turning upward, price may still produce:
• One more small push upward, or
• A mild sideways upward drift to complete wave C.
H1
On H1, price is forming a 5-wave structure (1–2–3–4–5, black). This creates two possible interpretations:
Scenario 1 (Primary Expectation)
This 5-wave pattern represents wave C (green) inside the ABC correction of wave 2 (red).
→ Since wave C is always a 5-wave structure, this scenario is fully consistent with Elliott Wave rules and remains our main working count.
Scenario 2
The 5-wave structure is actually the beginning of a new trend, potentially forming wave 1 of a larger bullish cycle.
Although there isn’t enough evidence to support this scenario yet, the mere presence of a clean 5-wave structure means we must keep this possibility in mind.
________________________________________
3. Relationship Between D1 Momentum & Wave Structure
The previous downward and upward swings inside wave Y (purple) on D1 correspond almost perfectly with the downward and upward cycles of D1 momentum.
D1 is now overbought and preparing to turn down.
➡️ Therefore, the upcoming corrective decline is extremely important.
Case 1 – Price holds above 4021
If D1 momentum reaches oversold territory and turns upward without price breaking below 4021, then:
• The current 5-wave structure may represent wave 1,
• The upcoming decline will be wave 2,
• When D1 momentum turns upward → wave 2 finishes.
Case 2 – Price breaks below 4020
If D1 momentum reverses upward from oversold but price breaks below 4020:
• The current 5-wave structure is wave C (green),
• Price will extend downward to complete wave Y,
• Wave Y completes when D1 momentum turns upward again.
🎯 In both scenarios, the next key move is still a downward leg.
________________________________________
4. Wave C Target Levels
Yesterday, two targets were provided:
• 4158
• 4184 – 4193
Price already hit 4158, then reversed strongly, producing 300 pips profit.
We now expect the remaining target 4184 – 4193 to act as the primary sell zone.
________________________________________
5. Trading Plan
📍 Sell Zone: 4184 – 4185
• SL: 4205
• TP1: 4123
• TP2: 4081
• TP3: 4020


1H Technical Analysis (Momentum Weakening, Bearish Bias)1. Market Structure
Price recently completed a strong bullish rally but has since formed a deep corrective pullback.
The latest upswing shows weaker highs, smaller candles, and loss of momentum.
Current action is more consistent with a distribution / topping pattern than continuation.
Bias: Market is transitioning into a corrective or range-bound phase near the top.
2. RSI (14)
RSI rallied toward the 70 zone and then sharply rejected.
The RSI moving average (yellow line) is now sloping downward.
Current RSI sits around 50–55, indicating neutral momentum but with bearish pressure growing.
A clear bearish divergence is visible: price made a higher high while RSI made a lower high.
Signal: Momentum exhaustion on the upside.
3. MACD (12,26,9)
MACD line is crossing below the signal line.
Histogram bars are shrinking toward zero (momentum fading).
MACD peaks also show bearish divergence, confirming weakening bullish strength.
Signal: Shift from bullish momentum to bearish control.
4. Candles & Volume
Recent candles are small-bodied → loss of bullish urgency.
Volume failed to expand during the last rally → weak demand on the way up.
Signal: Buyers are no longer aggressive, and sellers are gaining an advantage.
🔻 Overall Conclusion
All three tools—RSI, MACD, and Price Action—deliver the same message:
A bearish correction is the most probable next move.
Momentum is weakening, divergences are confirmed, and price action has stalled below resistance.
📉 Preferred Trade Setup – SELL Bias
Sell Zone:
4120 – 4125
Stop Loss:
4145 – 4150
(Above the most recent minor swing high)
Take Profit Levels:
4075 – Conservative / first reaction zone
4035 – Main target with solid R:R
3990 – 4000 – Extended target if bearish momentum accelerates
Rationale:
This setup aligns with weakening momentum, divergence signals, and the emerging downward shift inside the structure.
📈 Alternative BUY Setup (Only if Conditions Trigger)
A long position becomes valid ONLY if:
Price retraces to 4075,
RSI bounces upward from the 40–45 zone,
MACD forms a fresh bullish crossover.
Until then, BUY setups are lower probability.
🔥 Final Outlook
SELL setups currently offer higher probability and cleaner structure
due to:
Bearish divergence
MACD crossover
Declining volume
Lower-quality highs
Price is more likely to seek liquidity below before any attempt at a bullish continuation.

Downmove for goldHi traders,
Last week gold made a bigger upmove then expected. This changed the pattern for me. I think the correction (orange wave 4) is a Triangle that rejected from the 38.2 fib level.
So next week we could see a downmove. If it's corrective, we could see the next impulsive upmove.
If the upmove is corrective it could come down for the last time.
Let's see what price does and react.
Trade idea: Wait for a correction down and a change in orderflow to bullish to trade longs.
This shared post is only my point of view on what could be the next move in this pair based on my technical analysis.
But I react and trade on what I see in the chart, not what I've predicted or expect.
Don't be emotional, just trade your plan!
Eduwave

Possible Reversal on Gold XAU USDAfter we reach a strong resistance 4220 ~ 4208, Probably by next week we might seen a Reversal for gold and this time we might see 4000 Range. I know many people are looking for bullish in Gold but I think it was again reach overbought area, will keep watch this by next week. I havent Traded yet but there is a big chance for a drop. Conservable Target for sell is 4126

Gold Continues Bullish Trend – Waiting for Pullback to BUY📊 Market Overview
Gold maintains a strong upward trend as:
• USD weakens and expectations rise that the Fed may adopt a softer tone in upcoming statements.
• Safe-haven demand increases amid financial market volatility.
• Large institutional buying continues to keep the price above the 4180 level.
________________________________________
📉 Technical Analysis
• Key Resistance: 4194 – 4200
• Stronger Resistance: 4212 – 4218
• Nearest Support: 4178 – 4182
• Stronger Support: 4162 – 4168
• EMA 09: Price is above EMA09 → dominant uptrend.
• Momentum & Candles: Buying pressure remains strong; quick price rallies after small pullbacks indicate buyers control the market.
________________________________________
📌 Outlook
Gold is likely to continue rising in the short term if the price holds above 4178–4182.
• Pullback to 4178–4182 → good BUY opportunity.
• Break above 4200 → target extends to 4212–4218.
• SELL should only be considered at strong resistance 4194–4200 and 4212–4218 with clear reversal signals.
________________________________________
💡 Suggested Trading Strategy
🔺 BUY XAU/USD: 4178 – 4182
🎯 TP: 40 / 80 / 200 pips
❌ SL: 4175
🔻 SELL XAU/USD: 4215 – 4218
🎯 TP: 40 / 80 / 200 pips
❌ SL: 4221

Double Top: The Pattern That Warns You Before the Crash📘 Mastering the Double Top Pattern: A Complete Educational Guide for Traders
The Double Top is one of the most powerful and reliable reversal patterns in technical analysis. When understood and applied correctly, it helps traders catch the early phase of a trend reversal — often leading to high-reward opportunities with strong risk control.
1 . Understanding the Structure of a Double Top
A Double Top consists of three essential components:
🔸 First Top
- Price pushes upward in a strong bullish trend.
- It forms a peak at a key resistance zone.
- Price then retraces downward → creating the neckline.
🔸 Second Top
Price rises again but fails to break above the first peak.
This failure indicates:
+ weakening bullish momentum
+ growing selling pressure
This is the first warning of a potential reversal.
🔸 Neckline Breakout (Confirmation)
- When price breaks below the neckline, the pattern is confirmed.
- This confirms that buyers have lost control and sellers have taken over.
- This is where professional traders begin to look for short opportunities.
2. What the Double Top Really Tells You (Market Psychology)
A Double Top is psychology in motion:
- Buyers attempt to break resistance twice
- The first attempt succeeds (forming Top 1)
- The second attempt fails (forming Top 2)
- This failure shows exhaustion
- Once the neckline breaks → confidence shifts to sellers
- A new downtrend is likely to start
This pattern is especially powerful after a strong uptrend, because a reversal has more room to move.
3. Requirements for a High-Quality Double Top
To filter out fake signals, look for:
✔️ A strong bullish trend before the pattern
✔️ Two tops of similar height
✔️ Second top usually forms with weaker volume
✔️ Clear and decisive neckline breakout
✔️ Retest of the neckline increases probability
This helps you avoid low-quality setups and false reversals.
4. How Professional Traders Trade the Double Top
1️⃣ Entry Strategy
- The safest and highest-probability entry: SELL on the neckline retest after the breakout.
Entering early (at the second top) is risky — no confirmation yet.
2️⃣ Stop Loss Placement
SL should be:
- above the second top or above the structure that failed
- This protects you from false breakouts and liquidity grabs.
3️⃣ Take Profit Strategy
To project your target:
- Measure the height from the top → neckline
- Project the same distance downward
- This becomes your TP zone
Simple, clear, and effective.
5. Pro Tips to Avoid Traps
⚠️ DO NOT enter just because price forms a second top
⚠️ Wait for the neckline break
⚠️ Watch for decisive bearish candles
⚠️ Combine with:
- RSI divergence
- Trendline breaks
- FVG imbalance
- Liquidity sweeps
These confluences dramatically increase your win rate.
🧠 Final Thoughts
The Double Top is a classic pattern for a reason — it reveals clear market psychology and provides precise entries when used correctly. Mastering it allows you to catch early reversals with confidence and discipline.
If this lesson helped you, let me know in the comments 🚀📉📘

Gold looking for longsI think the trendline will be broken , stops will be taken and then gold will start going down.
Let us see what next week is going to bring on.

XAUUSD – H1 uptrend channel, short-term downside risk increasingXAUUSD – H1 uptrend channel, short-term downside risk increasing Brian – Prioritize short selling at the channel peak, wait to buy back at lower support
I. Strategy Summary Gold is trading in an uptrend channel on H1, but the rise around 4.160 shows signs of weakening, increasing short-term correction risk.
Preferred Scenario: Short sell at the channel peak 4.162–4.164, targeting support areas 4.145 – 4.130 – 4.115 – 4.100.
After the correction, the 4.100–4.080 area may become the foundation for the next rise in the larger trend.
Important price areas to watch: 4.139 – 4.127 – 4.110 – 4.088.
II. Macro Context & News 27/11
02:00 – Fed releases Beige Book This document updates the Fed branches' assessment of the US economic situation.
Describing slower growth, cooling price pressures will further reinforce expectations that the Fed will soon cut interest rates → supporting gold.
Conversely, if the Beige Book describes the economy as still “resilient,” the market may temporarily slow down pricing in rate cuts → causing a short-term adjustment for gold.
19:30 – ECB releases October meeting minutes
If the minutes lean towards the scenario of keeping high interest rates longer, the EUR may be supported, indirectly affecting the USD and gold inflows.
However, the impact is usually not as strong as US data, mainly affecting the overall risk-on/risk-off sentiment.
General Context: Gold has surpassed 4.160 USD/oz as the market increasingly expects the Fed to cut interest rates as early as December, reducing the appeal of interest-bearing assets and increasing the allure of gold – a non-yielding asset. This creates a support foundation for the medium-term uptrend, but after a hot rise, technical adjustments on H1 are normal.
III. Technical Structure – H1 uptrend channel
The price is within the H1 uptrend channel, with rising peaks and troughs, but the upper area near 4.160 coincides with:
The upper boundary of the price channel. The “Sell POC” area on the chart – where liquidity and sell orders are concentrated.
Preferred scenario on the chart: The price may slightly rebound to the POC area 4.162–4.164, then be rejected and slide to the important support area around 4.110 before extending the adjustment down to 4.100–4.080.
The lower trendline of the uptrend channel also acts as a short-term buy area if a clear candle reaction appears.
Notable price areas on H1: Resistance: 4.162–4.164 (channel peak + POC). Intermediate support: 4.139 – 4.127 – 4.110. Deep support: 4.088 – 4.080 – 4.100 (area that may form the bottom for the next rise).
IV. Trading Plan 1. Preferred Scenario – Short sell at the channel peak Idea: Short sell when the price rebounds to the upper boundary of the H1 uptrend channel and POC 4.162–4.164, expecting a correction to support.
Sell: 4.162–4.164 SL: 4.168 TP targets: TP1: 4.145 TP2: 4.130 TP3: 4.115 TP4: 4.100
This is a counter-move order in the uptrend channel, only targeting a short-term correction, not a major trend reversal scenario.
2. Supplementary Scenario – Short buy at support trendline Idea: When the price hits the lower trendline of the H1 uptrend channel and a nice candle reaction appears, consider a short-term buy according to the channel, prioritizing areas:
4.139 – 4.127 – 4.110 – 4.088
Specific Entry/SL levels will depend on the actual price reaction at the trendline, but the general principle:
Buy close to the trendline,
SL placed below the immediate support area,
TP aimed at the middle of the channel or the nearest resistance.
V. Risk Management & Notes
Do not open new positions right before or at the time of the Beige Book and ECB minutes release, as volatility may suddenly increase, widening spreads.
The sell order at 4.162–4.164 is a short-term counter-trend order in the uptrend channel, requiring moderate volume and strict adherence to SL 4.168.
If the price clearly breaks and holds above the 4.170 area, the H1 correction scenario weakens – in that case, stay out, wait for a new structure instead of trying to maintain a sell view.

XAUUSD: Buy ideaBuy idea on XAUUSD as you can see on the chart if and only if we have the breakout with force the resistance line by the buyers.

Gold (XAUUSD): Possible buy setup in 30m timeframeGold (XAUUSD): Possible buy setup in 30m timeframe. Pass is clear, be strict to my tp and sl, otherwise you won't get any profit.
Cheers
