Gold Trade Set Up Nov 27 2025Overall i believe price action is still bullish but internally in the 15m we are making LL/LH and we got a lot of SSL plus daily FVG below that i believe will be targeted before continuing its bullish trend so i will be looking for internal 5m BSL to be swept followed by a bearish engulfing candle to target SSL
Trade ideas

GoldXAUUSD
- Change of Characteristics
- Completed " 1234 " Impulsive Waves
- Break of Structure
- Bullish Channel as an corrective pattern in Short Time Frame
- Order Block

XAUUSD Intraday Plan| Breakout Above 4142, Eyes on 4198 Next?Gold has finally broken above the 4142 resistance after a day of consolidation, showing renewed bullish strength. Price is now trading above both moving averages, with the MA50 crossing above the MA200.
If bullish momentum holds, we can expect a retest of 4198, and a clean break above that level would open the path toward 4232 next.
However, if price drops back below 4142, we may see a move back into the consolidation range. A confirmed break beneath that range would then open the door for a deeper pullback into the Support Zone.
📌Key levels to watch:
Resistance:
4198
4232
4274
Support:
4142
4098
4052
4016
3968
🔎Fundamental focus:
Today brings a cluster of important U.S. data releases — Unemployment Claims, Durable Goods Orders, and the Chicago PMI.

GOLD outcome.GOLD is pulling back in Asian session ans has been consolidating. Waiting for a climb going to London session.

GOLD Will Move Lower! Short!
Take a look at our analysis for GOLD.
Time Frame: 9h
Current Trend: Bearish
Sentiment: Overbought (based on 7-period RSI)
Forecast: Bearish
The price is testing a key resistance 4,126.79.
Taking into consideration the current market trend & overbought RSI, chances will be high to see a bearish movement to the downside at least to 4,038.14 level.
P.S
Please, note that an oversold/overbought condition can last for a long time, and therefore being oversold/overbought doesn't mean a price rally will come soon, or at all.
Like and subscribe and comment my ideas if you enjoy them!

XAU/USD | Gold Approaching Key Intraday Supply Zone! (READ)By analyzing the #Gold chart on the 4H timeframe, we can see that after dropping to 3998 dollars, price found strong demand and has now climbed back up to around 4050 dollars.
Keep an eye on the 4056–4064 zone for a potential SELL reaction, as this is a key supply area.
This analysis will be updated soon, and all important supply and demand zones are already marked on the chart.
Please support me with your likes and comments to motivate me to share more analysis with you and share your opinion about the possible trend of this chart with me !
Best Regards , Arman Shaban

XAUUSD – LANA'S VIEW ON ADJUSTMENT PHASE 02/12 ...XAUUSD – LANA'S VIEW ON ADJUSTMENT PHASE 02/12
1. Quick Update
Today, Lana views gold in the context of a short-term adjustment, mainly wave 4 according to Elliott, after a fairly strong previous increase.
The goal is to take advantage of the technical decline to: Short sell to a lower price range
Then buy back at a beautiful support area according to the main trend
2. Technical Analysis
The Liquidity zone 4250–4260 on the weekly frame is a very strong liquidity area according to Market Profile.
Lana sees this as an area prone to a “fake break”: price pushes up to take liquidity and then adjusts down.
Based on Session data, Lana prioritizes the scenario: Price is rejected around the above area
Forming a decline to the 418x area to complete wave 4 adjustment.
After wave 4 is completed, the medium-term uptrend can still continue.
3. Price Areas to Watch
Strong Liquidity / resistance area:
4250 – 4260
Short sell watch area:
4236 – 4241
Buy back area according to trend:
4180 – 4175
4. Trading Scenarios
⭐️ Scenario 1 – Sell according to adjustment phase
Sell: 4236 – 4241
SL: above 4245
Target: 418x (can gradually close around 4180)
⭐️ Scenario 2 – Buy according to trend after adjustment
Buy: 4180 – 4175
SL: 4170
TP: minimum 20 points (everyone can choose the nearest resistance area to gradually close)
Lana's priority: Do not rush to Buy right at the Liquidity area 4250–4260
Be patient and wait for the price to reach the 4236–4241 area to Sell,
then 4180–4175 to Buy according to the trend.
This is Lana's personal view on the adjustment phase on 02/12, everyone should consider carefully and manage risks before entering a trade. 💛

Golden Liquidity Sweep & FVG Reversal [XAU/USD]OANDA:XAUUSD Golden Liquidity Sweep & FVG Reversal
Signal: BUY
Entry: 4,203.560
TP1: 4,236.765
TP2: 4,259.639
TP3: 4,280.000
SL: 4,189.322
Insights:
Price swept liquidity below 4,203.560 (red level) and tapped into the 0.618–0.705 Fibonacci zone, aligning with a Fair Value Gap (FVG) and high-volume node on VRVP.
RSI is rebounding from midline (50), MACD histogram shows bullish momentum building, and price is above the 50-period MA.
Market structure shows BOS to the upside, suggesting bullish continuation after liquidity grab.
#FVGReversal #LiquiditySweep #GoldScalpingSetup#HighRR #SmartMoneyConcepts #BreakoutMomentum
🌟 Trade Like Hunter (for professional edge)
✅ High-Probability Setup: Confluence of FVG, BOS, VRVP support, RSI bounce, and MACD crossover
📊 Risk-Reward Ratio: Approx. 1:2.5 to TP2, 1:4 to TP3
🔑 Liquidity Zone Confirmation: Entry aligns with swept liquidity and imbalance zone
🧠 Market Psychology: Accumulation phase post-sweep, breakout momentum expected
⚡ Probability Score: 80% High Probability
📈 Scalability: Setup aligns across H1 and H4 timeframes for intraday and swing potential
🔒 Risk Disclaimer: Always use proper risk management. Past performance does not guarantee future results.

Dec 2, 2025 - XAUUSD GOLD Analysis and Potential Opportunity📊 Summary:
Above 4245, bullish momentum remains strong and the bias is to buy pullbacks into support.
If price breaks below 4220, bearish pressure increases and the bias shifts to selling rallies into resistance.
🔍 Key Levels to Watch:
• 4273–4278 – Resistance zone
• 4258 – Resistance
• 4245 – Resistance
• 4220 – Support
• 4211 – Intraday support
• 4205 – Support
• 4200 – Round-number support
• 4193 – Key support
• 4185 – Support
📈 Asia Session Intraday Strategy:
SELL: If price breaks below 4220 → target 4216, with further downside toward 4211, 4205, 4200
BUY: If price holds above 4221 → target 4227, with further upside toward 4232, 4236, 4240

XAUUSD (1H) – Rejection Zone Retest SetupOANDA:XAUUSD
A corrective phase is expected if price fails to sustain above the rejection zone. A retest of the new structural support around 4,209–4,210 remains the key reaction level. If bearish confirmation forms below the rejection line, downside continuation becomes valid.
Key Scenarios
❌ Bearish Case (Primary Setup) 📉
If price rejects the 4,241 rejection zone and forms confirmation:
→ 🎯 Target: 4,147
Further continuation possible if breakdown momentum continues.
✅ Bullish Case 🚀 (Invalidation Flip)
A clean break and candle close above 4,241 with retest holding may shift momentum back toward recent highs.
Current Levels to Watch
Resistance 🔴:
4,241 (zone of rejection)
Support 🟢:
4,209 (entry interest zone)
4,147 (target support)
⚠️ Disclaimer: This analysis is for educational purposes only — not financial advice.

Gold Price Movement: Buy on DipsGold Price Movement: Buy on Dips
As shown in Figure 2h
Current Gold Trading Strategy: Buy on Dips
Buy Price Range: 4245-4255
Stop Loss Range: 4225-4230
First Target Price: 4280-4300
Given the normal breakout and upward consolidation in gold prices,
we naturally choose the most conservative trading strategy: buy on dips.
We need to guard against potential unexpected situations.
Therefore, we set the stop loss in the first defensive zone: 4225-4230.
Next, we set the target price range at 4280-4300-4335.

BUYING GOLD NOW TO 4,256!!!!!Gold made a sharp breakouts off the POC level and run liquidity from the buy side am in on buys holding till price arrives 4,256 area......

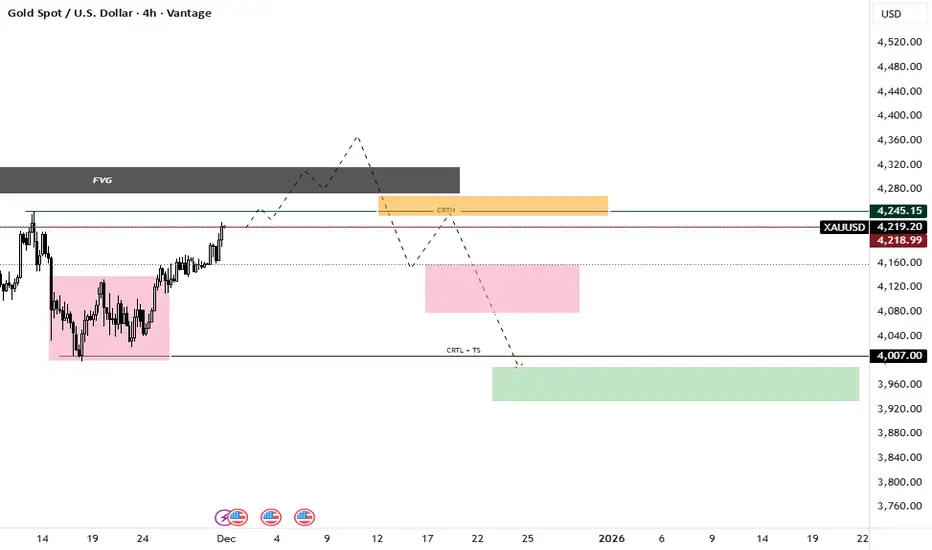
XAUUSD: Decoding the Smart Money Sell Model (MMSM) with CRTThe Narrative: Order in the Chaos Many see this chart as random noise, but through the lens of Candle Range Theory (CRT), we are witnessing a structured institutional narrative. We are currently tracking a classic Market Maker Sell Model (MMSM), where price is engineered to trap retail traders before the true delivery unfolds.
Technical Breakdown:
The Trap (Manipulation Phase): The current price action suggests we are in the manipulation phase. Price is drawing up into the FVG (Fair Value Gap) and the CRTH (Candle Range Theory High). This area acts as a magnet to induce early buyers and purge stops resting above recent highs. This is the "Purge" phase of the CRT cycle.
The Structure (MMSM): As seen in the Smart Money Sell Model, we are looking for the "Smart Money Reversal" (SMR) at these premium levels. We are waiting for price to purge the liquidity at the CRTH, mitigate, and then shift structure to the downside.
The Draw on Liquidity (DOL): Price moves because of liquidity, not just fundamentals. The ultimate target for this setup is the CRTL (Candle Range Theory Low) marked as TS (Turtle Soup). This represents the Sell-Side Liquidity (SSL) that Smart Money intends to harvest during the Expansion phase.
The Execution Plan:
We are not chasing the green candles; we are waiting for the story to complete.
Watch for the Purge: A sweep of the CRTH/FVG area.
Await Confirmation: A "Thick Candle" break or a closure back below Equilibrium (EQ) to confirm the manipulation is over.
Target: The expansion down to the CRTL + TS level.
“The market exists to transfer wealth from the impatient to the patient.”
Disclaimer: This analysis is based on Candle Range Theory and Smart Money Concepts for educational purposes. Always manage your risk.
Greetings,
MrYounity
Key-Resistance Liquidity Grab → FVG ShortIdea:
Price has reached a key resistance zone — a common place where smart money or institutions may hunt liquidity (stop-losses above resistance before reversing).
There is an unfilled Fair Value Gap (FVG) / imbalance zone drawn below (green “POI / FVG” zone). In price-action trading, these FVGs often act like magnets: after a rapid move, price tends to retrace and “fill” the gap.
The plan: wait for a rejection at resistance (signaling liquidity grab is done), then short — target the FVG/POI zone where the market may come back to fill imbalance.
🎯 Trade Plan (Entry / Exit / Risk-Reward)
Parameter Plan
Entry After a bearish rejection (e.g. long upper-wick candle) near the resistance zone.
Stop-Loss Slightly above the resistance / recent swing high (to avoid being stopped by a false breakout).
Take-Profit (TP) Around / within the FVG / POI zone (green zone on chart) — where imbalance may be filled.
Risk–Reward Aim for at least 1 : 2 — ideally more, depending on how far the FVG is below resistance.
⚠️ What Makes This Setup Valid (and What to Watch)
FVGs mark market inefficiencies / liquidity gaps created by rapid moves, which often get revisited.
A reversal or rejection at a well-defined resistance zone gives signal that the liquidity hunt may be done and a move downward may begin.
But — if price breaks cleanly and strongly above the resistance (with momentum), the short trade becomes invalid.
Also, FVGs don’t always get filled. Entry should ideally wait for a clear rejection or confirmation, not just assume a fill.

Long-Term Gold Projection Using the Yearly TimeframeIn my view, gold is setting up for a meaningful correction on the higher timeframes. After an extended bullish run, the structure suggests we could see price retrace deeper and potentially sweep this year’s low near the 2600 region. A liquidity grab below that level would align with a healthy long-term reset before the next major move. While the macro trend remains intact, I expect this corrective phase to play out before gold resumes its broader upward trajectory.

Gold Weekly Review and Outlook: Gold Breaks Through Key ResistanGold Weekly Review and Outlook: Gold Breaks Through Key Resistance, Focus on Next Week's Data Frenzy
Market Review This Week: On Friday, spot gold closed strongly up 1.48% at $4,219.29 per ounce, reaching a high of $4,226.83 per ounce during the session, a near two-week high. It rose 3.80% ($154.39) this week, and 5.42% ($216.81) for November, marking its fourth consecutive month of gains. Spot silver performed even better, surging 5.56% to close at $56.35 per ounce, hitting a new all-time high of $56.519 per ounce during the session, with a weekly gain of 12.72%, its best weekly performance since 2020.
Driven Factors Analysis:
Supply Chain Tightening and Inventory Decline: Tightening physical silver supply and a continued decline in inventory drove prices up rapidly.
Fed Rate Cut Expectations Rise: Market expectations for a December rate cut have surged, and the low-interest-rate environment naturally benefits gold, a non-interest-bearing asset.
Safe-Haven Demand and Structural Demand: Concerns about debt expansion, continued central bank gold purchases, and inflows into the crypto sector are all supporting precious metal prices.
Technical Analysis and Next Week's Outlook
Gold Technical Structure
Daily Chart: Price broke out of the previous consolidation range. The moving average system (MA5-MA20) is in a bullish alignment, the Bollinger Bands are widening upwards, and the MACD golden cross structure is intact, indicating a solid medium-term upward trend. Key support is located at the intersection of the MA20 and the Bollinger Band middle line (4155-4165 area).
Hourly Chart: Price is moving along an upward channel, repeatedly testing the lower edge of the channel before rebounding quickly, showing a clear top-to-bottom reversal pattern. Short-term technical correction is possible, but overall momentum is bullish.
Key Levels Recommended:
Resistance Range: $4245-$4250
Support Range: $4155-$4165
Trading Strategy:
Buy on Dips: Enter long positions in batches around the $4170-$4175 range, with a stop-loss at $4160 and a target of $4200-$4220. A break above this level could lead to $4245.
Sell on Dips: Consider shorting with a small position around the $4240-$4245 range, with a stop-loss at $4253 and a target of $4215-$4195.
Risk Warning: This week is packed with data releases and may trigger high volatility. Strict position control and stop-loss orders are essential to avoid holding losing positions.
Next Week's Focus: Global Data Flood and Policy Signals
Next week (December 2-6) will see the release of several key economic data points, with the most anticipated being the US September PCE Price Index (to be released next Friday). As the Federal Reserve's preferred inflation indicator, its performance will directly impact expectations for the December interest rate meeting. The market expects core PCE to remain flat at 2.9% year-on-year. Better-than-expected data could reinforce the "higher and longer" interest rate stance; lower-than-expected data could trigger expectations of rate cuts.
Other important data includes:
Monday: US/Canada Manufacturing PMI, US ISM Manufacturing PMI
Wednesday: US ADP Employment, Industrial Production, ISM Non-Manufacturing PMI
Friday: Japanese Household Spending, German Industrial Orders, Eurozone GDP, Canadian Employment Report, US Factory Orders, and University of Michigan Consumer Sentiment Index
Macroeconomic Impact: The dense release of data may exacerbate volatility in the foreign exchange and precious metals markets. The direction of the US dollar will be a key indicator of short-term momentum for gold.
Position Recovery Strategies
Handling Deeply Lost Positions:
If your positions are deeply lost (e.g., short positions against the trend), you need to assess whether the trend might reverse. In a clearly trending market, it is recommended to decisively reduce positions or exit the market to avoid long-term capital occupation and risk accumulation. After freeing up funds, you can reposition based on the trend and gradually recover losses through trend-following trading.
Handling Small Losses:
If your losses are relatively small (e.g., just below your stop-loss point), you can use technical analysis to look for rebounds or pullbacks to reduce your position. In volatile markets, range trading can lower your average cost and even turn a loss into a profit.
Correcting Systemic Issues:
If you are repeatedly trapped in losses, it indicates a flaw in your trading system. We recommend improving the following:
Strictly set stop-loss orders and avoid holding onto losing positions;
Strengthen your ability to analyze both fundamental and technical factors;
Control your position size and avoid excessive leverage.
If you are unable to handle the situation yourself, please visit our homepage for further discussion.
Summary: Gold broke through the key resistance level of $4200, and silver reached a new all-time high, indicating that the precious metals market may have ended its consolidation and resumed its upward trend. Next week is packed with data, especially the PCE inflation data, which will be a crucial variable in determining the Fed's policy expectations and the direction of the US dollar. Trading should focus on trend-following long positions, with strict risk control, and seizing structural opportunities.

GOLD IS OVERBOUGHT|SHORT|
✅XAUUSD After sweeping liquidity above the supply zone, price is about to retest the rejection point in a premium area. A draw on liquidity toward the next inefficiency is favored as the market seeks a balanced repricing leg. Time Frame: 3H.
SHORT🔥
✅Like and subscribe to never miss a new idea!✅

Gold Trade Plan 28/11/2025Dear traders,
“Considering the holidays on the Forex calendar, I don’t expect heavy volatility from gold. The 4135–4200 zone will be gold’s range area.”
Regards,
Alireza!

Nov 27, 2025 - XAUUSD GOLD Analysis and Potential Opportunity📊 Summary:
Price has broken out of the previous consolidation zone, and bullish momentum remains strong.
Today, the key levels to watch are 4175 on the upside and 4158 on the downside.
If price breaks and holds above 4175, bulls maintain control → bias shifts to buying pullbacks into support.
If price breaks below 4158, bearish pressure increases → bias shifts to selling rallies into resistance.
Today’s trading difficulty may be similar to a typical Friday session — stay cautious and follow the trend instead of fighting it.
🔍 Key Levels to Watch:
• 4200 – Resistance
• 4193 – Resistance
• 4184 – Resistance
• 4170–4174 – Key resistance zone
• 4158 – Important intraday support
• 4151 – Support
• 4142 – Support
• 4130–4133 – Support
📈 Intraday Strategy:
SELL: If price breaks below 4158 → target 4154, with further downside toward 4150, 4142, 4137
BUY: If price holds above 4175 → target 4180, with further upside toward 4184, 4187, 4193

Gold Trade Secured 150 PipsPrice swept SSL but was still bullish overall so i waited for a CISD and 15m engulfing bullish candle to target BSL

ANFIBO XAUUSD – Elliott Wave Pullback or Continuation? [11.26]Gold XAUUSD – Elliott Wave Pullback or Continuation?
Hi guys, Anfibo’s here!
XAUUSD Short-Term Trading Plan
Overall Picture
On H1, gold is still trading inside a rising channel, but price has just completed a potential 5-wave impulsive leg into the upper boundary of the structure. From here, we’ve got short-term bearish confirmation around the 4147 area, suggesting that price may be entering an ABC corrective phase within the channel.
In other words:
Bigger picture: structure remains bullish as long as the channel holds.
Short term: I’m prepared for a corrective drop before the next directional leg.
On the macro side, fresh data show the U.S. is burning around 22B USD per day, with October spending at 688.7B vs 404B in tax revenue. The first month of fiscal year 2026 already printed a record 284.4B deficit, and interest payments alone reached 1.24T over the last 12 months – about 24 cents of every tax dollar going just to service debt.
This kind of fiscal pressure is structurally supportive for gold in the long run, but it doesn’t prevent short-term pullbacks inside the current channel.
Trading Plan – Playing the ABC Correction
I’m focusing on two key zones derived from the Elliott structure:
one for tactical sells from premium prices, and one for buys at the end of the correction.
>>> Scenario #1 – Tactical SELL from the Upper Zone (Short-Term Bearish)
If price retests the short-term bearish confirmation area and fills the upper liquidity zone, I’ll look for sell setups:
Sell entry: 4150 – 4152
Stop loss: 4158
Take profit levels: 4140 – 4133 – 4110 – 4088
Idea: fade the final push into the upper boundary / FVG area, targeting completion of wave A–B–C towards the mid and lower parts of the channel. This is a short-term play against the local high, not a long-term bearish view on gold.
>>> Scenario #2 – BUY the End of Wave C (Continuation with Trend)
If the ABC correction extends into the lower part of the short-term structure and shows bullish reaction, I’ll switch to a buy-the-dip plan:
Buy entry: 4130 – 4133
Stop loss: 4125
Take profit: 4145 – 4160
Idea: buy near the potential end of wave C, in confluence with channel support, for a continuation back toward the upper boundary and possibly a new impulsive leg.
Risk Management
Trade only when price respects one of the planned zones – no chasing in the middle of the range.
Always wait for clear confirmation (rejection wick, market structure shift, or strong reaction) before entering.
Keep risk per trade controlled and aim for Risk:Reward ≥ 1:2.
Do not hold both scenarios in opposite directions at the same time – choose the plan that the market confirms.
If price invalidates the structure (strong break beyond SL without reaction), step aside and reassess the wave count.
Conclusion
Gold is likely moving into an Elliott ABC correction phase inside a still-bullish channel. That gives us room for a tactical short from premium levels and a high-probability dip buy if price completes wave C lower. With macro debt and deficit pressures quietly supporting the long-term bullish case, this week is all about executing clean setups inside structure, not forcing trades.
STAY PATIENT, FOLLOW YOUR PLAN, AND TRADE WITH DISCIPLINE, GUYS! 💛📈

Gold H1 TIME FRAME CHART ANALYSIS Gold H1 time frame chart analysis 🚀
I'm going to BUY now 👀
Take profit 4210
Stop trade 4100
What do you think Guys?

Gold Attempts to Hold Above $4,000 per OunceOver the past five trading sessions, XAU/USD has maintained a gain of more than 1.4%, as the precious metal has temporarily regained confidence following a more moderate tone from the Federal Reserve regarding interest rates. The U.S. bond market has not seen significant increases in yields in recent sessions, which has allowed gold—often viewed as a natural substitute for bonds—to recover some short-term demand. If the price manages to hold above the $4,000 zone, buying pressure could once again become dominant in the coming sessions.
Uptrend Remains Intact
Since late August, gold has maintained a solid upward trendline, and despite recent pullbacks, the bullish bias continues to prevail in the short term. There is still no meaningful selling pressure capable of breaking this trendline, making it the key technical structure to monitor in the coming sessions, especially if the price stays above the 50-period moving average.
RSI
The RSI line continues to oscillate around the 50 level, indicating the emergence of a neutral bias and reflecting balanced momentum across the last 14 sessions. As long as this pattern continues, indecision is likely to remain present in gold’s short-term price behavior.
MACD
The MACD histogram is also oscillating around the neutral zero line, reinforcing a scenario of technical neutrality in the short-term moving averages. If this continues, a short-term consolidation range could begin to take shape.
Key Levels to Watch
$4,300 – Major Resistance: This level corresponds to the chart’s highs. A move back toward this zone could reactivate a strong bullish bias and reinforce the current upward trend, allowing buying pressure to regain dominance.
$4,140 – Immediate Barrier: This level aligns with recent retracements and the 23.6% Fibonacci level. If the price continues oscillating around this zone, a short-term range may form due to the recent lack of directional strength.
$3,920 – Key Support: The most relevant short-term support, located just below the 50-period moving average and the 38.2% Fibonacci level. A breakdown below this zone could endanger the current uptrend and give way to a more dominant bearish bias.
Written by Julian Pineda, CFA, CMT – Market Analyst
