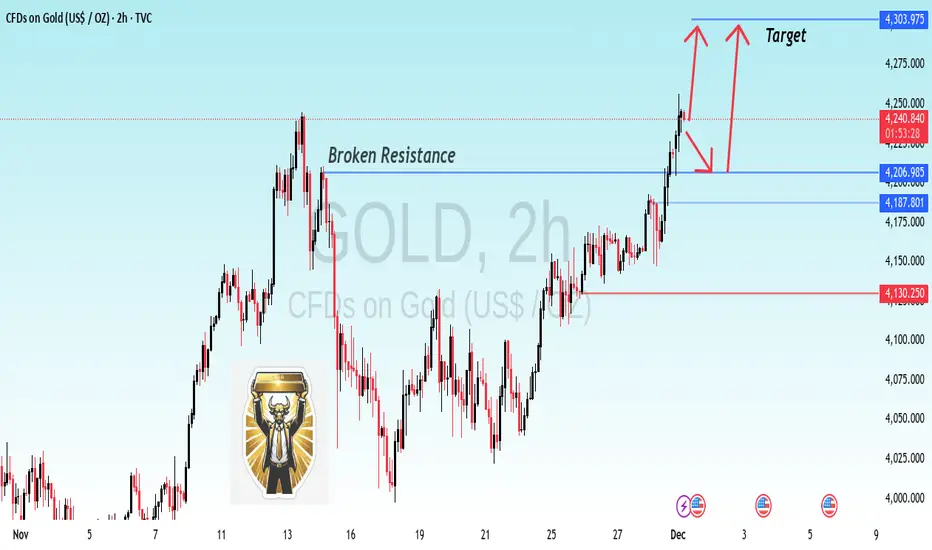
GOLD Breakout Confirmation Bulls trakin ControlUPDATE: Previous GOLD Idea Hit 100% Exactly as Expected! | JT_CHARTsMaster
The last analysis played out perfectly — GOLD followed the exact structure, respected the levels, and completed the move with full accuracy.
Thank you to everyone who supported the previous idea!
---
📌 Current Analysis (2H Timeframe)
Gold has broken the key resistance zone, and price is now retesting the breakout area.
After this clean retest, the market is showing signs of bullish continuation.
Key Points:
✔ Previous resistance now acting as support
✔ Break–retest–continuation structure is active
✔ Market is holding above the breakout zone
✔ Bullish momentum is building toward the next targets
---
📈 Expected Move
As long as gold stays above the breakout level, the probability of a move toward the next targets remains strong.
I’ve highlighted the expected upward move on the chart with arrows for clarity.
---
🙏 Thanks for Your Support
Your boosts, comments, and likes motivate me to share more accurate analyses like this.
👉 If you found this helpful, please Boost the idea and leave a comment — it really helps!
— JT_CHARTsMaster
Trade ideas
OUTLOOK XAUUSD 15m Analysis (2nd December 2025)Hello Guys, This is just a trade idea and not a financial advise
BUY/SELL SCENARIOS:
BUYS:
1)Body Candle Close above the 4236.02 level.
2) Retest the 15m Bullish CHOCH at the 4236.02 level.
3) Create a 3/5m Bullish Engulfing Candle to capitalize on BUYS towards the 4264.50 level.
SELLS:
1) Body candle close below the 4219.69 level.
2) Retest the 15m Bearish CHOCH at the 4219.69 level.
3) Create a 3/5m Bearish Engulfing Candle to capitalize on SELLS towards the 4185.50 level.
Trade smart, Trade according to your trading plans always!!

Gold Bulls Awaken- XAU/USD Testing Breakout at November HighsGold broke above the median-line last week with XAU/USD now testing resistance at the October reversal close at 4252- looking for possible inflection off this zone in the days ahead. A topside breach / close above would validate a breakout of the November range with subsequent resistance objectives eyed at the record high / high-day close (HDC) at 4356/82 and the 1.618% extension of the January advance at 4553.
Support now rests with the November HDC at 4172- a break / close below this threshold would suggest this latest rally may have been a false breakout with subsequent support seen at the November open at 4002. Broader bullish invalidation now rests with the 50% retracement of the August advance at 3847.
Bottom line: Gold is testing resistance into the monthly / weekly open, and the focus is on possible inflection off this level. From at trading standpoint, losses should be limited to 4172 IF price is heading higher on this stretch with a close above 4252 needed to fuel the next leg of the advance.
-MB

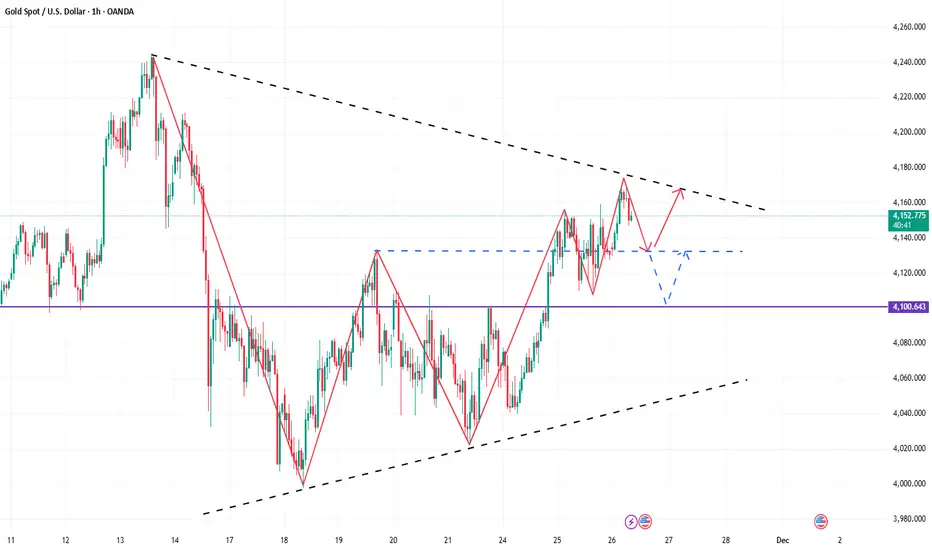
Be ready for a new rallyAs we can see in Daily timeframe market had already done a breakout for major resistance zone and is getting ready for new high.4151-4155 and 4160-4168 are key levels and if any daily candle close below 4140 then it will pause the rally and enter into consolidation but if any daily candle close above 4250 then consider for a new rally till 5370 atleast.


Momentum Builds Amid Key Imbalance LevelsThe gold market maintains a decisive tone, with 4078 standing out as a key imbalance level yet to be resolved. Price action is positioning itself to respond, suggesting that a potential move is imminent as liquidity inefficiencies remain open. follow for more insights , comment and boost idea

Analysis of key technical levels and trading strategies for goldGold traded in a range-bound pattern during yesterday's European and American sessions, closing with a bearish doji candlestick on the daily chart. This indirectly indicates the continued struggle between bulls and bears in the short term. Without a sustained upward trend, the range-bound trading is likely a way to digest excess energy from both sides. After opening higher, it reached a high of around 4169. Continuing from yesterday, the downward channel formed by the previous historical high will likely shift slightly lower to around 4170-4180. This level is crucial for the future direction of the market. A break above this level could potentially push the price up to 4200. Conversely, if this level holds, it would suggest that the current rise is not driven by bulls but rather a prelude and correction by bears to prepare for a potential further decline. The current support level is around 4110-4100, and the intraday price action will be particularly important. If gold breaks through the resistance level today, the bullish momentum will continue. Conversely, the bearish correction may also come to an end. If gold rebounds to around 4165-4180 today, consider shorting with a target of around 4150-4130.
XAUUSD – Possible Wave 4 Triangle Before the Final Push (Wave 5)Gold is currently showing signs of developing a contracting Wave 4 triangle, which aligns well with the broader Elliott Wave structure.
After completing Wave (3), price appears to be carving out an A–B–C–D–E formation inside a narrowing channel. Each leg is respecting the internal triangle boundaries, suggesting that bulls are consolidating before the next impulsive leg.
🔍 What I’m Watching
Wave (A) and Wave (C) have already printed, with strong reactions at the lower channel line.
Wave (B) and Wave (D) are forming lower highs inside the internal corrective structure.
Price remains supported by the major ascending channel, keeping the uptrend intact.
A clean Wave (E) touch on the lower triangle boundary would complete the pattern.
🟦 Bullish Scenario
If Wave (E) completes successfully on support and we break above the internal triangle resistance, this can trigger Wave (5), targeting the upper boundary of the long-term channel.
🔻 Bearish Risk
Invalidation occurs if price breaks below the ascending channel support, which would negate the triangle structure and open the door to deeper retracement levels.
📈 Conclusion
The structure favors consolidation before continuation. As long as the ascending channel holds, the bias remains bullish with anticipation of Wave (5) after triangle completion.

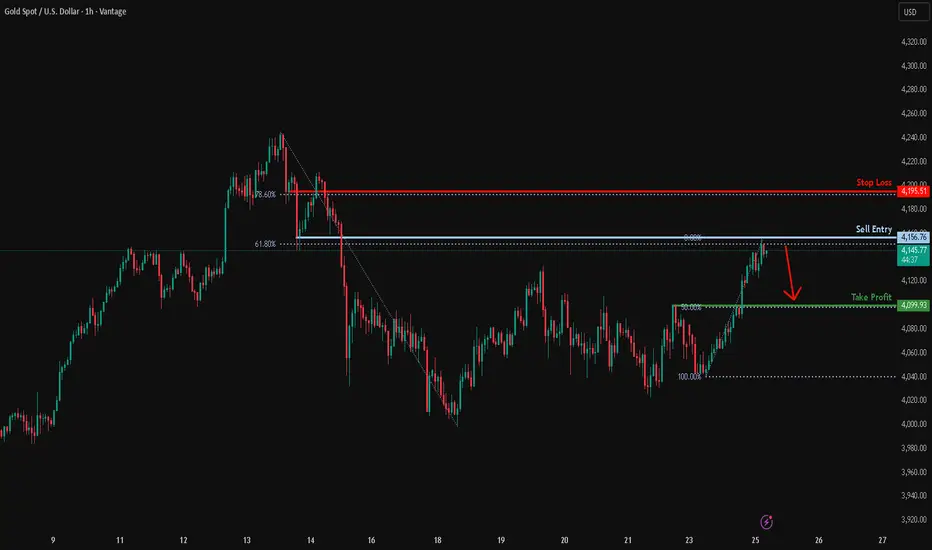
Could we see a reversal from here?XAU/USD has reacted off the resistance level which is a pullback resistance that aligns with the 61.8% Fibonacci retracement and could reverse from this level to our take profit.
Entry: 4,156.76
Why we like it:
There is a pullback resistance that aligns with the 61.8% Fibonacci retracement.
Stop loss:4,195.51
Why we like it:
There is a pullback resistance level that aligns with the78.6% Fibonacci retracement.
Take profit: 4,099.93
Why we like it:
There is a pullback support that aligns with the 50% Fibonacci retracement.
Enjoying your TradingView experience? Review us!
Please be advised that the information presented on TradingView is provided to Vantage (‘Vantage Global Limited’, ‘we’) by a third-party provider (‘Everest Fortune Group’). Please be reminded that you are solely responsible for the trading decisions on your account. There is a very high degree of risk involved in trading. Any information and/or content is intended entirely for research, educational and informational purposes only and does not constitute investment or consultation advice or investment strategy. The information is not tailored to the investment needs of any specific person and therefore does not involve a consideration of any of the investment objectives, financial situation or needs of any viewer that may receive it. Kindly also note that past performance is not a reliable indicator of future results. Actual results may differ materially from those anticipated in forward-looking or past performance statements. We assume no liability as to the accuracy or completeness of any of the information and/or content provided herein and the Company cannot be held responsible for any omission, mistake nor for any loss or damage including without limitation to any loss of profit which may arise from reliance on any information supplied by Everest Fortune Group.
Gold 4h Update – Elliott Wave ViewGold is still working its way through the larger Wave 4 correction that began after the strong third wave top. Nothing here suggests the trend has shifted. This entire structure continues to unfold as a complex W–X–Y.
The first leg down gave us the W. Price then pushed higher into that clean three-wave X connector. Now we’re building out the final Y leg, and the subdivisions fit well. The recent bounce looks like the B wave of Y rather than the start of anything impulsive. The move is corrective, it’s overlapping, and it hasn’t broken any key levels.
The main level to keep an eye on is the short-term B high around 4155. If price rejects under that, the C wave of Y should carry us lower toward the 3770 area where the fibs and prior structure line up. That would complete Wave 4 and reset the chart for a fresh Wave 5 advance.
Until that C leg finishes, Gold remains in consolidation territory. The bigger trend is still bullish. This is just the market clearing the runway before the next push.

4284.50 Sell Limit XAUUSDSafe Place For Sell on Xauusd is 4284.50 with 30/40 pip Sl And 60/80 pip Tp
Waite For Result/update

Gold next move (gold looks fragile)(24-11-2025)Go through the analysis carefully and do trade accordingly.
Anup 'BIAS for the day (24-11-2025)
Current price- 4075
"if Price stays below 4095, then next target is 4065, 4050 and 4025 and and above that 4100, 4115 ".
-POSSIBILITY-1
Wait (as geopolitical situation are worsening )
-POSSIBILITY-2
Wait (as geopolitical situation are worsening)
Best of luck
Never risk more than 1% of principal to follow any position.
Support us by liking and sharing the post.

GOLD 1H CHART ROUTE MAP UPDATE & TRADING PLAN FOR THE WEEKHey Everyone,
Please see our updated 1h chart levels and targets for the coming week.
We are seeing price play between two weighted levels with a gap above at 4114 and a gap below at 4057. We will need to see ema5 cross and lock on either weighted level to determine the next range.
We will see levels tested side by side until one of the weighted levels break and lock to confirm direction for the next range.
We will keep the above in mind when taking buys from dips. Our updated levels and weighted levels will allow us to track the movement down and then catch bounces up.
We will continue to buy dips using our support levels taking 20 to 40 pips. As stated before each of our level structures give 20 to 40 pip bounces, which is enough for a nice entry and exit. If you back test the levels we shared every week for the past 24 months, you can see how effectively they were used to trade with or against short/mid term swings and trends.
The swing range give bigger bounces then our weighted levels that's the difference between weighted levels and swing ranges.
BULLISH TARGET
4114
EMA5 CROSS AND LOCK ABOVE 4114 WILL OPEN THE FOLLOWING BULLISH TARGETS
4175
EMA5 CROSS AND LOCK ABOVE 4175 WILL OPEN THE FOLLOWING BULLISH TARGET
4232
EMA5 CROSS AND LOCK ABOVE 4232 WILL OPEN THE FOLLOWING BULLISH TARGET
4289
EMA5 CROSS AND LOCK ABOVE 4289 WILL OPEN THE FOLLOWING BULLISH TARGET
4361
BEARISH TARGETS
4057
EMA5 CROSS AND LOCK BELOW 4057 WILL OPEN THE FOLLOWING BEARISH TARGET
4006
EMA5 CROSS AND LOCK BELOW 4006 WILL OPEN THE FOLLOWING BEARISH TARGET
3965
EMA5 CROSS AND LOCK BELOW 3965 WILL OPEN THE SWING RANGE
3923
3861
As always, we will keep you all updated with regular updates throughout the week and how we manage the active ideas and setups. Thank you all for your likes, comments and follows, we really appreciate it!
Mr Gold
GoldViewFX

1. Gold Correction Completed Bullish Move AheadBased on the previous analysis, we were expecting a price correction. Gold reacted perfectly and the correction provided a profitable move for us.
Now, we are anticipating a bullish movement.

Key Levels & Bullish Bias – Intraday XAUUSD Outlook for Nov 26Gold Market Analysis – M30 Intraday Outlook
- Gold continues to push higher on the M30 timeframe, maintaining a strong bullish structure after the previous breakout.
- Current price is around 4155–4160, showing clear buyer strength and healthy continuation behavior.
- From a structural perspective, the market continues to print higher highs and higher lows, confirming that bullish momentum is still dominant.
- As long as gold remains above the 4128 pivot zone, the probability favors further upside expansion toward the next liquidity targets.
Key Levels
- Pivot Level: 4128
- Resistance / Target Zone: 4185 – 4210
- Support: 4109
- Extended Support: 4083
Trading Recommendations
✅ Primary Strategy – BUY Bias
Buy above 4128
Target 1: 4185
Target 2: 4210
As long as price holds above 4128, bullish continuation remains the most likely scenario.
🔁 Alternative Scenario
If price breaks and sustains below 4128:
Target 1: 4109
Target 2: 4083
This signals a deeper pullback into previous demand zones before any continuation attempt.
Technical Insight
- RSI remains in bullish territory, supporting further upside momentum.
- Market structure is clean and bullish, with no confirmed reversal patterns at this stage.
What are your thoughts on GOLD? Comment now or join my group to trade with me on description

BULLISH MOMENTUM ACCELERATES AS DECEMBER RATE-CUT ODDS RISEGold is currently trading around 4140, showing steady bullish momentum as markets increasingly price in a December rate cut. The shift in interest-rate expectations has boosted demand for non-yielding safe-haven assets, and gold is reacting accordingly with firm bidding near key technical levels.
Technical Overview
Support
Key Support: 4109
This zone has been holding well, confirming buyer strength on every dip. As long as price remains above 4109, the short-term structure remains intact and favors continued upside.
First Resistance: 4159
Price is already testing this zone. A clean breakout and candle close above 4159 would open the door for higher targets.
Second Resistance: 4200
This is the next major hurdle. A sustained move above this psychological and technical barrier would indicate strong bullish continuation.
Upside Target
Primary Target: 4220
If gold breaks above 4200 with volume and maintains momentum supported by macro fundamentals, a push toward 4220 is highly probable.
Fundamental Overview
Growing expectations of a Fed rate cut in December are providing strong tailwinds for gold. Lower interest rates reduce the opportunity cost of holding gold, while also putting downward pressure on the dollar—both factors that typically support higher gold prices.
Investor sentiment has turned decisively bullish as they reposition into safe-haven assets amid evolving macro conditions. The combination of softening yields, rate-cut bets, and continued geopolitical uncertainty is strengthening the overall bullish bias.

Bullish Scenario After Trendline BreakHello my trader friends,
I’m here with a short-term analysis on gold. Based on the chart, after the trendline break, I expect a bullish move. We’ll wait to see a strong result.
Stay tuned for more updates and analyses!

XAUUSD Delivered Excellent profits yesterday [890 pips]Yesterday & day after yesterday i gave 2 sell setups on mine in Early EU session and 2nd on N.Y session.
As I mentioned in today’s yesterday session:
• I took sell trades around 4145 & 4150 area
My TP was 4120 & 4110, Both Targets went successfull.
I’m very happy with the profits so far – .
My medium-term target 4090 is still pending,
Thanks to those who followed, trusted me, and made profits.

Gold (XAUUSD) – Don’t Get Trapped: Sell High, Buy LowGold (XAUUSD) – Structural Outlook
Price action continues to develop within a corrective framework, forming a potential A–B–C structure following the recent impulsive advance. The market is approaching a key resistance zone aligned with the 0.786 retracement , where liquidity above the internal swing high may be targeted before a broader downside continuation toward the $3,880–$3,790 demand region. A confirmed sweep and rejection from the upper boundary would strengthen the case for the final leg of the correction, completing wave (C) before a higher-time-frame bullish continuation resumes.
⚠️ Disclaimer
This analysis is provided for educational purposes only and does not constitute financial advice. Trading financial markets involves risk, and you are solely responsible for your own investment decisions. Always conduct your own research and use proper risk management.
If you found this analysis valuable, leave a like, drop your thoughts in the comments, and follow for more structured market insights.

XAUUSD LONG 28/11Greetings,
Hello traders, this is the XAU-USD 15m important support zone.
Based on market trend and previous day movement.(white line)
Key levels;
Entry: 4163.21
Target: 4173.21
Stop loss: 4153.21
Risk Reward Ratio 1:1
Your likes and boosts motivate us to keep learning and sharing ideas!

“BOS Confirmed — Demand Retest for Next Bullish Leg🟡 GOLD (XAU/USD) – Bullish Continuation Setup from High Probability Demand Zone 🆙
🔍 Chart Breakdown & Key Insights
Price created a Break of Structure (BOS) to the upside → confirming bullish momentum ✔️
Retested the Demand Line + Support Zone → buyers defending strongly 💪
High Probability POI (previous accumulation zone) remains valid with liquidity swept below → smart money accumulation evidence 💰
Current pullback = healthy retracement into demand before potential continuation
🎯 Targets (With stickers)
🎯 Target Zone Price Region Sticker
TP1 → Retest recent high 4,165 – 4,175 🎯
TP2 → Liquidity above highs / extended target 4,180 – 4,195 🚀💸
TP1 hit possibility is HIGH due to bullish structure 📈
TP2 depends on strength of breakout ⬆️
📌 Trade Idea (High Probability Setup)
🟩 Buy Entry Zone:
➤ 4,120 – 4,130 (pullback entry at support)
🟢 Take-Profit:
➤ TP1: 4,170 – TP2: 4,190
📊 Risk-Reward Ratio: 1:2.5 – 1:3+ ✔️
🧭 Market Structure Sentiment
Factor Outlook
Trend Bullish 📈
Liquidity Upside still available 💧
Smart Money behavior Accumulation & continuation expected 💼
⚠️ Just watch if price breaks below the demand line → would weaken this bullish plan.

11.27 Asian early-sessiong plan for goldI. Best Execution Outcome of Yesterday’s Strategy
Combined with yesterday’s European/North American session strategy and the current chart:
Long Strategy: If you entered a long position in the 4154-4158 zone during yesterday’s European session, the price peaked at 4168.78 (near the first target of 4170), locking in ~10-14 pips of profit. Holding into the North American session would still reach the first target of 4168, but volatility narrowed due to the Thanksgiving holiday, so 4172 was not breached.
Short Strategy: Yesterday’s North American session did touch the 4170-4172 short entry zone, but no clear reversal signals (e.g., bearish engulfing/shooting star) emerged — so the short setup was not triggered (this counts as a prudent wait for valid confirmation).
II. Trading Strategy for Today (Thanksgiving Holiday)
Key Pre-Reminder: Given the U.S. Thanksgiving holiday (low liquidity, early market close, and muted volatility), avoiding trading entirely is the most risk-averse and suitable choice for today.
If you still choose to participate (for small-scale practice), use an extremely conservative range-trading plan:
1. Core Approach
Stick to micro-range scalping only (no trend trades — low liquidity drastically raises false breakout risks).
2. Minimal-Risk Trading Plan
Range Boundaries: 4158 (support) → 4168 (resistance)
Long Setup: Enter only if price hits 4158 with a clear hammer candlestick; position size: ≤3% of total capital; Stop-loss: 4155; Take-profit: 4165.
Short Setup: Enter only if price hits 4168 with a clear shooting star; position size: ≤3% of total capital; Stop-loss: 4171; Take-profit: 4162.
3. Non-Negotiable Holiday Rules
No overnight positions: Close all trades before 19:00 UTC (well ahead of the early North American close at 22:00 UTC).
Strict position limits: Do not allocate more than 5% of total capital to trades today.
Prioritize inactivity: If no clean signals appear within 1 hour, step away — sitting out is the best choice for holiday markets.
GOOD LUCK!
LESS IS MORE!

Sell Gold – Big Money ReturnsMajor structure: Strong downtrend confirmed
A previous upward Order Block was broken — clear reversal into bearish momentum
Entry 1: Fibonacci retracement zone of the down move → Use 50% volume
Entry 2: Retest of the broken Order Block high → Use full 100% volume
Monitor price action closely for signs of further liquidity hunts, new Wave/IMB formation, and manage SL/TP accordingly
This setup aligns with the V-Shark OB methodology: track the shark’s trail of big money, then ride the wave with discipline.
Disclaimer:
Trading carries risk. Past performance does not guarantee future results. Always use proper risk management and never risk more than you can afford to lose.
Tags:
#Gold #XAUUSD #Trading #OrderBlock #LiquidityHunt #VS Shark #VSharkOB #MarketStructure #TradingEducation #DayTrading #USAMarket
