XAUUSD – LANA WATCHES FOR BUY WAVE 5, SKIPS SELL ORDERS ON 03/12XAUUSD – LANA WATCHES FOR BUY WAVE 5, SKIPS SELL ORDERS ON 03/12
1. Quick Summary
Main View: H2 – H4
Data: TPO, Footprint, Elliott wave, futures/options
Idea: Today Lana prioritizes BUY with wave 5, skips Sell orders.
Lana's focus area: buy timing 4190–4194, SL 4185, TP according to wave 5 peak around 4315.
2. Futures & Market Profile Data
1. US Session TPO – “Thin” Pattern
Last night's TPO formed a Thin Profile, often appearing after strong shakeouts in an uptrend.
VA was accepted at a low area but the Market didn't spend much time here, the upper auction areas are still incomplete → high probability of price returning to test these levels.
2. Footprint – Trap Sell with Strong Delta
On the H1 candle, Footprint recorded a Trap Sell with Delta ~ -1113 contracts.
The Sell side tried to push the price down but was completely absorbed, the candle bottom became an area with a large number of trapped Sell orders.
Lana sees this as a sign: Smart money is accumulating, shaking off weak Buy positions, and collecting more FOMO Sell bottoms.
3. Elliott Wave & Key Price Areas
The raw chart according to Elliott wave is still following the scenario Lana shared earlier this week:
Monday: confirmed the up wave scenario.
Tuesday: wave 4 correction, short Sell opportunity.
Wednesday (today): waiting for wave 5 to rise, Lana prioritizes Buying.
Buy timing area 4190–4194 coincides with the nearest swing bottom and accumulation area – strong liquidity.
Ideal TP: Minimum: current wave 5 peak.
If the wave expands nicely: around 4315, or higher are the Liquidity clusters 4250–4260 and 4365–4370 as on the H4/H2 chart.
4. Trading Scenario
⭐️ Priority Scenario – ONLY BUY
Buy: 4190 – 4194
SL: 4185
TP: Near the current wave 5 peak
Far: around 4315 (everyone can split profits according to their personal plan)
During the day, Lana does not encourage selling against the trend.
This is Lana's personal perspective based on TPO, Footprint, and Elliott wave.
👉 Follow Lana on TradingView for the earliest updates
Trade ideas

XAU Buying Model #1Hello everyone, Welcome to the XAU-SYNDICATE...
This is my entry model for buying. so I'll wait for my zone, as soon as the price reaches my zone I'll look for a INT.MSS or look for bullish candle on M15. Let's test this setup in action.
#XAU-SYNDICATE

Technical corrections do not mean reversal of the bullish trend#XAUUSD OANDA:XAUUSD TVC:GOLD
📊 From the current structure, gold rebounded to a high of around 4264 yesterday before fluctuating downwards.
💠 However, the price of gold has not yet effectively broken below the daily MA5 and MA10, and there is still some support below.
📈 The brief pullback is a build-up for a better rise later.
🌈 As I said yesterday, the technical indicators showed a bearish divergence, indicating a need for technical correction. Therefore, it is not surprising that gold prices will fall in the short term.
💡 The key focus for today is the daily MA5 and MA10. The first support level is at 4205-4195. If the price retraces to this level, you can consider a small long position in gold, with appropriate SL orders.
💡 If the price falls below the 4205-4195 support zone, it is advisable to remain on the sidelines and not rush into further trading. Because the downside potential may open up, the price may fall back to the 4160-4140 Fibonacci retracement zone in the short term. This area will determine whether the upward trend can continue. Pay close attention to any stabilization signals in this area during the day.

Report 1/12/25Report Summary
Global risk has been repriced around three overlapping forces: 1) a tentative U.S.–Ukraine diplomatic channel that now contemplates land swaps, elections and security guarantees, plus a parallel Russian pitch to draw U.S. capital into Arctic minerals and a U.S.-led “reconstruction fund” sourced from frozen Russian reserves, raising the odds of trans-Atlantic policy friction even if fighting subsides; 2) an assertive U.S. homeland-security doctrine that is redirecting defense-tech spend and procurement tempo toward the Western Hemisphere (drones, ISR, AI), creating a new secular bid for dual-use tech and select primes; and 3) a growth and policy mix that still anchors the dollar and U.S. equities but leaves Europe struggling to escape a low-growth trap, even as Japan’s mix of large fiscal impulse and higher JGB yields continues to pressure the yen. U.S. stocks closed last week firmer (Dow +3.2%, Nasdaq +4.9%, Stoxx 600 +2.5%), 10-year U.S. Treasury near 4.02%, WTI ~$58.6, EUR ~1.16 and JPY ~156 per dollar, framing the starting point for risk this week.
Geopolitics, policy and growth
The Florida talks between senior U.S. officials and Ukraine, paired with plans to send envoys to Moscow, put cease-fire architecture on the table (elections timing, territorial arrangements, security guarantees). The parallel track is more disruptive for Europe: Moscow is courting the White House with a template to tap ~€300bn of frozen Russian central-bank assets for U.S.–Russia investment projects and a U.S.-led Ukraine rebuild, explicitly positioning American firms to “beat Europe” to the dividends. Expect pushback from Brussels and most EU capitals; if Washington seriously entertains this structure, we should price a wider U.S.–EU policy gap on Russia, sanctions governance and energy/minerals deals into 2026.
Separately, the administration’s “narco-terror” frame is channeling significant money toward maritime and border ISR, counter-drone and autonomy stacks. DHS was authorized for an extra ~$165bn over a decade (including surveillance tech), the Pentagon received an additional ~$1bn earmark for anti-drug and border missions, and the Coast Guard’s budget for cutters/robotics/autonomy also increased, validating revenue lines for firms selling ship-launched endurance UAVs, data fusion and anomaly detection. That redirection of spend has already produced operational outputs (e.g., record ~60k-lb cocaine seizure supported by a ship-launched ISR drone) and multi-year procurement footprints. For public markets, this creates a medium-term demand floor for select defense-tech suppliers and data platforms, even if traditional peer comps remain tied to cyclical rate and budget dynamics.
The growth mix remains U.S.-centric. Despite bouts of factor-rotation and higher equity-risk premia for “speculative corners,” the S&P 500 has repeatedly mean-reverted after sell-offs, helped by resilient top-line growth and AI-capex leverage. While “Trump-themed” assets and some non-profitable tech have slumped sharply, underscoring stretched multiples and tighter selection, quality U.S. equities and large banks are still riding favorable domestic macro and rate-path expectations. Meanwhile, gold continues to attract flows on dollar-confidence hedging and geopolitical insurance, trading near record territory (~$4,200/oz, up ~60% YTD).
Europe’s outlook is more fragile. Even before any U.S.–EU divergence over Russia-asset usage, Europe’s slow productivity and manufacturing slump leave it vulnerable to external shocks and internal fragmentation. In contrast, Japan combines the largest fiscal package since Covid with multi-decade-high JGB yields, inviting foreign participation in the long end and keeping USDJPY elevated, until BoJ/MoF tolerance is exhausted.
Market reactions so far
Cross-asset price action is consistent with “U.S. resilience + Europe/Japan policy experiments”: U.S. equities up, duration steady around 4.0% on the UST 10y, crude subdued near $58–59 despite Venezuela-related rhetoric (balanced by ample non-OPEC supply and soft ex-U.S. demand), the euro mid-1.16s, and yen above 155 as Japan’s yield rise has not yet rewritten carry math. Weekly closes on the Dow, Nasdaq, Stoxx 600, the 10-year, WTI, EUR and JPY quoted above anchor the near-term technicals.
Strategic forecasts and implications
U.S.–Ukraine diplomacy with a commercial overlay is a volatility wildcard for Europe. If Washington leans into a settlement package that monetizes frozen assets through U.S. investment vehicles, Europe faces a political squeeze: approve a structure it views as morally hazardous and economically sidelining, or risk being painted as blocking peace and reconstruction. The base case is iterative bargaining and legal engineering around sanctions law; the tail risk is a public trans-Atlantic rift that pressures the euro and EU risk assets while supporting relative U.S. outperformance.
Defense-tech refocus to the Western Hemisphere carries fiscal and sector consequences. The new mission set will hard-wire spending on maritime ISR, autonomy, counter-UAS and data fusion into out-year budgets. That supports revenue visibility for dual-use platforms and software integrators with accredited deployment histories. For credit, this can compress spreads for suppliers with recurring federal revenue and strong CPARS footprints. The political flip side is oversight risk: congressional probes into alleged ROE breaches and civilian-casualty claims can slow authorizations or re-shape procurement language, introducing event risk to contractors.
Europe’s macro remains constrained by low TFP, energy-intensity in heavy industry, and slow capital-market integration. Even a successful cease-fire in Ukraine won’t fix those fundamentals quickly. Expect the ECB to stay data-dependent with a cautious easing bias in 2026, but the growth dividend from lower rates is capped without structural reforms.
Japan’s policy mix keeps the yen soft in the absence of a stronger BoJ reaction or direct MoF intervention. The announced stimulus props real incomes and corporate capex but adds to JGB supply, pushing term premia higher and keeping USDJPY bid until markets price either a credible inflation-control pivot or FX-desk red-lines. That leaves spillover risk to global rates if JGB volatility spikes.
Risks
Key downside risks include a noisy U.S.–EU split over the legal use of Russian assets; governance headlines around homeland-security operations that chill the new defense-tech bid; a sharper European industrial contraction; and a BoJ/MoF policy surprise that snaps yen carry. Upside risks include a credible Ukraine cease-fire framework with burden-sharing that avoids sanction leakage; faster-than-expected EU internal-market and capital-markets union progress; and a benign U.S. disinflation path that allows the Fed to glide policy down without rekindling inflation.
Opportunities
In equities, the mix favors U.S. quality compounders and cash-generative AI infrastructure enablers over speculative growth; defense-tech names with verifiable field performance and multi-year IDIQs screen well against the new spend. In credit, suppliers with sticky federal revenues benefit from visibility and improving leverage metrics. In commodities, structurally higher gold allocations remain justified as long as the market prices dollar-regime tail risks and geopolitics; energy beta is tactically limited by supply elasticity but has call-option upside if Venezuela or Gulf tensions escalate.
Asset-by-asset impact map
XAUUSD (gold). The conjunction of geopolitical bargaining, debates over the use of frozen sovereign assets, and persistent U.S. fiscal deficits sustains safe-haven and “anti-financial-repression” demand. With spot already near records and broad investor participation rising, pullbacks should remain shallow unless the dollar rallies strongly on a positive U.S.–EU concord or a decisive global soft-landing narrative.
S&P 500 / Dow Jones. Earnings resilience plus AI capex continue to offset factor-risk from expensive “story” names. Expect further internal rotation rather than index-level stress unless 10-year yields lurch well above ~4¼–4½% again, or geopolitics triggers a broader risk-off. Last week’s gains on both indices highlight the default “buy-the-dip” bias while macro stays benign.
USDJPY. Japan’s fiscal-plus-yield mix leaves carry intact and keeps USDJPY elevated; watch for MoF jawboning and stealth interventions that can produce sharp, temporary reversals. A credible BoJ tightening pivot or JGB market instability would be catalysts for a larger yen snapback; absent that, the path of least resistance remains a high-150s range.
DXY (broad dollar). Two-way risks dominate. A stronger U.S. growth and equity pulse supports the dollar, but any policy architecture that visibly sidelines Europe over Russia-asset usage could paradoxically weaken it if it intensifies U.S. deficit and sanctions-regime concerns. Near term, range-bound price action around last week’s levels is the base case.
Crude Oil. Fundamentals lean soft (ample supply, mixed global growth), yet the geopolitical options skew upside: explicit U.S. “closed airspace” around Venezuela and any Gulf friction would bid risk premia. With WTI anchored near the high-$50s, the market is effectively short geopolitical volatility; hedging upside tails makes sense here.
Euro–Dollar (EURUSD). Structural European underperformance and policy uncertainty cap euro rallies. If Washington pursues a Russia-asset construct perceived as extractive for Europe, EURUSD is likely to underperform cyclical peers. A positive surprise would be tangible EU progress on internal-market integration and capital formation alongside a Ukraine framework that preserves EU agency; that could re-rate the euro medium-term.
What to watch next
The immediate catalysts are any communiqués from the U.S.–Ukraine–Russia channels (particularly language on asset monetization and security guarantees), procurement disclosures and hearings tied to homeland-security operations, and the next U.S. inflation print versus the market’s December-cut expectations, given the S&P 500’s sensitivity to the rates path. Weekly closes and headline levels above provide the reference frame for trading the reaction.
Positioning playbook (2–6 weeks)
XAUUSD (gold). Bias stays buy-the-dip while geopolitics, sanctions mechanics around frozen sovereign assets, and U.S. fiscal slippage keep insurance demand elevated. Work bids into 3–5% pullbacks from spot rather than chasing breakouts. The simplest discipline: stay long above the rising 20-day average on daily closes; flatten if you get a decisive weekly close through the 50-day and the dollar is firming simultaneously. Near-term upside is incremental (prior high plus ~3–5%) unless we see a distinctly risk-off shock; the main drawdown risk is a broad “soft-landing” rerating that lifts real yields and the dollar together. Hedge with short-dated put spreads if DXY lurches higher on U.S. data beats.
S&P 500. Keep a core long in quality/cash-rich tech and capex beneficiaries, but pair it with cheap index downside into data/event windows. The tactical buy zone remains modest pullbacks toward the rising 50-day or after a 1–2 day de-rate in AI leaders without deterioration in breadth. Invalidate the long if you see a weekly close below the 50-day with negative advance–decline and 10-year yields backing up; that combination tends to extend corrections. Upside is a grind (new high plus a couple percent) unless long rates break lower; a clean disinflation print would extend the run. A 1–2% notional SPX put-spread collar around key prints is still efficient.
Dow Jones. Use it as the lower-beta leg of U.S. equity risk. Domestic cyclicals and defense-tech exposure give it a different factor mix from the Nasdaq. Buy dips toward the 50-day when financials and industrials lead on up days; de-risk if banks roll over alongside a bear-steepening in USTs (10s > ~4¼–4½% with cyclicals lagging). Pairs: long DIA vs short EuroStoxx futures on European-growth disappointments.
USDJPY. Policy mix (big fiscal + sticky JGB term premium) keeps carry attractive. The trade is “long with a parachute.” Add on shallow dips when U.S.–Japan 2-year spread widens; cut fast on signs of MoF action (sudden 3–5 yen intraday drops on no data, heavy TOPIX banks sell-off, BoJ liquidity ops surprise). A daily close below the prior intervention shelf is your hard stop; otherwise, let carry work. Optional structure: long USDJPY spot with a cheap 1–2 month downside put as intervention insurance.
DXY (broad dollar). Expect rangy two-way trade. Stay tactical rather than thematic: buy the dollar on hot U.S. activity/inflation beats or if European political noise pops; fade it when U.S. data cools or if we get cleaner global growth breadth. If you must express the view, prefer it versus the euro (see below) rather than versus high carry EMs with improving flows.
EURUSD. Base-case is sell rallies. Europe’s weak manufacturing pulse and policy frictions cap upside, while any U.S.–EU tension over Russian-asset monetization risks adds a euro risk premium. Scale in on 1–2 big green candles into resistance; target a drift lower back toward recent mid-range, with a stretch target on negative EU data surprises. Invalidate on a weekly close above the last swing high backed by better eurozone credit impulse or a hawkish-surprise from the ECB. Cleaner expression for portfolio context: short EURUSD funded out of long USDJPY to keep overall dollar beta more balanced.
Crude oil (WTI/Brent). Fundamentals are soft near term, but the options skew is to the upside because the market is effectively short geopolitics. The smartest posture is barbell: maintain a small core long in front-month with tight stops, and own cheap out-of-the-money calls 1–3 months out for regime-shift risk (Venezuela enforcement, Gulf incident, or an abrupt OPEC discipline pivot). Fade sleepy rallies into known supply unless spreads tighten and inventories confirm. Invalidate the core long on a decisive weekly close below recent range lows with time-spreads weakening.
Catalyst map you should trade around
U.S. inflation and labor prints remain the first-order driver of USTs and equity multiples; expect vol clusters around CPI/PCE and payrolls. Any communiqué on a Ukraine cease-fire framework that spells out treatment of frozen Russian assets is a euro-risk event; if it tilts toward U.S.-centric monetization, fade EURUSD and EU banks on the headline. Watch House/Senate oversight hearings on homeland-security operations and defense-tech procurement—contract language can move single names and occasionally the group. In Japan, BoJ operations and MoF rhetoric are live: sudden changes in JGB purchase plans or an unscheduled presser are your USDJPY tripwires. For oil, keep an eye on enforcement signals in U.S.–Venezuela policy and any unplanned Gulf disruptions.
Risk controls and “when to be flat”
Be flat (or lightly net short index beta) if you get a synchronized trio: 10-year yields backing up, dollar rising, and equity breadth flipping negative—historically, that mix feeds momentum sellers. For USDJPY and gold, always respect event-risk gaps: hold smaller spot and express edges with options into the most binary windows. For crude, avoid leverage through weekend risk unless you’re explicitly long optionality.

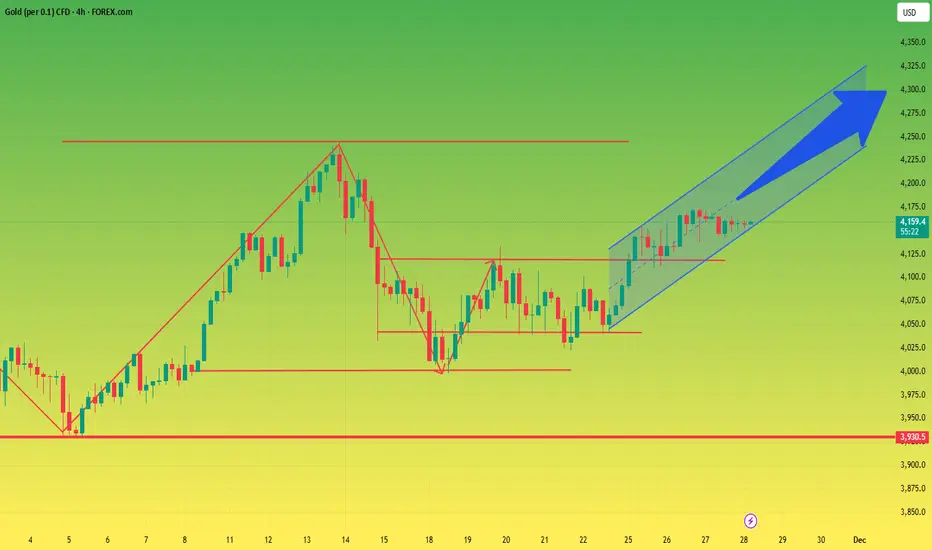
Bank holiday what will gold price be on 28 november 2025?1️⃣ Trendline
Ascending Trendline (red channel)
Price is moving inside a short-term ascending channel, forming higher highs and higher lows.
Recently touched the upper boundary → a technical pullback toward the lower boundary is likely.
Descending Trendline (red dotted)
This is a dynamic resistance from the higher timeframe.
Price has just broken above it; a retest is normal → creating a strong confluence area.
2️⃣ Key Support & Resistance
Resistance
4,240 – 4,245 (Fibo 1.618 + major supply zone)
→ This is the upside target if price continues to hold within the ascending channel.
Support 1 (nearest)
4,165 – 4,170 (trendline + MA + previous consolidation zone)
→ This zone is crucial for maintaining the bullish structure.
Support 2 (stronger)
4,095 – 4,112 (Fibo 0.5 – 0.618 + broad demand zone)
→ If Support 1 breaks, price may retrace deeply into this area.
3️⃣ Fibonacci Levels
Fibo 1.0 at 4,162 → currently the main retest point.
Fibo 0.618 at 4,111 → strong confluence with the major demand zone.
Fibo 1.618 at 4,245–4,255 → matches the top resistance → primary bullish target if the trendline holds.
4️⃣ Scenarios
Bullish Scenario (preferred)
If price holds above 4,165 – 4,170
→ it continues following the ascending channel → target 4,240 – 4,245.
Bearish Scenario
Break of the trendline + candle close below 4,165
→ confirms a correction phase → price likely moves down to 4,109 – 4,105.
Trade Ideas
BUY GOLD:
4165 – 4162
Stoploss: 4152
Take Profit: 100 – 300 – 500 pips
SELL GOLD:
4240 – 4243
Stoploss: 4250
Take Profit: 100 – 300 – 500 pips

XAUUSD is ready for a deeper correctionA Historical Run
For the last 2 months, Gold ( OANDA:XAUUSD ) was an absolute monster. Near vertical move. All pullback shorts were destroyed. The momentum was just intense.
Corrective Structure
As all impulsive moves must, the rally is now exhausted , and we are in a corrective phase. Price is no longer going up, but it is consolidating.
What's Next?
The current wave down appears to be shaping into a bearish AB=CD.
In a classic AB=CD pattern, the length of the CD leg must equal the length of the AB leg.
I will not be looking for any long setups until price reaches $3700~3770 range, and shows signs of reversal.
Until then, my view is still bearish on XAUUSD. I'm expecting a pullback testing the previous resistance ($4150) then continuation to the down side.
Good Luck!

XAUUSD Bullish Momentum Continues — Target 4,350OANDA:XAUUSD is still trading within a clearly defined ascending channel, with recent price action bouncing off a key support level. This suggests that the bullish trend is likely to continue, with the next target being around 4,350, aligning with the upper boundary of the channel.
A short-term pullback could present a buying opportunity, especially if bullish candlestick patterns like engulfing or hammer appear, signaling strength from the buyers. A decisive breakout above recent highs would further reinforce the momentum towards the expected target.
However, if the price breaks below the lower boundary of the channel, it would invalidate the bullish outlook and potentially signal a shift in market direction.
This is just my perspective on the market, not financial advice. Best of luck!

Short gold near $4160, target price $4130 -Short gold near $4160, target price $4130 -
Yesterday's gold price movement perfectly matched our analysis.
Gold prices remain weak today, partly due to the Thanksgiving holiday. However, the overall structure remains unchanged.
We shorted at $4160 with a stop-loss at $4180.
Currently in profit of 10 points.
However, I believe gold still has significant downside potential.
Today's short profit target range: $4130-$4110
Sell price: $4160-$4165
Stop-loss price: $4185
Take-profit price: $4110-$4130

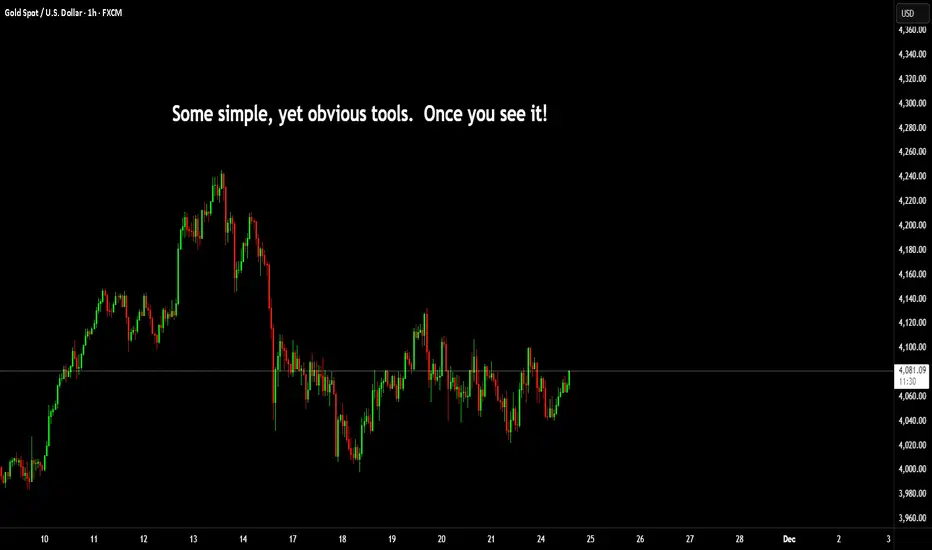
Very useful techniques to learnI have recently posted several posts around mechanical and simple charts. This is another insight into some professional techniques that are not often shown.
Gann talked about High and low candles and opposing ticks.
Lowest Tick of the Highest Bar: This refers to the lowest price point (or low tick) of the highest price bar (or highest price period) on the chart. It indicates a crucial support level. If the price falls below this point, it may signal a downward trend or a breakdown.
Highest Tick of the Lowest Bar: Conversely, this refers to the highest price point (or high tick) of the lowest price bar (or lowest price period). This represents a key resistance level. If the price rises above this level, it may indicate an upward trend or a breakout.
Here's an image showing this in an uptrend.
And another for a downtrend.
Then what you would expect from this, would be a move similar to this and of course you can't expect it every time. But to appreciate it, you need to understand the logic as to why this is important in the first instance.
The simple explanation of that is in an uptrend that lowest tick of the highest bar was in fact the exact area buyers failed and sellers took control. Obviously, the inverse is true of a downtrend. The highest point of the lowest candle, means buyers are back pushing prices higher.
Into the future you MIGHT but not always see these levels as support or resistance.
When you overlap this with the mechanical techniques, you can use this for range entries. Here's a post on mechanical techniques.
==========================================
Second tip is to do with volume.
Many people seem to have volume on their chart, but don't really know how to utilise it.
Now, imagine the areas I mentioned in the first tip. As price nears these zones (other other zones) order blocks, supply or demand, fib levels.
If you could quickly identify what story volume is trying to tell you. Then there is a huge benefit to know how you need to react to the price action.
In this image; Look at the spikes in volume until the orange arrow point.
What you can see from this next image, is the orange arrow is the turning point.
For it's next stop after breaking through the PoC of the range from the prior low to its high. You can draw a line, extended from the highest tick of the lowest candle.
Price comes back, and as explained in the example above. Buyers step back in and drive the price directly away from this level.
Now; let's go one step further.
In this image I have the volume profile on the left representing the swing low to high and then the profile on the right from that high to the fresh swing low.
You can see from the sell side pressure where price has interest to both parties.
Next you have both lines drawn on the chart of the opposing candles, like this.
Here. we can look at if the market is seeking outside or inside liquidity.
However, if you look back at the volume on the bottom of the chart. Are we seeing green candles and volume increasing? or red candles with volume increasing? This is where the second tip becomes very, very useful.
If you can identify the phase of internal or external, areas of interest. You can confirm this with volume clues on the chart and you will find yourself on the right side of the trade more often than not.
Have a great week all!
Disclaimer
This idea does not constitute as financial advice. It is for educational purposes only, our principal trader has over 25 years' experience in stocks, ETF's, and Forex. Hence each trade setup might have different hold times, entry or exit conditions, and will vary from the post/idea shared here. You can use the information from this post to make your own trading plan for the instrument discussed. Trading carries a risk; a high percentage of retail traders lose money. Please keep this in mind when entering any trade. Stay safe.
Gold Market Structure: Buyers Targeting Upper Supply Zone"XAUUSD – Intraday Structure & Key Levels
This chart highlights a clean range-to-range flow on XAUUSD, showing how price is reacting between a demand zone and a supply zone.
🔶 Key Zones
Demand Zone (Lower Box – ~4160 area)
Price previously tapped this level with a strong bullish reaction, confirming it as an area where buyers are active.
Supply Zone (Upper Box – ~4260 area)
This level rejected price earlier, making it a clear upside target for bulls.
🔶 Market Structure
Price formed a higher low after rejecting the demand zone.
A series of bullish impulses and shallow pullbacks suggest growing buyers’ strength.
Current price is pushing upward toward the supply zone, following a corrective pullback.
🔶 Projection / Idea
The sketch on the chart illustrates a potential path:
1. Continuation to the upside as long as intraday structure remains bullish.
2. A small pullback may occur, but higher highs are expected.
3. Main target: retest of the 4260 supply zone, where reactions should be monitored for either breakout or rejection.
🔶 Bias
Bullish toward the supply zone unless the market breaks structure and falls back below the recent higher low.

December 3rd - Gold's correction is over, continue to buy!What recent news has influenced gold prices? How should we assess the future direction of gold?
On Wednesday (December 3rd) in early Asian trading, spot gold traded in a narrow range, currently hovering around $4218.69 per ounce. Although there has been a slight pullback due to profit-taking in the short term, multiple positive factors are quietly accumulating, and investors are focused on the upcoming Federal Reserve policy meeting. Currently, spot gold prices are fluctuating around $4200 per ounce, with market sentiment wavering between expectations of interest rate cuts and economic data. Analysts generally believe that this is not just a short-term fluctuation, but rather a prelude to a higher peak. Looking back at Tuesday's price action, gold prices retreated after reaching a six-week high, but rebounded strongly at the end of the session, showing strong buying support on dips. Meanwhile, the surge in global central bank gold purchases, the decline in US Treasury yields, and the escalation of geopolitical tensions have all provided a solid foundation for gold's support.
The Federal Reserve's policy direction is undoubtedly a core variable influencing gold prices. Currently, the market prices in an 89% probability of a 25 basis point rate cut at the Fed's December meeting, a significant increase from 63% a month ago. This is attributed to dovish signals from Fed policymakers and signs of a cooling US economy. Weaker-than-expected manufacturing data released on Monday further increased pressure for a rate cut. Investors are closely watching upcoming key data releases, including Wednesday's November ADP employment report and Friday's September Personal Consumption Expenditures (PCE) index, the Fed's preferred inflation indicator. While these data may not overturn the rate cut decision, they will provide further guidance on the Fed's interest rate path. Combined with today's upcoming releases of the US November ADP employment change, September import price index month-on-month, September industrial production month-on-month, and November ISM non-manufacturing PMI, any data indicating economic weakness, coupled with geopolitical risks, will further amplify the upside potential for gold. In conclusion, while the gold market faces short-term profit-taking pressure, multiple factors, including expectations of a Fed rate cut, strong central bank gold purchases, declining US Treasury yields, a weakening dollar, and geopolitical uncertainties, are collectively driving an upward breakout. Looking ahead, with the new year approaching, the $5,000 target is not out of reach. Investors should closely monitor the Fed meeting results and key economic data.
Gold Trading Strategy Reference:
Short Position Strategy:
Strategy 1: Sell gold in batches around 4260-4265 with 20% of your position. Stop loss at 8 points. Target 4230-4200, with a further target of 4185 if it breaks through. (This strategy is time-sensitive; please check this post for updates.)
Long Position Strategy:
Strategy 2: Buy gold in batches around 4180-4185 with 20% of your position. Stop loss at 8 points. Target 4220-4250, with a further target of 4265 if it breaks through. (This strategy is time-sensitive; please check this post for updates.)

XAU/USD Bullish Structure Activated – Premium Swing Setup Ahead🏆 XAU/USD GOLD BREAKOUT BLUEPRINT 📈
Swing Trade | Bullish Momentum Confirmed
═══════════════════════════════════════
📊 TRADE SETUP AT A GLANCE
🟢 Asset: XAU/USD (Gold vs U.S. Dollar)
📍 Strategy: Swing Trade | Moving Average Breakout
⚡ Bias: BULLISH | Momentum Confirmed
📊 Timeframe:
⏰ Setup Type: Technical Breakout + Price Action
🎯 ENTRY STRATEGY
✅ Entry Zone: Flexible Entry Levels
Market Order or Limit Orders acceptable
Align with current support/resistance structure
Confirm breakout candle closure above moving averages
💡 Confirmation Signals:
Price breakout above key moving average (MA)
Volume confirmation
Support hold above
🛑 RISK MANAGEMENT
Stop Loss Level: 4,050.00 ⛔
Strategic placement below swing low
Protects against false breakout
IMPORTANT: Adjust SL based on YOUR personal risk tolerance & strategy
Risk/Reward Ratio: Minimum 1:2 recommended
⚠️ Disclaimer: This is MY suggested level only. You have complete discretion to set your own stop loss based on your trading plan, account size, and risk management rules.
🎖️ PROFIT TARGETS
Primary Target: 4,260.00 🚀
Strong resistance zone identified
Overbought levels approaching
Key technical barrier zone
📌 Target Rationale:
Resistance confluence
Previous rejection zone
Risk:Reward alignment
⚠️ Disclaimer: This is MY suggested target only. You retain full control over your take-profit levels. Exit at YOUR predetermined levels based on your strategy, profit goals, and market conditions.
💼 RELATED PAIRS TO MONITOR (CORRELATION ANALYSIS)
📍 USD INDEX (DXY) - Strong Inverse Correlation ⬇️
Why Watch: Gold is priced in USD. Weaker dollar = Stronger gold
↓ DXY pressure supports XAU/USD upside
↑ DXY strength threatens gold rally
Key Level: Watch 104.50 - 105.00 zone
📍 EURUSD - Inverse Dollar Relationship ⬆️
Why Watch: Euro strength indicates dollar weakness, bullish for gold
↑ EURUSD strength = Tailwind for XAU/USD
↓ EURUSD weakness = Headwind for gold
Key Level: Watch 1.1000 - 1.1100 support
Correlation: 0.75+ inverse (very strong)
📍 GBPUSD - Inverse Dollar Relationship ⬆️
Why Watch: Similar to EUR; British Pound weakness/strength affects gold demand
↑ GBPUSD strength = Supportive for XAU/USD
Key Level: Watch 1.2700 - 1.2800 zone
Correlation: 0.70+ inverse relationship
📍 US 10Y YIELD (TNX) - Inverse Relationship ⬇️
Why Watch: Rising yields = Stronger dollar + Higher opportunity cost for holding non-yielding gold
↑ TNX pressure = Headwind for gold
↓ TNX decline = Tailwind for gold
Key Level: Watch 4.20% - 4.50% threshold
Impact: Direct fundamental driver
📍 S&P 500 (SPX) - Risk Sentiment Correlation ⬇️
Why Watch: Risk-off = Flight to safety (gold rallies); Risk-on = Equities rally (gold declines)
⬆️ SPX weakness = Typically bullish for gold (safe-haven demand)
Key Level: Watch 6,800 - 6,850 support zone
Correlation: -0.30 to -0.50 (inverse; moderate)
📍 OIL (WTI/BRENT) - Inflation Proxy ⬆️
Why Watch: Oil/inflation expectations influence real rates and gold demand
↑ Oil strength = Inflation concerns = Bullish for gold
Key Level: Watch $75 - $80 zone
Correlation: 0.40+ positive
🔑 KEY CORRELATION POINTS
DXY (Dollar Index) moves in the OPPOSITE direction to gold with a -0.85 correlation (very strong inverse). This is the primary driver—when the dollar weakens, gold strengthens, and vice versa.
EURUSD & GBPUSD both show strong inverse correlations at -0.75 and -0.70 respectively. Euro and Pound strength indicate dollar weakness, which supports gold upside as secondary support signals.
TNX (10-Year Yield) maintains a -0.80 inverse correlation. Rising yields strengthen the dollar and increase the opportunity cost of holding non-yielding gold, while declining yields support gold appreciation. This is a fundamental driver of gold price action.
SPX (S&P 500) has a moderate -0.40 inverse correlation reflecting risk sentiment. When equities decline (risk-off), investors flee to safe-haven assets like gold. When stocks rally (risk-on), gold typically retreats as capital rotates to higher-yielding assets.
Oil (WTI/Brent) shows a +0.40 positive correlation. Rising oil prices often signal inflation concerns, which supports gold demand as an inflation hedge and real asset store of value.
📋 PRE-TRADE CHECKLIST
✅ Moving average breakout confirmed?
✅ Volume supporting the move?
✅ DXY weakness OR USD decline confirmed?
✅ 10Y Yield below 4.50% zone?
✅ Risk/Reward ratio minimum 1:2?
✅ Your personal SL/TP levels SET?
✅ Position size calculated per YOUR risk?
✅ Economic calendar clear for next 24hrs?
Happy Trading! 🚀📈
Risk What You Can Afford to Lose | Trade Smart | Manage Risk

12.01 Euro early-session plan for goldXAUUSD (Gold vs. USD) 1-hour Trading Plan for Today’s Europe & US Sessions (Long-Only)
1. Primary Strategy: Buy on Pullback (Priority Execution)
- Trigger: Price pulls back to the 4218-4225 zone (near the "Support Zone" + 0.382 Fib support on the chart) + bullish candlestick pattern forms (e.g., bullish engulfing, hammer).
- Entry: Go long immediately.
- Stop Loss: Below 4210.
- Targets: First target at 4255; if broken, second target at 4285 (Target Zone 1 on the chart).
2. Secondary Strategy: Buy on Breakout (Supplementary Execution)
- Trigger: Price holds above 4255 + closes as a solid breakout bullish candle (no long upper wick).
- Entry: Go long with a smaller position (60%-70% of the primary strategy’s position size).
- Stop Loss: Below 4240.
- Targets: First target at 4285; second target at 4302 (Target Zone 2 on the chart).
3. Supplementary Strategy: Add Position on Extreme Pullback (Execute Cautiously)
- Trigger: Price unexpectedly pulls back to 4214 (0.382 Fib support) + shows reversal signals (e.g., doji, volume-spiked bullish candle).
- Entry: Add to the position with a small size (total position ≤ 1.5x the primary strategy’s size).
- Stop Loss: Below 4200.
- Targets: First target at 4246 (current price level); second target at 4255.
GOOD LUCK!
LESS IS MORE!

XAUUISD: Market Analysis and Strategy for December 1stGold Technical Analysis:
Daily Resistance: 4330, Support: 4150
4-Hour Resistance: 4265, Support: 4193
1-Hour Resistance: 4256, Support: 4226
The monthly chart's renewed upward movement reinforces the continuation of this year's bull market. Last Friday's strong rally indicates that the short-term upward trend has not been hindered, further strengthening bullish expectations for early December.
The daily chart continues last Friday's upward trend, with the "rounded bottom" candlestick pattern remaining intact. The Asian session also saw a strong upward breakout, with the Bollinger Bands expanding upwards, moving average support moving higher, and the MACD/KDJ indicators turning upwards. Today's accelerated breakout above previous highs is also a bullish signal. Short-term trading should follow the trend! Long-term holders can wait for the Fed's interest rate decision before considering buying opportunities!
Based on the 1-hour chart, gold continued its upward trend during the European session. The candlestick pattern is within an upward channel, and the short-term Bollinger Bands are narrowing upwards. Be aware of potential sideways consolidation followed by a rebound after indicator correction. Resistance is seen around 4260; a break above this level could lead to further gains towards 4300/4330. Support levels are around 4230/4222.
Trading Strategy:
BUY: 4230~4222
Selling should wait for a bearish pattern to emerge in real-time.
Gold LONG term prediction I think GOLD will start Big correction soon. From 4.5k to 3k ,
Waiting below 3k for the next 6 months .Similare to 2008 !
I will waiting there to buy some golds and its starts bullish move for 3 years at least , to reach 9-10k , watch approximately times prediction & timeframe too.

I will go long on gold at $4125-$4150.With the week drawing to a close, let's review our trading performance. Overall, we've maintained a profitable trend. Since the market opened on Monday, we bought at the low point and the price of gold rose all the way up. We continued to buy on dips and the price continued to fluctuate upwards. Our trading strategy remained to buy on dips until the price approached the key resistance area and then entered a consolidation phase.
After a period of steady rise, gold prices have been fluctuating narrowly around previous highs recently, with the range of fluctuation gradually narrowing. Market expectations for a further rate cut by the Federal Reserve in December continue to rise, coupled with a positive outlook for geopolitical peace negotiations, which has boosted global risk appetite. Some funds have shifted from safe-haven assets to risk assets, putting some downward pressure on gold prices in the short term. Although the US economic data released this week showed a mixed picture, it did not significantly change the market's overall assessment of the monetary policy path. The structural discrepancies in the data reinforced expectations that the Federal Reserve would maintain its accommodative stance, causing the dollar index to fall to a one-week low and providing strong support for gold.
Considering the interplay of interest rate expectations, the US dollar exchange rate, and technical patterns, this round of price increases has strong fundamental support and a healthy structure. If subsequent economic data continues to indicate a slowdown in growth momentum, reinforcing expectations of interest rate cuts, gold prices may resume their upward trend after a pullback to test key support levels. However, we must be wary that uncertainties in geopolitical developments could trigger fluctuating market sentiment, thereby exacerbating short-term volatility.
Strategically, it is recommended to continue the approach of buying on dips. After the market opens, positions can be established in batches within the 4125-4150 range, with the first target at 4165; if the 4170 level is effectively broken, further upside potential will open up. The market is expected to break out of its current consolidation pattern on Friday and make a directional choice.
The above are my personal thoughts! If they are helpful to you or you agree with my ideas, please like and follow to support me! All strategies have a limited lifespan. While referring to them, it's also important to closely monitor market changes. I will respond flexibly based on actual market fluctuations, and I will provide specific updates in the channel!
XAU/USD 27 November 2025 Intraday AnalysisH4 Analysis:
-> Swing: Bullish.
-> Internal: Bullish.
Analysis and bias remains the same as analysis dated 20 October 2025.
Price has printed as per previous intraday expectation by printing a bearish CHoCH which indicates, but not confirms, bullish pullback phase initiation.
Price is currently trading within an established internal range, however, I will continue to monitor price with regards to depth of pullback.
Intraday expectation:
Price to continue bearish, react at either discount of 50% internal EQ, or H4 supply zone before targeting weak internal high priced at 4,380.990.
Note:
The Federal Reserve’s sustained dovish stance, coupled with ongoing geopolitical uncertainties, is likely to prolong heightened volatility in the gold market. Given this elevated risk environment, traders should exercise caution and recalibrate risk management strategies to navigate potential price fluctuations effectively.
Additionally, gold pricing remains sensitive to broader macroeconomic developments, including policy decisions under President Trump. Shifts in geopolitical strategy and economic directives could further amplify uncertainty, contributing to market repricing dynamics.
H4 Chart:
M15 Analysis:
-> Swing: Bullish.
-> Internal: Bullish.
As per analysis dated 14 November 2025, price has printed a bearish CHoCH to indicate, but not confirm bearish pullback phase initiation.
Price is currently trading within an established internal range.
Intraday expectation:
Price to trade down to either discount of 50% internal EQ, or M15 demand zone before targeting weak internal high, priced at 4,245.195
Note:
Gold remains highly volatile amid the Federal Reserve's continued dovish stance, persistent and escalating geopolitical uncertainties. Traders should implement robust risk management strategies and remain vigilant, as price swings may become more pronounced in this elevated volatility environment.
Additionally, President Trump’s tariff announcements, particularly against China, are expected to further amplify market turbulence, potentially triggering sharp price fluctuations and whipsaws.
M15 Chart:

ZakopiecFX GOLD XAUUSD TodayXAU/USD Gold Analysis - December 3, 2024
Current Price: Around $2,626-2,630
Intraday Range: $2,606 - $2,656
Technical Analysis
Bearish Signals:
Technical patterns show an Evening Star reversal formation near the resistance level around $2,655, along with a Hanging Man pattern around $2,630, both suggesting a potential price reversal. The MACD indicator has crossed below the signal line and is declining in negative territory, indicating fading bullish momentum. The RSI is also declining around 57, suggesting potential downward movement.
Key Support Levels:
$2,602
$2,557
$2,514
$2,460
$2,406
$2,352
$2,294
$2,220
Key Resistance Levels:
$2,645-$2,650 represents a strong barrier
Further resistance at $2,664-$2,665
$2,677-$2,678
Trading Scenarios
Base Scenario (Bearish):
Short positions below $2,602 with targets at $2,557, $2,514, and lower levels. Stop loss should be placed around $2,630.
Alternative Scenario (Bullish):
Long positions above $2,655 on increased volume, targeting $2,714, $2,774, $2,841, and higher levels. Stop loss around $2,630.
Fundamental Factors
Market Drivers:
Growing expectations of a Federal Reserve interest rate cut in December are supporting gold prices
Markets are pricing in approximately 64% chance of a December Fed rate cut
Geopolitical uncertainties and central bank demand continue supporting the precious metal
Upcoming Events:
Today: November services PMI data
Dec 4: Initial jobless claims
Dec 10: US CPI data and Fed interest rate decision
Market Sentiment
Gold is consolidating near current levels with mixed signals. While technical indicators suggest potential downside pressure in the short term, strong fundamental support from Fed rate cut expectations and safe-haven demand could limit significant declines. The market is showing uncertainty, with key moving averages near current price levels suggesting a decision point is approaching.
Trading Recommendation: Wait for a clear break above $2,655 for bullish continuation or below $2,602 for bearish movement before entering positions. Given the mixed signals, risk management is crucial.
DISCLAIMER: This analysis is for informational purposes only and should not be considered financial advice. Trading in financial instruments involves significant risk, including the potential loss of principal. Past performance does not guarantee future results. Market conditions can change rapidly, and the information provided may not reflect real-time market movements. Always conduct your own research and consider consulting with a qualified financial advisor before making any investment decisions. The author is not a financial advisor and assumes no responsibility for any investment decisions made based on this analysis.

XAU/USD 02 December 2025 Intraday AnalysisH4 Chart:
-> Swing: Bullish.
-> Internal: Bullish.
Analysis and bias remains the same as analysis dated 20 October 2025.
Price has printed as per previous intraday expectation by printing a bearish CHoCH which indicates, but not confirms, bullish pullback phase initiation.
Price is currently trading within an established internal range, however, I will continue to monitor price with regards to depth of pullback.
Intraday expectation:
Price to continue bearish, react at either discount of 50% internal EQ, or H4 supply zone before targeting weak internal high priced at 4,380.990.
Note:
The Federal Reserve’s sustained dovish stance, coupled with ongoing geopolitical uncertainties, is likely to prolong heightened volatility in the gold market. Given this elevated risk environment, traders should exercise caution and recalibrate risk management strategies to navigate potential price fluctuations effectively.
Additionally, gold pricing remains sensitive to broader macroeconomic developments, including policy decisions under President Trump. Shifts in geopolitical strategy and economic directives could further amplify uncertainty, contributing to market repricing dynamics.
H4 Chart:
M15 Analysis:
-> Swing: Bullish.
-> Internal: Bullish.
Price has printed as per analysis dated 14 November 2025 where I mentioned price to trade down to either discount of 50% internal EQ, or M15 demand zone before targeting weak internal high, priced at 4,245.195.
Price subsequently printed a bearish CHoCH, however, as mentioned yesterday, I would closely monitor price with respect to depth of pullback.
Price did not pull back with any significance, therefore, I will apply discretion and not classify an iBOS. I have marked this with red dotted and dashed lines.
Price has since printed another bearish CHoCH.
We are currently trading within an established internal range, however, as per yesterday, I will continue to monitor price with respect to depth of pullback.
Intraday expectation:
Price to trade down to either discount of 50% internal EQ, or M15 demand zone before targeting weak internal high, priced at 4,264.700.
Note:
Gold remains highly volatile amid the Federal Reserve's continued dovish stance, persistent and escalating geopolitical uncertainties. Traders should implement robust risk management strategies and remain vigilant, as price swings may become more pronounced in this elevated volatility environment.
Additionally, President Trump’s tariff announcements, particularly against China, are expected to further amplify market turbulence, potentially triggering sharp price fluctuations and whipsaws.
M15 Chart:

Gold Trade Set Up Dec 1 2025Gold remains bullish making HH/Hl on the 1h and 4h but i want to see internal 5m-15m structure play out first before looking to take buys towards BSL

Gold (XAU/USD) – Smart Money & Fibonacci Key Levels AnalysisThis chart highlights potential short and sell opportunities on Gold (XAU/USD) using Smart Money concepts and Fibonacci retracement/extension levels. Key levels are marked for:
Short entries: 4,252.44
Sell opportunity: 4,239.85
Smart Money Footprint: 4,225.57
Stop Loss: 4,271.57
Target levels are based on Fibonacci expansions (127%, 150%, 161%, 200%, 250%, 261%, 361%, 414%), showing areas where price might react or reverse.
This setup combines price action reversal signals with structural levels to identify high-probability trades and manage risk efficiently.

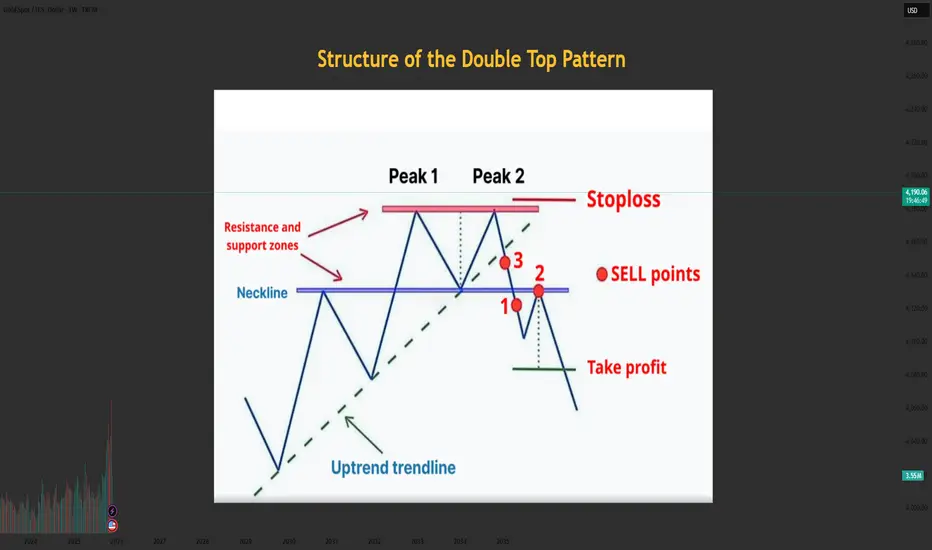
Structure of the Double Top PatternStructure of the Double Top Pattern
The Double Top consists of three main components:
1. First Top
- Price rises strongly and forms the first peak.
- Then price pulls back → creating the middle low (neckline).
2. Second Top
- Price rallies again but fails to break above the first top.
- This indicates weakening bullish pressure.
3. Neckline Breakout
- When price breaks below the neckline, the pattern is confirmed.
- This is the safest SELL entry.
Meaning of the Double Top Pattern
- Buying pressure weakens after the second top is formed.
- Sellers begin to dominate.
- Once the neckline is broken → a new downtrend begins.
- It is considered a strong and reliable reversal pattern when it forms after a clear uptrend.
Conditions for a Valid & High-Quality Double Top
✔️ The prior trend must be strongly bullish
✔️ Both tops should be approximately equal in height
✔️ Volume is usually higher on the first top and lower on the second
✔️ A strong neckline break with high volume → solid confirmation
How to Trade the Double Top Pattern
1. SELL Entry
Enter when price breaks the neckline and retests it.
✔️ The safest entry: SELL on the neckline retest → higher probability.
2. Stop Loss Placement
- Place SL slightly above the second top (or the first top).
- SL should be placed outside the structure to avoid false breakouts.
3. Take Profit (TP)
- How to estimate the target:
- Measure the distance from the top to the neckline, then project it downward.
Tips to Avoid Getting Trapped by a Double Top
1. Do NOT SELL just because price forms the second top → not confirmed yet
2. Only SELL when the neckline is clearly broken
3. Check volume or candle strength to increase accuracy
4. Combine with RSI, FVG, Trendline, Liquidity concepts for higher probability
Don’t forget to like and share your thoughts in the comments! ❤️❤️❤️
Long GOLD / XAUWealth effect ?
Strong economy
Xau is preventing to have reaction against negative fundamental factors.
It has shaped a good breakout structure in daily to see an ATH sooner or later despite almost all the thoughts in next weeks ahead
