GOLD HIGH PROBABILITY SETUP SOON!!!🚨 XAUUSD HIGH PROBABILITY SELL SETUP 🚨
* Here We Can See Clearly The Next Potential Move For GOLD Coming Hours/Days.
* Keep Your Eyes Close On Your Trading Positions.
* Happy PIP Hunting Traders.
FXKILLA.
GOLD.F trade ideas

xauusd50% retrace likey target 3956 with top blow upto 4200 who knows .. we should see a nice correction. possibly 3100 area minimum. depending on pa 5k target in next year/s

#GOLD price record I think #gold pullbacked and continu to ATH and upper resistance zone 3930
- 3950
support area 3871-3855

XAUUSD – Levels Respected Perfectly: Coincidence or Skill?Over the past weeks, we’ve been mapping out key structures on XAUUSD step by step – from Head & Shoulders, to bullish engulfing traps, to sustaining confirmations above 3752/3767.
Today, price action gave us another important confirmation:
👉 The market rejected exactly at the marked resistance zone and is respecting every level we outlined earlier.
🤔 Coincidence or Skill?
Many might call it coincidence.
But in trading, repeated alignment is not random.
This comes from:
Market Structure – Price respects liquidity & supply-demand zones.
Skill – Years of practice sharpen your ability to read patterns.
Intuition – With experience, analysis evolves into inner conviction.
Visualization – Not imagination, but mapping probabilities with discipline.
📚 Lessons from This Case Study
Respect Your Levels – If price keeps respecting them, it’s because your process works.
Discipline > Prediction – The challenge isn’t marking levels, it’s patiently trading them.
Psychology is the Sarathi – Emotions can pull us away, but discipline keeps us on track.
No Luck, Only Structure – When levels align consistently, it’s skill meeting intuition.
🧭 Closing Thought
The market is our Kurukshetra. Levels are the battlefield, the trader is Arjuna, emotions are the restless horses, and intuition is Krishna guiding the reins. Victory belongs to those who follow discipline with patience.
🔔 From here, we will continue with a new series of XAUUSD case studies, building on these foundations with deeper precision and psychological integration.
⚠️ This is an educational case study, not financial advice. Trade at your own risk.
#XAUUSD #Gold #TradingCaseStudy #PriceAction #RiskManagement #MultiTimeframeAnalysis #Tradyoga #Yogeshonale

gold A small purchase, I still consider that the gold still has momentum and probably wants to give us a few more pips.

Gold opening operation strategy
News:
The core PCE price index, the Federal Reserve's preferred core inflation indicator, rose 0.2% month-over-month in August, in line with market expectations and down from the 0.3% initially reported in July (a figure that was revised downward to 0.2%). Year-over-year, the core PCE price index remained stable at 2.9%, indicating that inflation, while declining, remains above the Fed's 2% target.
The overall PCE price index rose 0.3% month-over-month in August, in line with expectations and higher than the 0.2% increase in July. The year-over-year increase also edged up slightly from 2.6% in July to 2.7% in August.
Specifically:
Friday's US market hit near 3784 before retreating, which is also our expected target.
The market closed at 3760, with the 4-hour chart showing a bearish pullback pattern. The daily chart formed a small bullish candlestick with an upper shadow on Friday, once again crossing above the moving average, indicating a potential for a secondary rally. The weekly chart also closed with a medium-sized bullish candlestick, indicating an overall bullish trend.
From the 4-hour analysis, short-term support below is around 3735-3740, with important support remaining around 3720. Short-term pressure above is around 3770-3780. Trading strategies should focus on buying on pullbacks. In the intermediate range, be cautious in chasing orders and patiently wait for key entry points. I will provide detailed trading strategies in the channel, so please pay attention.
Strategy:
Long Position3740-3735,SL:3720,Target:3770-3790

Reaccumulation. Breakout. Distribution.
Gold. 120 days of reaccumulation.
The cT scenario looks like the base case — aiming for 3550–3600.
I’m working this setup.
What comes next is likely years of volatile distribution OANDA:XAUUSD COMEX:GC1!

XAUUSD: Targeting $3600 By End Of The YearGold has successfully bridged the liquidity gap in the daily timeframe, indicating a bullish trend since then. We have an opportune moment to initiate a bullish position within our “drawn” area. However, it is imperative to verify the volume and price dynamics in a shorter timeframe. Upon witnessing robust confirmation, it would be optimal to take any position.
We extend our best wishes for successful trading. It is crucial to adhere to meticulous risk management practices during trading. It is important to note that this analysis does not guarantee price movements in accordance with the provided description.

Bulls are strong, gold hits 4,000 this week!
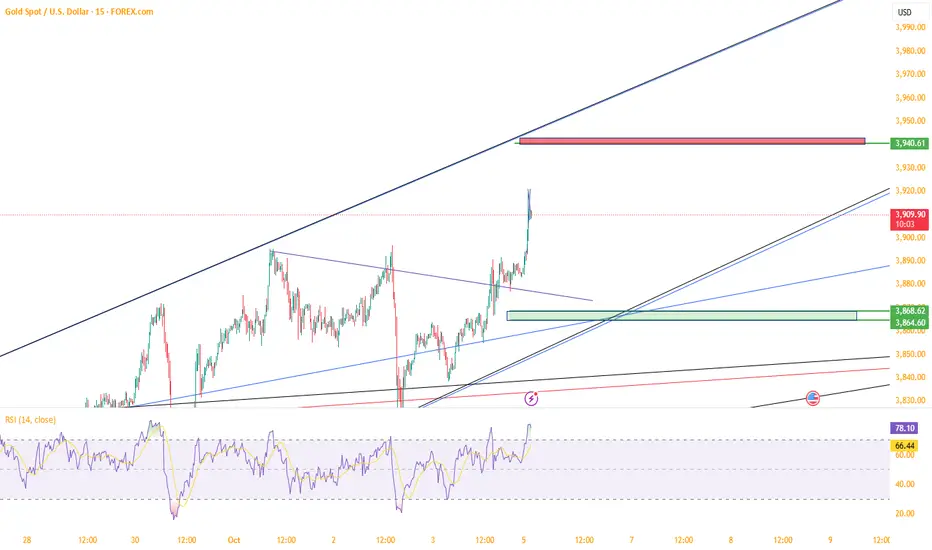
Gold continues its strong bullish trend this week, and the bullish outlook remains unchanged. Trading strategies should adhere to the principle of buying on dips and avoid guessing the top. Gold has now broken through the 3,900 mark, with the 4,000 mark as a potential upside target. From a cyclical perspective, we expect continued unilateral gains in the early part of this week (Monday and Tuesday). Be wary of a shift to a volatile upward trend or a reversal in the midweek (Wednesday and Thursday). Friday is likely to see a corrective rally, but if a midweek reversal occurs, there could be a risk of a sharp correction on Friday. Maintain a trend-following trading strategy.
Technically, gold maintains a healthy upward trend along its short-term moving average on the 4-hour chart. The bottoming out during the US trading session has completed the technical pattern, building momentum for further gains. Although prices are currently fluctuating at high levels, a new high is almost certain to occur, as similar patterns have repeatedly broken through recently. Even if prices remain in a narrow range at high levels, there is a high probability of a direct upward move at the Asian open tomorrow. Looking at the 1-hour chart, gold prices are temporarily consolidating at high levels, but smaller technical indicators are showing signs of a certain degree of divergence. This suggests a continued period of high-level volatility and strength in the short term, and we should watch for opportunities for bullish entry after pullbacks. The overall technical structure remains solid and supports a bullish outlook.
Gold Recommendation: Continue buying on dips back to 3945-3940, with a target of 3970. As long as it doesn't fall below 3900, you can continue buying! Gold will reach 4000!

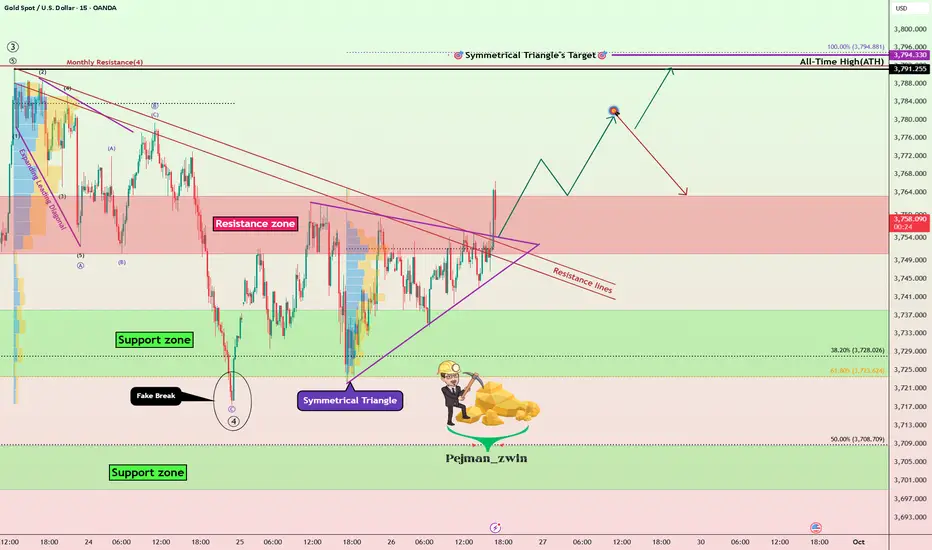
Gold Roadmap: Breakout Confirmed –New ATH or Another Correction?Gold ( OANDA:XAUUSD ) as I expected in the previous idea (Short and Long positions hit the target).
First of all, I should say that this analysis is for the short term and on a 15-minute time frame.
Gold seems to have managed to break the Resistance lines, Resistance zone($3,763-$3,750), and the upper line of the symmetrical triangle in the past few minutes.
I expect Gold to rise to at least $3,779, and then there are two scenarios for Gold: creating a new All-Time High, OR re-correcting.
Stop Loss(SL): $3,741.7
Please respect each other's ideas and express them politely if you agree or disagree.
Gold Analyze (XAUUSD), 15-minute time frame.
Be sure to follow the updated ideas.
Do not forget to put a Stop loss for your positions (For every position you want to open).
Please follow your strategy; this is just my idea, and I will gladly see your ideas in this post.
Please do not forget the ✅ ' like ' ✅ button 🙏😊 & Share it with your friends; thanks, and Trade safe.
XAU/USD UPDATE: Trader Edge - Accuracy Adjustment!🎯 KEY PIVOT ZONE
DEMAND ZONE: 3,848.00-3,866.00
➡️3 POC lines converge with highest VRVP node at current price
➡️Densest volume accumulation on visible range
➡️Price currently AT pivot - testing top of demand zone
📊 PRICE TARGETS
UPSIDE TARGETS ⬆️
T1: 3,926.00-3,942.00
T2: 3,996.00-4,012.00
DOWNSIDE TARGETS ⬇️
T1: 3,786.00-3,802.00
T2: 3,726.00-3,742.00
⚡💎⚡ EDGE - HIGHEST PROBABILITY PLAY
Long from 3,850.00-3,858.00 bounce targeting 3,926.00-3,942.00 then 3,996.00-4,012.00
🔍 PRE-ENTRY CONFIRMATION SIGNALS
✅ Price dips to 3,852.00 or below showing bullish reversal candle (hammer/bullish engulfing)
✅ Higher low forms above 3,848.00 with momentum shift upward
✅ Volume spike on bounce confirming buyer absorption
📈 TRADE SETUP
🟢PRIMARY BIAS: BULLISH
Long Setup:
Entry: 3,851.00-3,857.00 after confirmations
Stop Loss: 3,838.00
🎯Target 1: 3,926.00-3,942.00
🎯Target 2: 3,996.00-4,012.00
Risk/Reward: 1:4.2 / 1:8.5
🔄 BIAS FLIP CONDITIONS
🔴TURNS BEARISH IF:
Clean break and 2H close below 3,844.00
Volume expansion on breakdown (1.5x average)
Failed retest of 3,850.00-3,862.00 as resistance
⚡Then Target:
🎯3,786.00-3,802.00
🎯3,726.00-3,742.00
⚠️ RISK MANAGEMENT
Max Risk: $18 per 0.01 lot ($1,800 per standard lot)
Position Size: Risk 1-2% of account capital
Time Stop: Only trade within LONDON, EUROZONE & NYSE's peak volume segments

XAUUSD will delivered $4000 target XAUUSD is still maintaining the bullish after grabbing liquidity on last Friday sweeps at 3850-3855 structure zone. I will buy gold on every dip till my Traget 4000!
What will I do Today?
✅️ My First buying will be start from 3900-3890 area as Market has to respect the previous BOS on rising channel.
✅️Secondly my buying area will be 3950 zone if H4 candle closes above it.
-My target will be $3990 & 4020 In extension !!

Gold Trade Set Up Oct 3 2025Price dropped heavily yesterday making a LL but bounced up 400+ pips so i will be waiting to see if price can close above this 15m CISD, retest it to target 75 FIb before continuing its bearish trend
www.tradingview.com

XAUUSD NEXT POSSIBLE MOVE Gold is currently showing strength near support, and if this momentum continues, there’s a possibility for buyers to push the price higher. Market sentiment suggests that if support holds firm, bullish pressure can lead to an upward move. However, the move fully depends on how the market respects the current level.

Gold may reach a new high, are you ready to go long?Before updating my views, I would like to remind all my friends again: the market is always full of possibilities. There is no so-called "highest point", only higher possibilities. When the trend is clearly upward, going with the flow is the core strategy to achieve stable profits. Avoid trading against the trend or on an emotional basis, especially in the current volatile market environment. Trading without clear thinking and discipline can easily lead to unnecessary losses. For those who are still on the sidelines and haven't yet developed an effective trading strategy, please follow my channel. We will continue to provide professional market analysis, comprehensive trading plans, and precise buy and sell instructions to help you better grasp the market's rhythm.
Looking back at the performance of the gold market on Monday, gold prices once again saw a strong rise, successfully breaking through multiple key integer levels and continuously setting new highs during the session. The overall trend almost perfectly replicated the strong pattern of last Monday. As I have emphasized many times during the trading session, the current market operating rhythm is highly referenceable, especially the continuity of technical forms and capital momentum is very obvious. Therefore, I recommend investors focus on historical trend similarities and use this as a key indicator for judging the current direction. In fact, last Monday's strategy of mainly buying on pullbacks has been fully verified by the market, and investors holding long positions at low levels have already reaped considerable profits. Looking ahead to today's market, I believe we can still refer to last Tuesday's trend path for positioning. From the current technical perspective, gold remains in a typical upward trend, with moving averages showing a bullish alignment, strong trading volume, and strong buying sentiment. Considering the macroeconomic environment, continued global demand for safe-haven assets, coupled with expectations of looser monetary policies in some economies, further supports the upward trend of precious metals. Therefore, I continue to hold a bullish view on today's gold price. I expect the price to hit a new high and the increase may further expand.
In terms of specific operating strategies, it is recommended that investors establish long positions in batches around 3820, control the position ratio, and avoid entering the market with heavy positions at one time. If there is a brief intraday pullback and the price falls back to the 3810 to 3805 range, it can be seen as an ideal opportunity to increase positions. This area is not only the support level of the previous intensive trading area, but also the golden section position of short-term technical pullback, with strong dual psychological and technical support. Once the price stabilizes and rebounds, the probability of an upward breakout will significantly increase.
It is important to note that although the current trend is strong, no market can rise unilaterally and indefinitely, and more attention should be paid to risk management when volatility intensifies. Be sure to set reasonable stop-loss protection to avoid losses caused by sudden news or drastic fluctuations in liquidity. At the same time, it's important to closely monitor potential influencing factors and adjust your position structure promptly.
In short, in a market with clear trends, maintaining patience and steadfastly executing your established strategy are the keys to success. Let's seize the opportunities presented by this gold rally, trade rationally, and move forward steadily.

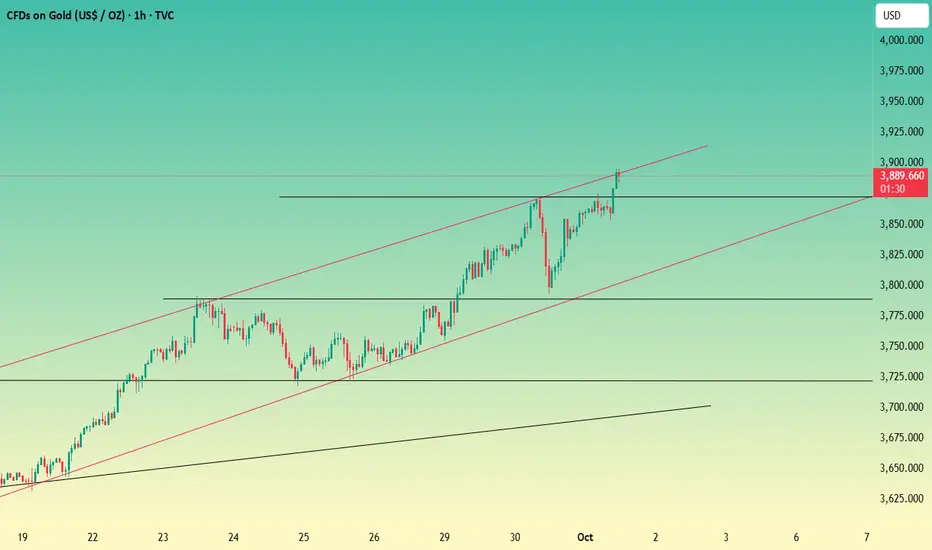
Gold Price Analysis – Bullish Channel Points to $3,936+Gold is trading around $3859 and is moving within an upward channel, keeping the overall structure bullish. Price has recently tested support near $3844 and is showing signs of holding this zone. As long as gold stays above $3840, upside momentum may continue towards $3896 first, and then extend higher towards $3936–$3960 in line with the channel’s upper boundary. On the downside, a break below $3827 could trigger a deeper pullback towards $3793, which is the channel’s base support. In summary, gold remains bullish above $3840, but a drop below $3827 would shift momentum towards further correction.
Overall, the structure remains bullish while price stays inside the ascending channel, but short-term volatility and false breakouts should be expected.
🔑 Key Levels to Watch:
- Resistance: $3896 → $3936 → $3960
- Support: Immediate support $3844 → $3827 → $3805
Note
Please risk management in trading is a Key so use your money accordingly. If you like the idea then please like and boost. Thank you and Good Luck!

Please refer to today’s gold strategy!Judging from today's market trend, in the short term, we need to focus on the support role of the 3855-3865 area. This position is the key support level for gold in the short term. Whether it can be effectively maintained will directly affect whether the subsequent market will continue to rise strongly or enter a period of volatile consolidation. If the price can remain stable in this range before the New York trading session, the market is expected to continue to expand upward.
On the contrary, if it fails to hold effectively, there is a possibility of further pullback. In this scenario, the market is expected to enter a relatively strong and volatile pattern, with a low probability of breaking through the previous high. The overall trend may further increase its range-bound and circuitous characteristics.
In terms of specific operational strategies, it is recommended to consider the following two dimensions: aggressive traders can test long orders in batches in the 3855-3865 area. If this support continues to play a role, they can maintain bullish expectations and pay attention to opportunities for prices to rise further or even break through previous highs; secondly, if this area is effectively broken and fails to rebound quickly, it indicates that the short-term upward momentum has weakened. At that time, we should be alert to the market turning into a larger range of volatile fluctuations, and then adjust the trading layout.
The following are my personal opinions. If you agree, please like and follow me! If you have better trading ideas, you can also leave a message in the comment section to share them!

Could we see 3900 before the weekend ?Gold broke the previous High 3867 making a New ATH 3894
after this break , I'm expecting a retest on 3835 to continue its uptrend movement reaching 3900
BUT
To reach 3835 we need to break the zone (3859-3853)
3835 it's an 4H FVG plus it's a strong support on the 1H time frame. Moreover, as we trace the Fibonacci from the lower low till the Higher High its showing Golden zone (3835-3820)
its a big range since this trade is a swing trade 1:3 RR ( 650 pips )
Just an IDEA
Open to further perspectives, if you have alternative views on gold movement , I'd be glad to discuss

Gold prices soar, where will the short positions go?Currently, gold is encountering resistance and falling back near 3893-3895, and the bullish momentum has weakened slightly. As mentioned earlier, the current price has reached our risk area. A large part of the reason for today's rise is that the US government has officially shut down. This kind of news-stimulated rise is not long-lasting. After encountering resistance, it will fall like a waterfall. The technical indicators have diverged and are overbought, and most funds cannot participate in long transactions in this extreme rising pattern. In order to increase liquidity, gold also needs a correction, so we consider continuing to short gold near 3893. To increase liquidity, gold also needs a pullback, so we are considering continuing to short gold around 3893.
Resistance: 3900, 3925
Support: 3872, 3843
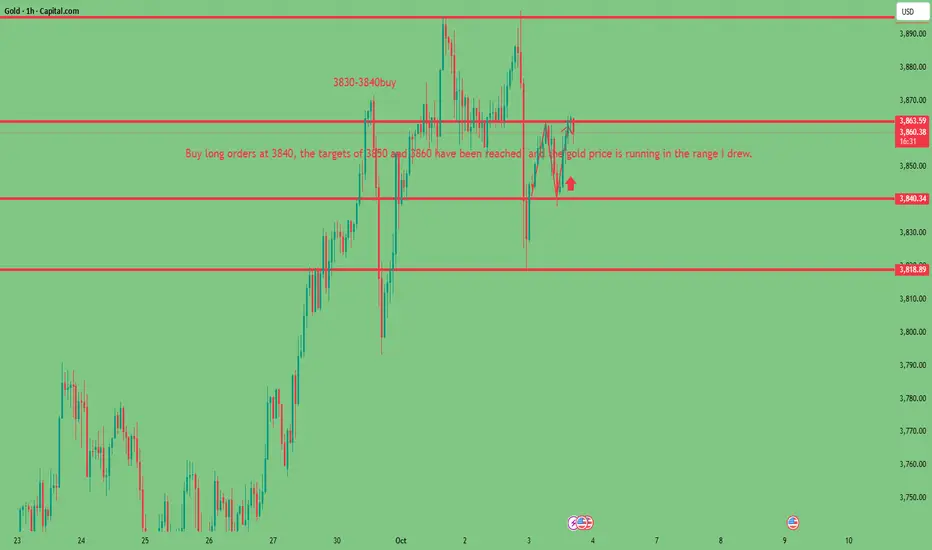
Gold 3840 multiple orders rose as expected, how to trade next!In my opinion four hours ago, I have clearly given a long strategy. When gold fell to around 3840, I entered the market with long orders. The market conditions also fully verified that my long thinking was accurate. After touching the 3840 area, the gold price started a rebound of more than 20 US dollars, successfully reaching my first target of 3850 and the second target of 3860. The current price is still running around 3860. Is gold unable to rise further? Let me explain. Anyone with a bit of technical knowledge will know that while short-term technical indicators are trending upward, 3860 marks a new high today, and the price is currently suppressed by the 60-day moving average, causing gold to fluctuate around this level.
This area is a key point for gold in the short term. Once it breaks through, the bulls will continue to attack, otherwise it will continue to fluctuate within the range. The non-farm data originally scheduled to be released today, due to the government shutdown, the U.S. Bureau of Labor Statistics is not expected to release the non-farm employment report on Friday. This also sows uncertainty for gold. Despite this, I believe that the bullish trend of gold remains unchanged. Small adjustments in the short term will not affect the overall bullish trend. It is expected that 3900 will be achieved next week.
The gold trading strategy focuses on the gains and losses of 3860-65 during the New York trading session. According to the market situation, any trading operations will be notified in the tg channel!
Key Levels for the Month 10/2025 ∷Gold∷supply 🐻&🐍&🐂 demand🔳30Day🔲
__________________________
U-Support-Resistance🔀
3705
3737
3772
3806
3840
Mids∷🏛∷
3604
3670
L-Support-Resistance🔀
3330
3386
3404
3424
3440
3475
3490
3507

Gold (XAUUSD) – 6 Oct | Waiting for Retest of Key Buy Zones🟡 Gold (XAUUSD) Analysis – 6 October
Hello Disciplined Traders,
Welcome to the Chart Is Mirror Community 👋
Market Context
• Gold remains in bullish momentum , with both H4 and M15 structures aligned to the upside.
• In today’s Asia session, the market broke the previous all-time high 3897 and cleared the key 3900 psychological level .
• After the breakout, price pulled back briefly to retest 3900 and then resumed bullish continuation.
Key Observations
• Current structure confirms strong buyer control, with pullbacks offering continuation setups.
• Four potential POIs for long opportunities are in focus:
– 3919–3924 (OB zone)
– 3906–3899 (recent demand zone)
– 3888.5–3876.9 (day low + deeper demand zone)
– 3846–3838 (HL + strong demand zone)
• Keep in mind: market may sweep liquidity below demand before resuming upside.
Execution Plan
• Wait for price to retest any of the POI zones.
• Look for LTF confirmation before entering long setups.
• If none of these zones hold, we will reassess lower levels for new opportunities.
Stillness is clarity — let price pull back into your zones before execution.
📘 Shared by @ChartIsMirror