Bank holiday what will gold price be on 28 november 2025?1️⃣ Trendline
Ascending Trendline (red channel)
Price is moving inside a short-term ascending channel, forming higher highs and higher lows.
Recently touched the upper boundary → a technical pullback toward the lower boundary is likely.
Descending Trendline (red dotted)
This is a dynamic resistance from the higher timeframe.
Price has just broken above it; a retest is normal → creating a strong confluence area.
2️⃣ Key Support & Resistance
Resistance
4,240 – 4,245 (Fibo 1.618 + major supply zone)
→ This is the upside target if price continues to hold within the ascending channel.
Support 1 (nearest)
4,165 – 4,170 (trendline + MA + previous consolidation zone)
→ This zone is crucial for maintaining the bullish structure.
Support 2 (stronger)
4,095 – 4,112 (Fibo 0.5 – 0.618 + broad demand zone)
→ If Support 1 breaks, price may retrace deeply into this area.
3️⃣ Fibonacci Levels
Fibo 1.0 at 4,162 → currently the main retest point.
Fibo 0.618 at 4,111 → strong confluence with the major demand zone.
Fibo 1.618 at 4,245–4,255 → matches the top resistance → primary bullish target if the trendline holds.
4️⃣ Scenarios
Bullish Scenario (preferred)
If price holds above 4,165 – 4,170
→ it continues following the ascending channel → target 4,240 – 4,245.
Bearish Scenario
Break of the trendline + candle close below 4,165
→ confirms a correction phase → price likely moves down to 4,109 – 4,105.
Trade Ideas
BUY GOLD:
4165 – 4162
Stoploss: 4152
Take Profit: 100 – 300 – 500 pips
SELL GOLD:
4240 – 4243
Stoploss: 4250
Take Profit: 100 – 300 – 500 pips
Trade ideas

XAUUSD Bullish Momentum Continues — Target 4,350OANDA:XAUUSD is still trading within a clearly defined ascending channel, with recent price action bouncing off a key support level. This suggests that the bullish trend is likely to continue, with the next target being around 4,350, aligning with the upper boundary of the channel.
A short-term pullback could present a buying opportunity, especially if bullish candlestick patterns like engulfing or hammer appear, signaling strength from the buyers. A decisive breakout above recent highs would further reinforce the momentum towards the expected target.
However, if the price breaks below the lower boundary of the channel, it would invalidate the bullish outlook and potentially signal a shift in market direction.
This is just my perspective on the market, not financial advice. Best of luck!

Key Levels & Bullish Bias – Intraday XAUUSD Outlook for Nov 26Gold Market Analysis – M30 Intraday Outlook
- Gold continues to push higher on the M30 timeframe, maintaining a strong bullish structure after the previous breakout.
- Current price is around 4155–4160, showing clear buyer strength and healthy continuation behavior.
- From a structural perspective, the market continues to print higher highs and higher lows, confirming that bullish momentum is still dominant.
- As long as gold remains above the 4128 pivot zone, the probability favors further upside expansion toward the next liquidity targets.
Key Levels
- Pivot Level: 4128
- Resistance / Target Zone: 4185 – 4210
- Support: 4109
- Extended Support: 4083
Trading Recommendations
✅ Primary Strategy – BUY Bias
Buy above 4128
Target 1: 4185
Target 2: 4210
As long as price holds above 4128, bullish continuation remains the most likely scenario.
🔁 Alternative Scenario
If price breaks and sustains below 4128:
Target 1: 4109
Target 2: 4083
This signals a deeper pullback into previous demand zones before any continuation attempt.
Technical Insight
- RSI remains in bullish territory, supporting further upside momentum.
- Market structure is clean and bullish, with no confirmed reversal patterns at this stage.
What are your thoughts on GOLD? Comment now or join my group to trade with me on description

Gold buy ideaGold Analysis
Gold is rejecting the London Low with a strong wick, showing buyers stepping in at a key level.
How to Trade It
1️⃣ Wait for the 15m candle to close
Wait for confirmation that price is holding above the rejection zone.
2️⃣ Targets (TPs)
TP1: 4139
TP2: 4150
3️⃣ Risk Filter
If the next candle closes below the previous 15m candle, do not take the trade. This signals weakness in the setup.

Gold Market Structure: Buyers Targeting Upper Supply Zone"XAUUSD – Intraday Structure & Key Levels
This chart highlights a clean range-to-range flow on XAUUSD, showing how price is reacting between a demand zone and a supply zone.
🔶 Key Zones
Demand Zone (Lower Box – ~4160 area)
Price previously tapped this level with a strong bullish reaction, confirming it as an area where buyers are active.
Supply Zone (Upper Box – ~4260 area)
This level rejected price earlier, making it a clear upside target for bulls.
🔶 Market Structure
Price formed a higher low after rejecting the demand zone.
A series of bullish impulses and shallow pullbacks suggest growing buyers’ strength.
Current price is pushing upward toward the supply zone, following a corrective pullback.
🔶 Projection / Idea
The sketch on the chart illustrates a potential path:
1. Continuation to the upside as long as intraday structure remains bullish.
2. A small pullback may occur, but higher highs are expected.
3. Main target: retest of the 4260 supply zone, where reactions should be monitored for either breakout or rejection.
🔶 Bias
Bullish toward the supply zone unless the market breaks structure and falls back below the recent higher low.

December 3rd - Gold's correction is over, continue to buy!What recent news has influenced gold prices? How should we assess the future direction of gold?
On Wednesday (December 3rd) in early Asian trading, spot gold traded in a narrow range, currently hovering around $4218.69 per ounce. Although there has been a slight pullback due to profit-taking in the short term, multiple positive factors are quietly accumulating, and investors are focused on the upcoming Federal Reserve policy meeting. Currently, spot gold prices are fluctuating around $4200 per ounce, with market sentiment wavering between expectations of interest rate cuts and economic data. Analysts generally believe that this is not just a short-term fluctuation, but rather a prelude to a higher peak. Looking back at Tuesday's price action, gold prices retreated after reaching a six-week high, but rebounded strongly at the end of the session, showing strong buying support on dips. Meanwhile, the surge in global central bank gold purchases, the decline in US Treasury yields, and the escalation of geopolitical tensions have all provided a solid foundation for gold's support.
The Federal Reserve's policy direction is undoubtedly a core variable influencing gold prices. Currently, the market prices in an 89% probability of a 25 basis point rate cut at the Fed's December meeting, a significant increase from 63% a month ago. This is attributed to dovish signals from Fed policymakers and signs of a cooling US economy. Weaker-than-expected manufacturing data released on Monday further increased pressure for a rate cut. Investors are closely watching upcoming key data releases, including Wednesday's November ADP employment report and Friday's September Personal Consumption Expenditures (PCE) index, the Fed's preferred inflation indicator. While these data may not overturn the rate cut decision, they will provide further guidance on the Fed's interest rate path. Combined with today's upcoming releases of the US November ADP employment change, September import price index month-on-month, September industrial production month-on-month, and November ISM non-manufacturing PMI, any data indicating economic weakness, coupled with geopolitical risks, will further amplify the upside potential for gold. In conclusion, while the gold market faces short-term profit-taking pressure, multiple factors, including expectations of a Fed rate cut, strong central bank gold purchases, declining US Treasury yields, a weakening dollar, and geopolitical uncertainties, are collectively driving an upward breakout. Looking ahead, with the new year approaching, the $5,000 target is not out of reach. Investors should closely monitor the Fed meeting results and key economic data.
Gold Trading Strategy Reference:
Short Position Strategy:
Strategy 1: Sell gold in batches around 4260-4265 with 20% of your position. Stop loss at 8 points. Target 4230-4200, with a further target of 4185 if it breaks through. (This strategy is time-sensitive; please check this post for updates.)
Long Position Strategy:
Strategy 2: Buy gold in batches around 4180-4185 with 20% of your position. Stop loss at 8 points. Target 4220-4250, with a further target of 4265 if it breaks through. (This strategy is time-sensitive; please check this post for updates.)

12.01 Euro early-session plan for goldXAUUSD (Gold vs. USD) 1-hour Trading Plan for Today’s Europe & US Sessions (Long-Only)
1. Primary Strategy: Buy on Pullback (Priority Execution)
- Trigger: Price pulls back to the 4218-4225 zone (near the "Support Zone" + 0.382 Fib support on the chart) + bullish candlestick pattern forms (e.g., bullish engulfing, hammer).
- Entry: Go long immediately.
- Stop Loss: Below 4210.
- Targets: First target at 4255; if broken, second target at 4285 (Target Zone 1 on the chart).
2. Secondary Strategy: Buy on Breakout (Supplementary Execution)
- Trigger: Price holds above 4255 + closes as a solid breakout bullish candle (no long upper wick).
- Entry: Go long with a smaller position (60%-70% of the primary strategy’s position size).
- Stop Loss: Below 4240.
- Targets: First target at 4285; second target at 4302 (Target Zone 2 on the chart).
3. Supplementary Strategy: Add Position on Extreme Pullback (Execute Cautiously)
- Trigger: Price unexpectedly pulls back to 4214 (0.382 Fib support) + shows reversal signals (e.g., doji, volume-spiked bullish candle).
- Entry: Add to the position with a small size (total position ≤ 1.5x the primary strategy’s size).
- Stop Loss: Below 4200.
- Targets: First target at 4246 (current price level); second target at 4255.
GOOD LUCK!
LESS IS MORE!

XAUUISD: Market Analysis and Strategy for December 1stGold Technical Analysis:
Daily Resistance: 4330, Support: 4150
4-Hour Resistance: 4265, Support: 4193
1-Hour Resistance: 4256, Support: 4226
The monthly chart's renewed upward movement reinforces the continuation of this year's bull market. Last Friday's strong rally indicates that the short-term upward trend has not been hindered, further strengthening bullish expectations for early December.
The daily chart continues last Friday's upward trend, with the "rounded bottom" candlestick pattern remaining intact. The Asian session also saw a strong upward breakout, with the Bollinger Bands expanding upwards, moving average support moving higher, and the MACD/KDJ indicators turning upwards. Today's accelerated breakout above previous highs is also a bullish signal. Short-term trading should follow the trend! Long-term holders can wait for the Fed's interest rate decision before considering buying opportunities!
Based on the 1-hour chart, gold continued its upward trend during the European session. The candlestick pattern is within an upward channel, and the short-term Bollinger Bands are narrowing upwards. Be aware of potential sideways consolidation followed by a rebound after indicator correction. Resistance is seen around 4260; a break above this level could lead to further gains towards 4300/4330. Support levels are around 4230/4222.
Trading Strategy:
BUY: 4230~4222
Selling should wait for a bearish pattern to emerge in real-time.
Gold LONG term prediction I think GOLD will start Big correction soon. From 4.5k to 3k ,
Waiting below 3k for the next 6 months .Similare to 2008 !
I will waiting there to buy some golds and its starts bullish move for 3 years at least , to reach 9-10k , watch approximately times prediction & timeframe too.

I will go long on gold at $4125-$4150.With the week drawing to a close, let's review our trading performance. Overall, we've maintained a profitable trend. Since the market opened on Monday, we bought at the low point and the price of gold rose all the way up. We continued to buy on dips and the price continued to fluctuate upwards. Our trading strategy remained to buy on dips until the price approached the key resistance area and then entered a consolidation phase.
After a period of steady rise, gold prices have been fluctuating narrowly around previous highs recently, with the range of fluctuation gradually narrowing. Market expectations for a further rate cut by the Federal Reserve in December continue to rise, coupled with a positive outlook for geopolitical peace negotiations, which has boosted global risk appetite. Some funds have shifted from safe-haven assets to risk assets, putting some downward pressure on gold prices in the short term. Although the US economic data released this week showed a mixed picture, it did not significantly change the market's overall assessment of the monetary policy path. The structural discrepancies in the data reinforced expectations that the Federal Reserve would maintain its accommodative stance, causing the dollar index to fall to a one-week low and providing strong support for gold.
Considering the interplay of interest rate expectations, the US dollar exchange rate, and technical patterns, this round of price increases has strong fundamental support and a healthy structure. If subsequent economic data continues to indicate a slowdown in growth momentum, reinforcing expectations of interest rate cuts, gold prices may resume their upward trend after a pullback to test key support levels. However, we must be wary that uncertainties in geopolitical developments could trigger fluctuating market sentiment, thereby exacerbating short-term volatility.
Strategically, it is recommended to continue the approach of buying on dips. After the market opens, positions can be established in batches within the 4125-4150 range, with the first target at 4165; if the 4170 level is effectively broken, further upside potential will open up. The market is expected to break out of its current consolidation pattern on Friday and make a directional choice.
The above are my personal thoughts! If they are helpful to you or you agree with my ideas, please like and follow to support me! All strategies have a limited lifespan. While referring to them, it's also important to closely monitor market changes. I will respond flexibly based on actual market fluctuations, and I will provide specific updates in the channel!
Short gold near $4160, target price $4130 -Short gold near $4160, target price $4130 -
Yesterday's gold price movement perfectly matched our analysis.
Gold prices remain weak today, partly due to the Thanksgiving holiday. However, the overall structure remains unchanged.
We shorted at $4160 with a stop-loss at $4180.
Currently in profit of 10 points.
However, I believe gold still has significant downside potential.
Today's short profit target range: $4130-$4110
Sell price: $4160-$4165
Stop-loss price: $4185
Take-profit price: $4110-$4130

XAU/USD 27 November 2025 Intraday AnalysisH4 Analysis:
-> Swing: Bullish.
-> Internal: Bullish.
Analysis and bias remains the same as analysis dated 20 October 2025.
Price has printed as per previous intraday expectation by printing a bearish CHoCH which indicates, but not confirms, bullish pullback phase initiation.
Price is currently trading within an established internal range, however, I will continue to monitor price with regards to depth of pullback.
Intraday expectation:
Price to continue bearish, react at either discount of 50% internal EQ, or H4 supply zone before targeting weak internal high priced at 4,380.990.
Note:
The Federal Reserve’s sustained dovish stance, coupled with ongoing geopolitical uncertainties, is likely to prolong heightened volatility in the gold market. Given this elevated risk environment, traders should exercise caution and recalibrate risk management strategies to navigate potential price fluctuations effectively.
Additionally, gold pricing remains sensitive to broader macroeconomic developments, including policy decisions under President Trump. Shifts in geopolitical strategy and economic directives could further amplify uncertainty, contributing to market repricing dynamics.
H4 Chart:
M15 Analysis:
-> Swing: Bullish.
-> Internal: Bullish.
As per analysis dated 14 November 2025, price has printed a bearish CHoCH to indicate, but not confirm bearish pullback phase initiation.
Price is currently trading within an established internal range.
Intraday expectation:
Price to trade down to either discount of 50% internal EQ, or M15 demand zone before targeting weak internal high, priced at 4,245.195
Note:
Gold remains highly volatile amid the Federal Reserve's continued dovish stance, persistent and escalating geopolitical uncertainties. Traders should implement robust risk management strategies and remain vigilant, as price swings may become more pronounced in this elevated volatility environment.
Additionally, President Trump’s tariff announcements, particularly against China, are expected to further amplify market turbulence, potentially triggering sharp price fluctuations and whipsaws.
M15 Chart:

XAUUSD – H4 Trend Structure Awaiting BreakoutXAUUSD – H4 Trend Structure Awaiting Breakout
Brian – Strategy to Buy on Pullback in Uptrend Channel
I. Strategy Summary
Gold continues its uptrend on H4, supported by the upward trendline from the 3,880–3,900 region.
The price is testing the resistance zone of 4,133–4,150, coinciding with the H4 supply and descending trendline, making short-term corrections likely.
Main strategy: wait for a pullback to support/FVG to buy with the trend, avoid FOMO buying at resistance.
Key levels to note: closing below 4,000 weakens the uptrend structure; below 3,884 risks shifting to a medium-term downtrend.
II. Macro Context
Unemployment Claims (weekly unemployment benefits):
Forecast: 226K
Previous: 220K
Higher-than-expected figures → indicate a weakening labor market, cooling economy, increasing the likelihood of the Fed easing sooner → real yields decrease, supporting gold.
Better-than-expected figures (lower than forecast) → support USD and bond yields, potentially causing short-term pressure on gold.
Geopolitical:
Trump's statement on easing "deadline" pressure for Russia–Ukraine negotiations ("the deadline will be when the issue is resolved") helps the market worry less about a hard deadline, but conflict risks remain. The demand for gold as a safe haven remains stable, not overly inflated but also unlikely to disappear entirely.
III. Fundamental Picture
Expectations for a rate cut cycle in 2025 continue to support gold as the market gradually prices in lower real interest rates in the medium to long term.
The demand for holding defensive assets persists amid slowing global growth and unresolved geopolitical hotspots.
In the short term, USD and US bond yields remain the two leading variables; any USD recovery can pull gold back to technical support areas, creating opportunities for buy-on-dip strategies.
IV. Technical Structure – H4 Trend Channel & FVG Zone
On H4, the price is moving within an uptrend channel, with the support trendline respected multiple times since the end of last month.
Above is the descending trendline connecting the nearest peaks, creating a price compression zone as the market approaches the 4,133–4,150 area. This is a confluence resistance zone:
The nearest swing high.
H4 supply zone.
Intersection with the descending trendline.
Notable price zones:
Resistance: 4,133–4,150 – a zone that may trigger short-term profit-taking and create a correction.
Near support/FVG: 4,078–4,080 – FVG zone combined with support after the previous breakout.
Psychological support: 4,000 – if H4 closes below this area, the uptrend structure weakens.
Medium-term reversal level: 3,884 – closing below here opens the risk of shifting entirely to a medium-term downtrend.
V. Trading Plan
Scenario 1 – Buy with the Trend (Priority)
Idea: wait for a shallow pullback to near support in the H4 uptrend channel and then buy.
Entry: 4,111–4,114
SL: 4,005
TP: 4,133 – 4,150 – 4,172 – 4,190
Scenario 2 – Buy Deep at FVG Zone
Idea: if a stronger pullback to FVG 4,078–4,080 occurs, take advantage of the good price zone to buy.
Entry: 4,078–4,080
SL: 4,073
TP: 4,100 – 4,115 – 4,142
VI. Risk Management & Notes
Limit opening new orders at the time of Unemployment Claims announcement due to potential volatility and spread widening.
If H4 closes below 4,000, reassess all current buy positions.
If H4/Daily closes below 3,884, consider the medium-term uptrend structure broken; prioritize staying out to observe or wait for a new downtrend scenario instead of continuing to look for buying points.

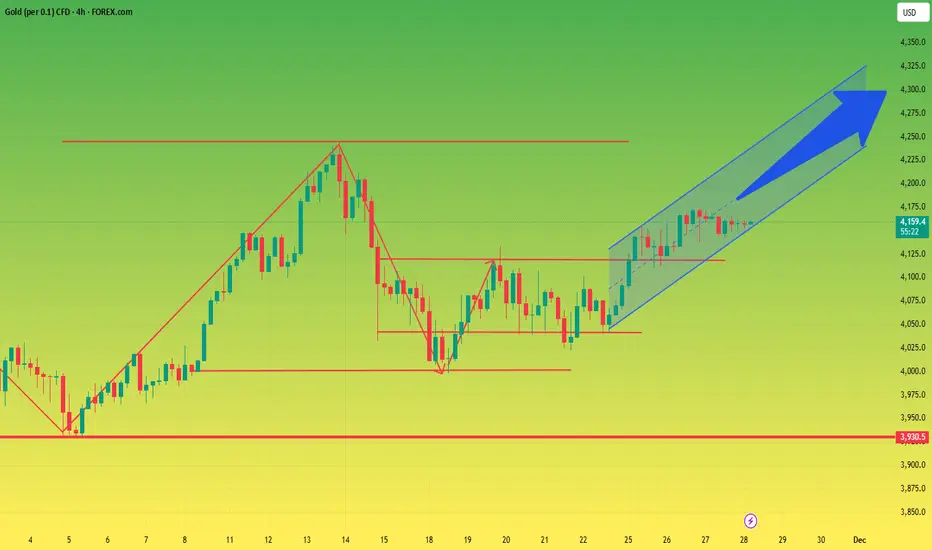
XAUUSD - buy gold...XAUUSD was recently in a short term downtrend for a few weeks but has now shown some clear bullish movements ahead. XAUUSD (Gold) has broken out of a downward trend channel that was acting as strong resistance, The price is very likely to head to the next strong resistance level which is marked as the take profit zone (green line). Time to buy GOLD!

ZakopiecFX GOLD XAUUSD TodayXAU/USD Gold Analysis - December 3, 2024
Current Price: Around $2,626-2,630
Intraday Range: $2,606 - $2,656
Technical Analysis
Bearish Signals:
Technical patterns show an Evening Star reversal formation near the resistance level around $2,655, along with a Hanging Man pattern around $2,630, both suggesting a potential price reversal. The MACD indicator has crossed below the signal line and is declining in negative territory, indicating fading bullish momentum. The RSI is also declining around 57, suggesting potential downward movement.
Key Support Levels:
$2,602
$2,557
$2,514
$2,460
$2,406
$2,352
$2,294
$2,220
Key Resistance Levels:
$2,645-$2,650 represents a strong barrier
Further resistance at $2,664-$2,665
$2,677-$2,678
Trading Scenarios
Base Scenario (Bearish):
Short positions below $2,602 with targets at $2,557, $2,514, and lower levels. Stop loss should be placed around $2,630.
Alternative Scenario (Bullish):
Long positions above $2,655 on increased volume, targeting $2,714, $2,774, $2,841, and higher levels. Stop loss around $2,630.
Fundamental Factors
Market Drivers:
Growing expectations of a Federal Reserve interest rate cut in December are supporting gold prices
Markets are pricing in approximately 64% chance of a December Fed rate cut
Geopolitical uncertainties and central bank demand continue supporting the precious metal
Upcoming Events:
Today: November services PMI data
Dec 4: Initial jobless claims
Dec 10: US CPI data and Fed interest rate decision
Market Sentiment
Gold is consolidating near current levels with mixed signals. While technical indicators suggest potential downside pressure in the short term, strong fundamental support from Fed rate cut expectations and safe-haven demand could limit significant declines. The market is showing uncertainty, with key moving averages near current price levels suggesting a decision point is approaching.
Trading Recommendation: Wait for a clear break above $2,655 for bullish continuation or below $2,602 for bearish movement before entering positions. Given the mixed signals, risk management is crucial.
DISCLAIMER: This analysis is for informational purposes only and should not be considered financial advice. Trading in financial instruments involves significant risk, including the potential loss of principal. Past performance does not guarantee future results. Market conditions can change rapidly, and the information provided may not reflect real-time market movements. Always conduct your own research and consider consulting with a qualified financial advisor before making any investment decisions. The author is not a financial advisor and assumes no responsibility for any investment decisions made based on this analysis.

XAU/USD 02 December 2025 Intraday AnalysisH4 Chart:
-> Swing: Bullish.
-> Internal: Bullish.
Analysis and bias remains the same as analysis dated 20 October 2025.
Price has printed as per previous intraday expectation by printing a bearish CHoCH which indicates, but not confirms, bullish pullback phase initiation.
Price is currently trading within an established internal range, however, I will continue to monitor price with regards to depth of pullback.
Intraday expectation:
Price to continue bearish, react at either discount of 50% internal EQ, or H4 supply zone before targeting weak internal high priced at 4,380.990.
Note:
The Federal Reserve’s sustained dovish stance, coupled with ongoing geopolitical uncertainties, is likely to prolong heightened volatility in the gold market. Given this elevated risk environment, traders should exercise caution and recalibrate risk management strategies to navigate potential price fluctuations effectively.
Additionally, gold pricing remains sensitive to broader macroeconomic developments, including policy decisions under President Trump. Shifts in geopolitical strategy and economic directives could further amplify uncertainty, contributing to market repricing dynamics.
H4 Chart:
M15 Analysis:
-> Swing: Bullish.
-> Internal: Bullish.
Price has printed as per analysis dated 14 November 2025 where I mentioned price to trade down to either discount of 50% internal EQ, or M15 demand zone before targeting weak internal high, priced at 4,245.195.
Price subsequently printed a bearish CHoCH, however, as mentioned yesterday, I would closely monitor price with respect to depth of pullback.
Price did not pull back with any significance, therefore, I will apply discretion and not classify an iBOS. I have marked this with red dotted and dashed lines.
Price has since printed another bearish CHoCH.
We are currently trading within an established internal range, however, as per yesterday, I will continue to monitor price with respect to depth of pullback.
Intraday expectation:
Price to trade down to either discount of 50% internal EQ, or M15 demand zone before targeting weak internal high, priced at 4,264.700.
Note:
Gold remains highly volatile amid the Federal Reserve's continued dovish stance, persistent and escalating geopolitical uncertainties. Traders should implement robust risk management strategies and remain vigilant, as price swings may become more pronounced in this elevated volatility environment.
Additionally, President Trump’s tariff announcements, particularly against China, are expected to further amplify market turbulence, potentially triggering sharp price fluctuations and whipsaws.
M15 Chart:

Gold Trade Set Up Dec 1 2025Gold remains bullish making HH/Hl on the 1h and 4h but i want to see internal 5m-15m structure play out first before looking to take buys towards BSL

GOLD Bullish Bias!
HI,Traders !
#GOLD is making a bullish
Rebound from the support
Cluster of rising and horizontal
Support levels so as Gold is
Trading in an uptrend we are bullish
Biased and we will be expecting
A further bullish move up !
Comment and subscribe to help us grow !

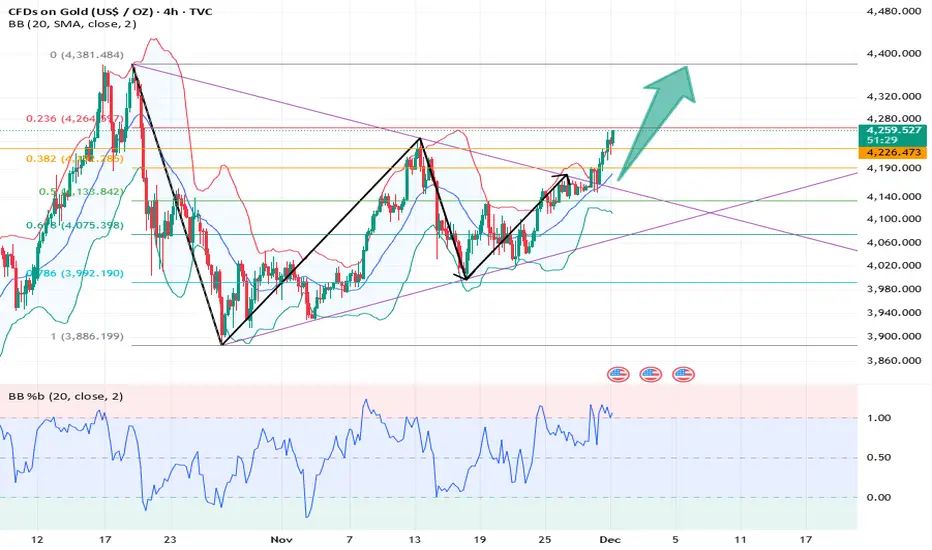
Gold (XAU/USD) – Smart Money & Fibonacci Key Levels AnalysisThis chart highlights potential short and sell opportunities on Gold (XAU/USD) using Smart Money concepts and Fibonacci retracement/extension levels. Key levels are marked for:
Short entries: 4,252.44
Sell opportunity: 4,239.85
Smart Money Footprint: 4,225.57
Stop Loss: 4,271.57
Target levels are based on Fibonacci expansions (127%, 150%, 161%, 200%, 250%, 261%, 361%, 414%), showing areas where price might react or reverse.
This setup combines price action reversal signals with structural levels to identify high-probability trades and manage risk efficiently.

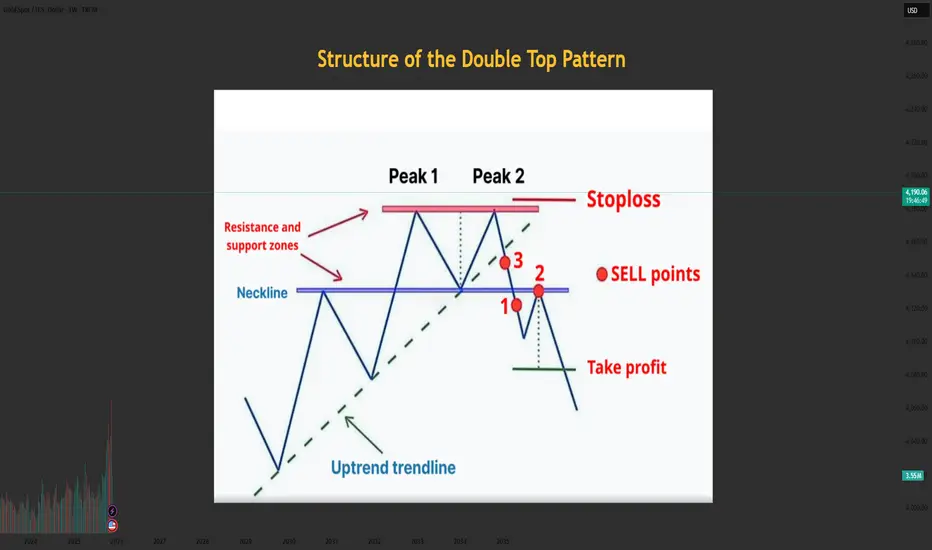
Structure of the Double Top PatternStructure of the Double Top Pattern
The Double Top consists of three main components:
1. First Top
- Price rises strongly and forms the first peak.
- Then price pulls back → creating the middle low (neckline).
2. Second Top
- Price rallies again but fails to break above the first top.
- This indicates weakening bullish pressure.
3. Neckline Breakout
- When price breaks below the neckline, the pattern is confirmed.
- This is the safest SELL entry.
Meaning of the Double Top Pattern
- Buying pressure weakens after the second top is formed.
- Sellers begin to dominate.
- Once the neckline is broken → a new downtrend begins.
- It is considered a strong and reliable reversal pattern when it forms after a clear uptrend.
Conditions for a Valid & High-Quality Double Top
✔️ The prior trend must be strongly bullish
✔️ Both tops should be approximately equal in height
✔️ Volume is usually higher on the first top and lower on the second
✔️ A strong neckline break with high volume → solid confirmation
How to Trade the Double Top Pattern
1. SELL Entry
Enter when price breaks the neckline and retests it.
✔️ The safest entry: SELL on the neckline retest → higher probability.
2. Stop Loss Placement
- Place SL slightly above the second top (or the first top).
- SL should be placed outside the structure to avoid false breakouts.
3. Take Profit (TP)
- How to estimate the target:
- Measure the distance from the top to the neckline, then project it downward.
Tips to Avoid Getting Trapped by a Double Top
1. Do NOT SELL just because price forms the second top → not confirmed yet
2. Only SELL when the neckline is clearly broken
3. Check volume or candle strength to increase accuracy
4. Combine with RSI, FVG, Trendline, Liquidity concepts for higher probability
Don’t forget to like and share your thoughts in the comments! ❤️❤️❤️
Long GOLD / XAUWealth effect ?
Strong economy
Xau is preventing to have reaction against negative fundamental factors.
It has shaped a good breakout structure in daily to see an ATH sooner or later despite almost all the thoughts in next weeks ahead

XAU/USD: Gold Stagnates, Poised for a Strong Surge📊 Market Structure
Gold is moving in a tight accumulation phase (compression) between two important zones:
• OB Support: 4,130 – 4,126
• Resistance – Small Supply: 4,148 – 4,166
The previous trend remains a strong uptrend (clear BoS sequence from 4,089), and currently, the price is retesting the newly formed peak-bottom structure.
The BUY side is still in control as long as the price stays above:
• 4,130 – Main OB Support
• 4,104 – Discount FVG
• 4,089 – Key Low Confirming Trend
If gold holds these zones, the next targets will be the upper liquidity levels:
• 4,166
• 4,181
• 4,207
• 4,243
💎 Key Technical Zones
• OB Support 1: 4,130 – 4,126
• FVG Zone: 4,104 – 4,089 (best discount)
• Deep Bearish OB: 4,060 – 4,045 (if price drops sharply)
• Upper Liquidity Targets: 4,166 → 4,181 → 4,207 → 4,243
🎯 Trading Plan (Priority BUY)
1️⃣ BUY 1 – Retest OB 4,130
When the price touches the OB support zone 4,130 – 4,126 and shows a bounce signal (rejection / engulfing).
• Entry: 4,130 – 4,126
• SL: below 4,115
• TP1: 4,166
• TP2: 4,181
• TP3: 4,207
• TP4: 4,243
→ Quick setup, good RR, trend aligned.
2️⃣ BUY 2 – Discount FVG 4,104 – 4,089
This is the best BUY zone if the market drops sharply before rising.
• Entry: 4,104 – 4,089
• SL: 4,070
• TP1: 4,166
• TP2: 4,181
• TP3: 4,207
• TP4: 4,243
→ Strong confluence: FVG + fibo discount + key liquidity.
3️⃣ BUY 3 – Deep Accumulation at Bearish OB Shift
• Entry: 4,060 – 4,045
• SL: 4,020
• TP: 4,104 → 4,166 → 4,207
→ Only activate if “flush liquidity” appears.
🎯 SELL Scalp (secondary – not priority)
Only SELL when there is a clear rejection reaction at:
• 4,166 – first liquidity sweep zone
• 4,181 – strong reaction zone
• 4,207 – main bearish OB
• 4,243 – large liquidity peak
• SL: 10–15 USD
• TP: 4,148 → 4,130
→ For scalpers only, not a main setup.
🧠 Vincent’s View
The market structure remains completely bullish. The market is accumulating energy in a narrow range before breaking strongly to the upper liquidity targets.
As long as gold stays above 4,089 – the uptrend remains dominant.
“Patience builds the entry – liquidity completes the move.” ⚜️
⏰ Timeframe: 1H
✍️ Analysis by: Captain Vincent

XAUUSD – Gold scenario awaiting trend confirmation at the 4...XAUUSD – Gold scenario awaiting trend confirmation at the 4,160–4,170 zone
Currently, gold has not shown a clear enough medium-term trend. The price is fluctuating around an important resistance zone, so instead of predicting the market, I wait for price reactions at key zones before making a decision.
Today's main axis is the 4,160–4,170 zone – where the market will choose to continue the upward trend or start a deeper correction.
🎯 Scenario 1 – SELL AT RESISTANCE 4,162–4,165 (PREFERRED IF NO CLEAR BREAKOUT)
Sell: 4,162 – 4,165
SL: 4,173
TP: 4,140 – 4,122 – 4,110 – 4,100
The 4,162–4,165 zone on H1 is resistance coinciding with fibo + supply zone near the old peak, also close to the short-term uptrend line.
If the price hits this zone and shows signs of weakening (upper shadow, reversal candle, unsupported volume), I prefer to sell short down to the 4,140 zone, deeper possibly to the liquidity cluster around 4,110–4,100 as shown on the chart.
The risk for this scenario is limited to 1–2% of the account, absolutely no holding the order if the price closes above 4,173.
⭐️ Scenario 2 – BUY WHEN PRICE BREAKS THE PEAK, CONFIRMING CONTINUATION OF THE UPWARD TREND
Buy: 4,171 – 4,173 (after clearly breaking the old peak)
SL: 4,163
TP: 4,188 – 4,200 – 4,215
In case the price decisively breaks the 4,170 zone and holds above it, this is a signal confirming the buyers continue to control. At that time, I switch bias to buy according to the breakout, targeting the higher resistance zone around 4,200–4,215, further expansion possible if the upward momentum is maintained.
Note: only Buy when the breakout is real – large body candle, closing above the 4,170 zone, not a stop sweep then sharply pulling back down.
1. Basic context
The DXY index is slipping below the 99.50 mark, currently around 99.45, indicating continued downward pressure as the market increases expectations for the Fed to cut interest rates in December.
General monetary easing expectations support gold, as the opportunity cost of holding gold decreases.
However, initial US jobless claims have fallen to the lowest level since April, indicating the labor market is still quite strong. This may cause investors to struggle between expectations of rate cuts and the actual strength of the US economy, creating "jerky" fluctuations around news release times.
In summary, the fundamentals are slightly leaning towards supporting gold, but not enough to completely ignore technical adjustments.
2. Technical analysis & price structure
On the H1 frame, after the recent strong increase, gold is creating an accumulation zone just below the 4,160–4,170 resistance.
The 4,162–4,165 zone is a confluence area: horizontal resistance + old supply zone + price zone where strong selling pressure previously appeared.
The 4,140 zone is the "confirmation of adjustment decrease" threshold – if breached and the price closes below here, the market is likely to want to return to the large liquidity cluster around 4,110–4,100, where many Buy stop losses are waiting.
Therefore, the current structure allows for two-way trading, but each scenario requires clear confirmation from price behavior at the 4,160–4,170 zone before entering an order.
3. Market sentiment & action plan
Both buyers and sellers are looking at the same price zone – 4,160–4,170. This makes this area likely to become a thick liquidity zone, where stops from both sides can be "swept" before the market chooses the real direction.
If the price drops sharply from this zone, it is likely a sell-off phase of late Buy orders near the peak.
Conversely, if buyers are strong enough to keep the price above 4,170, many Sell orders will be trapped, creating momentum for a short squeeze to higher resistance zones.
My plan:
Do not enter orders in the middle of the zone, only wait:
Sell at 4,162–4,165 if clear reversal signals appear.
Buy at 4,171–4,173 after the price breaks the peak and holds above this zone.
Always set a hard SL, do not widen the stop when the order goes against.
If the price strongly breaks both scenario zones without giving clear signals, I accept to stay out, wait for a new structure, do not try to "guess the direction".
I always read feedback to optimize sharing in future posts.
