Going Short On Gold. On my School Fees!Today gold has shown clear bearish pressure. Traders who were focused on bullish structures or planning to buy have mostly been taken out of their positions as price swept those zones. With this current sentiment, gold is still very likely to keep pushing lower. Price continues to form fresh lower lows and many of the previous highs on the five minute chart have already been mitigated, reducing the chances of any meaningful bullish recovery for now.
Trade ideas

GOLD (XAUUSD) – Still in Control of Bulls!GOLD (XAUUSD) – Still in Control of Bulls, But Monday Re-Open Play First
After a monster rally from the October lows (~3500 → 4220+), gold is now kissing the upper red descending resistance on the daily chart while sitting on the blue rising trendline support.
Key observations:
Daily close Friday ~4215–4220 region (overbought RSI + divergence)
Strong supply zone 4230–4240 (multiple rejections)
Immediate demand cluster 4140–4150 (0.618 retracement + previous swing lows + channel midline)
Deeper weekly demand 4099–4050 still intact as major support
My plan for next week (Dec 1–5):
Short the re-open / early week push toward 4230–4240
→ Targets: 4140 (first), 4130 (full)
→ Stop: 4242 (above supply)
Flip long on any flush into 4140–4150 zone
→ Targets: 4200 → 4250 → 4300+
→ Stop: 4128
Bias: Short-term tactical short for 80–100 pips, then aggressive long.
Overall trend remains strongly bullish as long as 4050 holds. Central banks + rate-cut bets + seasonal Indian demand = dips are for buying in this 2025–2026 supercycle.
Risk 0.5–1 % per leg, scaling out on the way.
What do you think bulls or bears first on Monday? Drop your thoughts!
#XAUUSD #Gold #TradingPlan #SwingTrading

Gold (XAUUSD)THIS IS NOT financial advice. For informational purposes only.
Trade Idea: Bullish Bias on Gold
Gold continues to display strong upward momentum, supported by multiple technical confirmations. The recent clean break above the 4140 level has opened the path for additional bullish pressure. This breakout not only signals strong buying interest, but also reinforces higher-timeframe bullish structure.
As long as price holds above the breakout zone, the following upside targets remain in focus:
4280 – first immediate resistance and a logical short-term objective.
4380 – secondary target aligned with the next major liquidity pocket.
4800 – extended target if bullish momentum accelerates and broader market conditions remain supportive.
A sustained hold above 4140, paired with strong momentum and continuation signals, favors a bullish continuation scenario. Always manage risk appropriately and consider your own analysis before taking any action.

XAUUSD – LANA AWAITS CONTINUED BUYING IN THE UPWARD PRICE ...XAUUSD – LANA AWAITS CONTINUED BUYING IN THE UPWARD PRICE CHANNEL
1. Fundamental Analysis
Gold is maintaining its upward momentum as investors continue to monitor the Russia-Ukraine tensions and the conflicting peace signals.
President Putin's statements suggest that peace proposals could be the foundation for an agreement, but Russia is still ready to continue fighting if conditions are not suitable. This scenario creates a mixed risk state, reducing the short-term demand for safe havens while retaining geopolitical uncertainty that could pressure the USD in the medium term.
In this context, Lana prioritizes the scenario where gold continues in an upward trend, taking advantage of technical corrections to large liquidity areas to find opportunities to buy with the trend, rather than FOMO at high prices.
2. Technical Analysis
On the H1 chart, XAUUSD is moving in a clear upward price channel, currently near the channel's average line. The main trend remains upward, with no signals of structural break.
After a strong bullish candle, the market left a Strong Liquidity area just below, also creating a Gap below the channel – this is the area where Lana expects the price to return for a test before continuing upward.
The Buy zone coincides with the strong liquidity area around 4,166–4,167 (near the lower boundary of the price channel), suitable for a strategy of waiting for a correction and then buying continuation.
Using Fibonacci extension, key levels:
1.618: around the current price area – a temporary pause and accumulation zone.
2.618: area 4,210 – where Lana marks as Sell scalping for a short correction.
3.618: around 4,235 – 4,237 – a stronger Sell zone, likely to see significant profit-taking.
Level 4,155 is a critical boundary: if the price breaks down and holds below this area, Lana will stop prioritizing the long-term buying scenario, as the upward channel structure risks being broken.
3. Price Levels to Watch
Support / Buy zone & strong liquidity:
4,166 – 4,167 (near the middle line descending to the lower boundary of the channel)
The area around 4,155 is the boundary for the medium-term upward trend.
Resistance / Fibo extension & Sell zone:
4,210 – 4,213: Sell scalping area according to Fibonacci 2.618.
4,235 – 4,237: Strong Sell zone according to Fibonacci 3.618, near the upper boundary of the price channel.
4. Trading Scenarios
Buy 4166 – 4167
SL: 4160
TP: 4182 – 4195 – 4210 – 4250
Sell 4210 – 4213
SL: 4218
TP: 4200 – 4185 – 4160 – 4145
Sell 4235 – 4237
SL: 4243
TP: 4212 – 4200 – 4185 – 4160
👉 Follow Lana on TradingView to read the earliest articles. 💛


Gold SELL SetupGold has tapped a major supply zone while forming a rising wedge, showing clear bullish exhaustion. Rejection from this zone signals a potential reversal. If price fails to break above the resistance, a sharp downside move is expected once the wedge breaks.
selling at 4205 level with reversal confirmation
TVC:GOLD

Continue to buy gold after the market opens!After a steady rise this week, gold prices have been consolidating near resistance levels, with trading range narrowing. As market expectations rise for another Fed rate cut in December, coupled with increased anticipation of regional peace negotiations, global market sentiment has become more optimistic, prompting some funds to flow from gold into risk assets. The US economic data released this week were mixed, but overall did not change the market's judgment on the Fed's policy path. The cross-cutting performance of economic data reinforced market expectations of further Fed rate cuts in December, causing the dollar index to fall to a one-week low and continuing to be a significant supporting factor for gold.
From the combined perspective of interest rate expectations, dollar performance, and technical structure, this round of gains is very healthy. If subsequent economic data continues to support rate cut expectations, gold still has the potential to resume its upward trend after a pullback to key support. However, it should be noted that repeated fluctuations in the expected peace negotiations could bring additional volatility.
In terms of strategy, we can continue to maintain a buy-on-dips approach! After the market opens, you can buy in batches in the 4125-4150 range, with the first target at 4165. If it successfully breaks through 4170, the upside potential will be further opened up, and it is expected that the stalemate will be broken on Friday.
The above represents only my personal thoughts. If you find it helpful, please like and follow to show your support! Please note that any strategy is time-sensitive, and strategies will change as market conditions evolve. I will notify you in the channel based on the actual market situation!

Lingrid | GOLD Possible Long Opportunity At Channel FloorOANDA:XAUUSD perfectly played out in my previous idea. Price is pulling back toward the key 4,000 support zone after failing to hold above the mid-range level near 4,130, where sellers re-entered the market. The structure still respects the ascending trendline, forming a sequence of higher lows that keeps the broader bullish outlook intact. If buyers defend the 4,000–4,025 zone again, a rebound toward 4,145 becomes the primary scenario as demand builds at trendline support. The broader momentum continues to favor upside continuation as long as the higher-low structure remains unbroken.
⚠️ Risks:
A decisive break below 4,000 may trigger deeper downside toward 3,892.
Strong USD momentum could suppress bullish attempts and delay any rebound.
Failure to form a clean rejection candle at support may signal ongoing consolidation instead of a renewed rally.
If this idea resonates with you or you have your own opinion, traders, hit the comments. I’m excited to read your thoughts!

XAU/USD) Bullish trend analysis Read The captionSMC Trading point update
Technical analysis of (XAUUSD) – Bullish Reversal Setup from Demand Zone
1. Key Zone: Strong Demand / Rejection Area
Price has reacted multiple times inside the blue demand zone (around 4040–4035).
This zone aligns with Fibonacci levels (0.705–0.79), strengthening the bullish probability.
Each touch shows buyers stepping in (long wicks + strong rejections).
2. Falling Wedge Breakout
A falling wedge pattern has been broken to the upside.
Price retested the wedge but dropped again to retest deeper inside the demand zone.
A bullish continuation is expected after one more dip into the zone (green arrow).
3. EMAs: Bullish Confluence
EMA 50 and EMA 200 are close, tightening and suggesting a potential trend shift.
Price is expected to bounce off the demand zone and climb above EMAs.
4. Projected Move
After tapping the demand zone, price is expected to:
Break above recent structure highs
Build bullish momentum toward the target point: 4,143.06
SMC Trading point
5. Overall Idea
This setup indicates a bullish continuation forming after a correction.
The blue zone is the high-probability buy zone, and the projected path suggests a move toward 4143 after confirmation.
---
please support boost 🚀 this analysis

XAUUSD – LANA WATCHES FOR BUY WAVE 5, SKIPS SELL ORDERS ON 03/12XAUUSD – LANA WATCHES FOR BUY WAVE 5, SKIPS SELL ORDERS ON 03/12
1. Quick Summary
Main View: H2 – H4
Data: TPO, Footprint, Elliott wave, futures/options
Idea: Today Lana prioritizes BUY with wave 5, skips Sell orders.
Lana's focus area: buy timing 4190–4194, SL 4185, TP according to wave 5 peak around 4315.
2. Futures & Market Profile Data
1. US Session TPO – “Thin” Pattern
Last night's TPO formed a Thin Profile, often appearing after strong shakeouts in an uptrend.
VA was accepted at a low area but the Market didn't spend much time here, the upper auction areas are still incomplete → high probability of price returning to test these levels.
2. Footprint – Trap Sell with Strong Delta
On the H1 candle, Footprint recorded a Trap Sell with Delta ~ -1113 contracts.
The Sell side tried to push the price down but was completely absorbed, the candle bottom became an area with a large number of trapped Sell orders.
Lana sees this as a sign: Smart money is accumulating, shaking off weak Buy positions, and collecting more FOMO Sell bottoms.
3. Elliott Wave & Key Price Areas
The raw chart according to Elliott wave is still following the scenario Lana shared earlier this week:
Monday: confirmed the up wave scenario.
Tuesday: wave 4 correction, short Sell opportunity.
Wednesday (today): waiting for wave 5 to rise, Lana prioritizes Buying.
Buy timing area 4190–4194 coincides with the nearest swing bottom and accumulation area – strong liquidity.
Ideal TP: Minimum: current wave 5 peak.
If the wave expands nicely: around 4315, or higher are the Liquidity clusters 4250–4260 and 4365–4370 as on the H4/H2 chart.
4. Trading Scenario
⭐️ Priority Scenario – ONLY BUY
Buy: 4190 – 4194
SL: 4185
TP: Near the current wave 5 peak
Far: around 4315 (everyone can split profits according to their personal plan)
During the day, Lana does not encourage selling against the trend.
This is Lana's personal perspective based on TPO, Footprint, and Elliott wave.
👉 Follow Lana on TradingView for the earliest updates

gold still on sell reverse#XAUUSD now we await price to breakout between the rectangle on 2 times breakout to sell. Price need to retest back below 4192 for buy reverse.
Sell limit 4226-4229 2 times breakout, target 4192, SL 4240.
Above 4244 still holds sell decline, below 4192 will start new formation on gold buy.

ChatGPT đã nói: Gold May Climb on a Weaker USD and Fed Cut Hope📊 Market Overview:
• Spot gold is currently trading around $4,224.65/oz.
• The bullish momentum is supported by expectations of Fed rate cuts, a weaker USD, and renewed safe-haven demand.
• Market sentiment remains “risk-off,” making gold a preferred defensive asset.
📉 Technical Analysis:
• Key resistance: $4,270–4,280
• Strong resistance: $4,300
• Nearest support: $4,200
• Strong support: $4,155–4,160
• EMA: Price is holding above the EMA → bullish trend remains intact.
• Candlestick / momentum: Upward momentum is stable with no strong reversal signals. A breakout above 4,280 may push gold toward 4,300.
📌 Outlook:
Gold is likely to continue rising in the short term if USD weakness persists and Fed rate-cut expectations remain firm.
However, strong US economic data that lifts bond yields could pull gold back to 4,200 or even the strong support at 4,155–4,160.
💡 Trading Strategy:
🔺 BUY XAU/USD: 4,155–4,158
🎯 TP: 40 / 80 / 200 pips
❌ SL: 4,152
🔻 SELL XAU/USD: 4,303–4,306
🎯 TP: 40 / 80 / 200 pips
❌ SL: 4,309

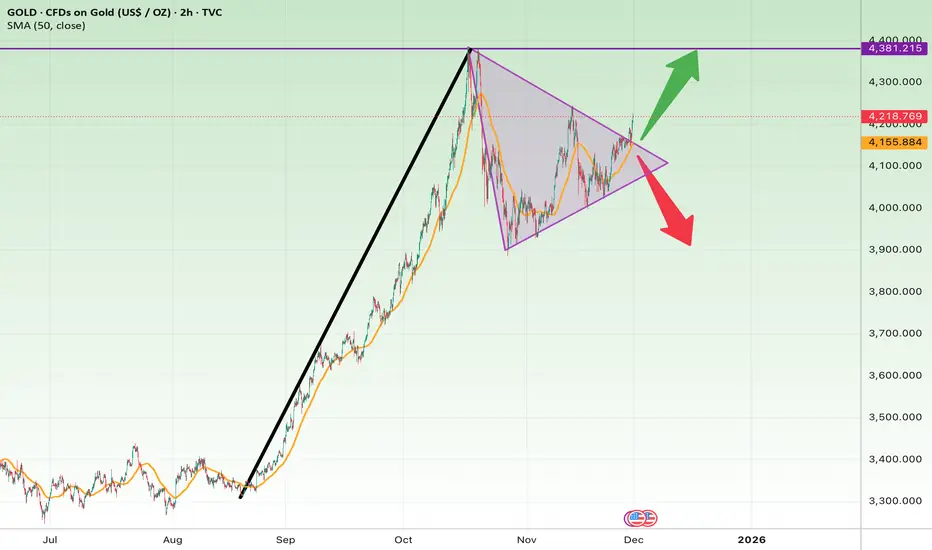
Gold Is Coiling for a Big Move — Triangle Breakout Incoming?Gold has formed a symmetrical triangle after a strong vertical rally.
Price is currently breaking out of the upper triangle boundary, which can signal continuation of the larger bullish trend.
Bullish Scenario (Confirmed breakout)
Upside Targets:
• 4320
• 4380 (major resistance)
• 4450 if momentum expands
Bearish Scenario (Failed breakout / breakdown)
Downside Targets:
• 4050
• 3950
• 3850 (major structural support)
Stop Loss
• Long: below 4160
• Short: above 4230
Gold market Structural Correction in PlayThe gold market reacted firmly at 4190’s, yet underlying imbalances between 4120 and 4090 remain unmitigated. This unresolved liquidity suggests a potential corrective sweep into these zones before bullish momentum can fully re-establish dominance.
Additionally, gold has now broken the bearish trend stance at 4160’s, signalling an early shift in market structure. However, confirmation of bullish continuation will likely depend on how price interacts with the imbalance range below.

US MARKETS CLOSED TODAY - THANKSGIVING🚨 US MARKETS CLOSED TODAY - THANKSGIVING 🦃
Current Price: $4,150 - $4,156 📊
Yesterday's Close: $4,130
Monthly Performance: +3.94% ✅
Yearly Performance: +57.69% 🔥
Status: 🟡 HOLIDAY - THIN TRADING
🎉 MAJOR BULLISH NEWS! DEUTSCHE BANK UPGRADES FORECAST! 📈
BREAKING: Deutsche Bank raised its 2026 gold price forecast to $4,450/oz from $4,000, citing stabilizing investor flows and persistent central bank demand. The bank now expects a $3,950-$4,950 range next year
This is HUGE news for gold bulls! Major institution showing strong confidence in gold's future!
📊 IMPORTANT: TODAY'S MARKET CONDITIONS
🦃 Thanksgiving Holiday Schedule:
Gold will NOT be traded on November 27, 2025 due to U.S. Thanksgiving holiday
What This Means:
❌ US markets CLOSED all day
⚠️ Very thin liquidity globally
⚠️ Wide spreads expected
⚠️ Price gaps possible
✅ Good time to review positions
Friday (Nov 28):
Markets open but shortened hours
Very low volume expected (Black Friday)
Many traders still on holiday
💎 DEUTSCHE BANK FORECAST DETAILS
The Upgrade:
Deutsche Bank's new average forecast for 2026 stands at $4,450/oz, up from previous $4,000/oz. Bank anticipates gold to trade within range of $3,950 to $4,950 per ounce in 2026, with possible high near $4,950/oz - approximately 14% above current December 2026 futures prices
Why They're Bullish:
Key drivers: resilient investor demand, strong central-bank buying, limited supply response. Third-quarter supply-demand data supports continued central bank bid, with inelastic demand from central banks and ETF investment diverting supply from jewelry market. Overall growth in demand outpaces supply
Gold's unusually wide trading range in 2025—the largest since 1980—underpins constructive outlook for 2026
📈 CURRENT TECHNICAL ANALYSIS
Market Structure: BULLISH CONSOLIDATION 🟢
Gold trading near two-week highs above $4,170 after recent rally. Consolidating gains before next move.
Key Development:
Gold shrugging off Tuesday's small dip and pushing to multi-day highs above $4,170 per troy ounce. Move higher comes as US Dollar loses steam, even though US Treasury yields trying to rebound
Support Levels 🔵
Support 1: $4,130 - $4,140 (Yesterday's close - Immediate)
Support 2: $4,059 - $4,100 (Strong zone)
Support 3: $3,977 (55-day SMA)
Support 4: $3,886 (October 28 low)
Support 5: $3,750 (50% Fib retracement)
Resistance Levels 🔴
Resistance 1: $4,170 - $4,173 (Current highs)
Resistance 2: $4,245 (November 13 peak)
Resistance 3: $4,254 - $4,280 (Major barrier)
Resistance 4: $4,380 - $4,381 (All-time high - October 17)
📊 TECHNICAL INDICATORS
RSI: Heading toward 60 (Bullish momentum building) 🟢
ADX: Holding above 19 (Trend slowly gaining strength) ✅
Moving Averages: All pointing UP - Bullish alignment ✅
For now, momentum still leans bullish: Relative Strength Index heading toward 60, and with Average Directional Index holding above 19, underlying trend looks like it's slowly gaining strength
🎯 TRADING STRATEGY FOR THANKSGIVING WEEK
TODAY (Wednesday - Thanksgiving):
⚠️ DO NOT TRADE!
Reasons:
Markets closed
Zero liquidity
No meaningful price discovery
High risk of gaps
Best Action:
Review your positions
Plan for Friday/next week
Take the day off!
FRIDAY (Black Friday - Nov 28):
Trade with EXTREME Caution!
On November 28, XAUUSD may continue to rise, but price reversal still possible. Key support and resistance levels expected at $4,059.90 and $4,254.97
Strategy:
Wait for normal hours to resume
Use smaller position sizes
Expect wider spreads
Watch for gaps from Thursday close
NEXT WEEK (December Trading):
Back to Normal - Key Levels:
BULLISH Scenario (65%):
IF holds above $4,130-$4,140
Target: $4,245 → $4,280 → $4,380
Entry: Pullback to $4,140-$4,150
BEARISH Scenario (35%):
IF breaks below $4,100
Target: $4,060 → $3,977
Entry: Break and retest of $4,100
🌍 FUNDAMENTAL OUTLOOK
BULLISH FACTORS ⬆️⬆️⬆️
✅ Deutsche Bank Upgrade - Major vote of confidence!
✅ Analysts predict gold may reach $4,456-$4,509 by end of November
✅ Central banks purchased 634 tonnes YTD, WGC expects 750-900 tonnes for 2025
✅ Fed Rate Cut Expected - December odds rising
✅ Dollar Weakness - DXY losing momentum
✅ Demand > Supply - Structural bull market
✅ ETF Inflows - First net buying in 4 years
✅ Geopolitical Tensions - Safe-haven support
Key Quote:
Central banks planning record high gold allocations. Gold positioned as "ultimate protection against black swan tail risk events." ETFs returned to net accumulation in 2025 after four years of outflows
Risk Factors ⬇️
⚠️ Profit Taking - After 57% yearly gain
⚠️ Technical Overbought - Short-term
⚠️ Holiday Volatility - Thin markets
⚠️ Strong US Data - Could delay Fed cuts
💡 WEEK RECAP & OUTLOOK
This Week's Performance:
Current XAU/USD exchange rate: $4,155.98. Over past year, XAU/USD changed by 57.69%, trading within 52-week range of $2,583.49 to $4,381.60
Gold rose to $4,138.45 on November 25, up 0.07% from previous day. Over past month, gold's price risen 3.94%, up 57.22% compared to same time last year
November Performance:
✅ Recovered from $3,886 low
✅ Now at $4,150+ (Multi-week highs)
✅ +3.94% for the month
✅ On track for analysts' $4,456-$4,509 target
🔮 FORECAST & TARGETS
End of November (3 Days):
Expected: $4,200-$4,300 range
Target hit probability: 70%
December 2025:
Range: $4,150-$4,400
Target: Retest all-time high $4,381
2026 Targets (Deutsche Bank):
Average: $4,450/oz
Range: $3,950-$4,950
Potential High: $4,950 (+19% from current)
Long-term (Other Analysts):
Some forecasts: $5,000+ by late 2026
Ultra-bullish: $6,000+ by 2027-2028
🏆 PROFESSIONAL ANALYSIS SUMMARY
Gold is in a STRONG POSITION entering the holiday period. The Deutsche Bank upgrade is a major institutional endorsement of the bull market.
The Big Picture:
Technical: Bullish trend intact, consolidating at highs
Fundamental: Demand > Supply, Central bank buying strong
Sentiment: Major banks turning more bullish
Positioning: Healthy after recent consolidation
Key Insight:
Gold's upward trajectory is structurally supported rather than merely cyclical
This means the rally has LEGS - it's not just speculation, it's backed by real supply/demand fundamentals!
💪 TRADING PSYCHOLOGY - HOLIDAY EDITION
Take a Break!
Markets are closed, you should be too! Use today to:
Spend time with family 🦃
Review your trading journal
Plan for December
Recharge your mental energy
Remember: The best trade is sometimes NO trade!
🎯 POST-HOLIDAY TRADING PLAN
Friday (Nov 28):
⚠️ Avoid trading (thin liquidity)
Watch for any gaps
Let market settle
Monday (Dec 2):
Resume normal trading
Watch $4,140 support
Target $4,245 if bullish
Key Levels to Watch:
Above $4,170: Bullish → Target $4,245+
Below $4,130: Caution → Support at $4,100
📊 SUPPORT/RESISTANCE SUMMARY
Critical Support: $4,130-$4,140
Strong Support: $4,100, $3,977
Weak Resistance: $4,170, $4,200
Strong Resistance: $4,245, $4,280, $4,380
Breakout Level: $4,245 (Opens $4,380 retest)
Breakdown Level: $4,100 (Triggers correction)
🔔 THANKSGIVING MESSAGE
Happy Thanksgiving! 🦃
Whether you're trading gold or not, take time today to be grateful. The markets will be here tomorrow, next week, and next year. But today is for family, friends, and reflection.
Three Things to Be Grateful For in Trading:
Opportunity - Markets give us chances every day
Learning - Every trade teaches us something
Community - We're all in this together!
Enjoy your day! 🙏
⚠️ FINAL REMINDERS
For Today:
Markets CLOSED ❌
No trading possible
Relax and recharge 🦃
For Friday:
Shortened hours
Very low volume
Trade with extreme caution
Smaller positions
For Next Week:
U.S. third-quarter GDP data may influence gold prices
Back to normal volume
December rate decision approaching
Year-end positioning begins
📈 YEAR-END OUTLOOK
December Catalysts:
Fed rate decision (Dec 17-18)
Year-end positioning
Q4 GDP data
Holiday season (thin trading Dec 24-Jan 1)
2026 Setup:
With Deutsche Bank's $4,450 target and bullish structure, gold entering 2026 with strong momentum!
🦃 Happy Thanksgiving from the Trading Desk!
📱 Enjoy the holiday - markets resume Friday
💎 Stay blessed and grateful
🙏 See you next week for December trading!
#Gold #XAUUSD #Thanksgiving #DeutscheBank #BullMarket #GoldForecast #HappyThanksgiving #MarketHoliday #2026Outlook #TradingBreak

GOLD opened with a significant increaseOANDA:XAUUSD opened the morning of November 26 with a significant gain, following a volatile session yesterday when the market absorbed two conflicting signals: unexpected progress in Russia-Ukraine peace talks and growing expectations that the Federal Reserve will cut interest rates as early as December.
In the European session yesterday, spot gold fell to a daily low of $4,109.47/ounce, as news that Ukraine had “basically” agreed to a US-proposed peace plan boosted global risk appetite. Market sentiment immediately reflected capital flows out of defensive assets.
However, in the New York session, gold reversed sharply, hitting a peak of $4,159.39/ounce, recovering nearly $50 from the previous low. At the end of Tuesday’s session, gold stood at $4,130.76/ounce, down slightly by 0.1%. By this morning, November 26, the price had returned to the $4,164/ounce area, up nearly 1% on the day.
Geopolitics: Peace Signals Weaken Need for Shelter, But Not Enough to Change the Game
Kyiv has agreed in principle to Washington’s peace proposal, according to US and Ukrainian officials. Some sensitive details remain to be worked out, but many contentious points have been tweaked. The Trump administration’s original 28-point plan has been whittled down to 19, with some provisions “at least worth considering,” according to The Washington Post.
Negotiations began in Geneva on November 23, and both Bloomberg and US officials described the process as streamlined to reach a quick deal. President Trump even declared a peace deal “very close.” This news immediately sent gold prices sharply lower yesterday, demonstrating that the market remains sensitive to geopolitical developments, even when peace signals are still preliminary.
Technical analysis and suggestions OANDA:XAUUSD
Gold price maintains the main uptrend on the daily chart, trading around $4,160/oz within the medium-term ascending channel. The price is currently above the short-term MA21 (~4,056) and has bounced from the support zone around Fib 0.382 (≈3.973); RSI is recovering slightly from the neutral zone, indicating weakening selling pressure.
The 4.128 (0.236 Fib) zone is the first short-term resistance; 4.216 is the key resistance that determines the possibility of opening a new bullish cycle (extremely important). If the price holds above 3.972–4.000 and closes sustainably above 4.128, the possibility of continuing to challenge 4.216 → 4.380 increases. Conversely, a break below 3.972 will weaken the bullish structure and open the door to the 3.846 (0.5 Fib) zone or lower.
Macro backdrop: Fed easing expectations and geopolitical risks continue to be the support base; positive news on interest rate cuts will increase the probability of a breakout above the 4.216 resistance.
BUY XAUUSD PRICE 4235 - 4233⚡️
↠↠ Stop Loss 4239
→Take Profit 1 4227
↨
→Take Profit 2 4221
SELL XAUUSD PRICE 4153 - 4155⚡️
↠↠ Stop Loss 4149
→Take Profit 1 4161
↨
→Take Profit 2 4167

Gold: Bullish fundamental trend remains unchangedPolicy Dimension: Rate-Cut Expectations Surge to 89%, Loosening Certainty Strengthened
The probability of a 25-basis-point Fed rate cut in December has soared from 50% a week ago to 89.2%, with major investment banks collectively shifting to the "rate-cut camp." The core support stems from a cooling labor market and dovish signals from officials. New York Fed President John Williams noted that "policy needs to move closer to the neutral range," while rumors that dovish candidate Kevin Hassett is a top contender for the next Fed chair have further reinforced market expectations for prolonged easing .
As a non-interest-bearing asset, gold’s holding costs continue to decline in a low-interest-rate environment. Coupled with U.S. debt concerns and a pullback in the U.S. Dollar Index (falling to a two-week low), policy dividends provide strong support for gold prices. It is worth noting that some investment banks (e.g., Morgan Stanley, Standard Chartered) still hold the view of a "rate-hike pause," leading to potential short-term volatility driven by expectation (gaming) .
Gold is in a critical phase characterized by "white-hot rate-cut expectations + geopolitical risk backstop + technical V-shaped reversal." The short-term core contradiction centers on balancing the "battle for the $4,200 mark" and "pre-meeting fund positioning." On Tuesday, gold experienced a V-shaped reversal—plunging to $4,163 before rebounding to $4,205—with an intraday fluctuation exceeding $40, verifying the resilience of buying interest at lower levels . The fundamental bullish trend remains intact, but volatility is prominent.
The core trading strategy should prioritize "buying on dips while supplementing with position additions on breakthroughs," managing risks based on key support and resistance levels.
Today's Gold Trading Strategy
buy:4190-4200
tp:4210-4230-4260
sl:4180

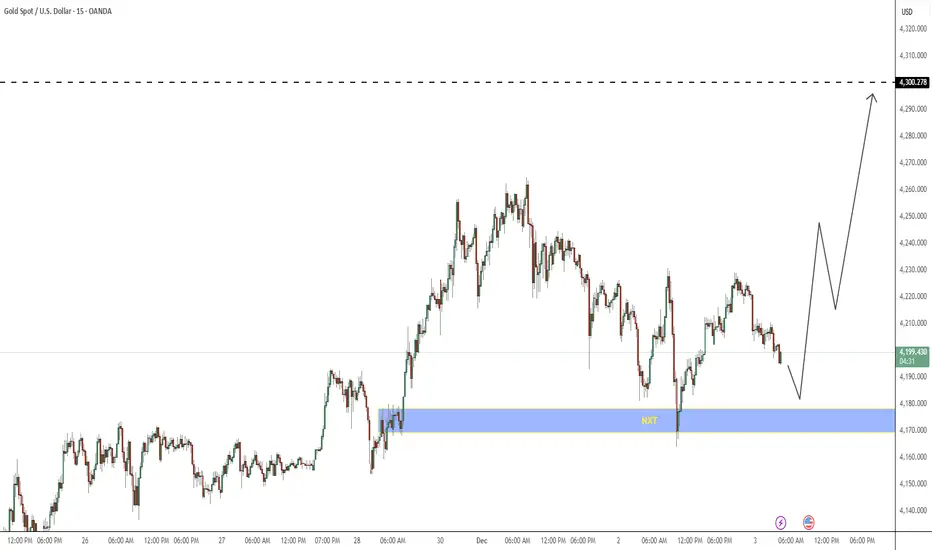
The $4200 Re-Fueling Scenario Before $4300 Blast Off?Market Scenario: Gold is expected to enter a consolidation (ranging) phase between $4170 and $4200 to gather the necessary liquidity and energy.
Bullish Condition: To confirm the move higher, the price must decisively break the $4200 resistance and successfully flip it into support.
Ultimate Target: If the consolidation and breakout are successful, the next target is $4300.
Gold Trading Strategy Within a Range.Yesterday, gold experienced wide-ranging fluctuations, resembling a rollercoaster ride with poor trend continuity. On the daily chart, after retracing to test the 7-day moving average support at 4163, it rallied strongly, rising back above the 5-day moving average at 4200. The short-term 4-hour chart continues its oscillating trend, with the price consolidating around the middle Bollinger Band and the RSI indicator hovering near the midline. On the hourly chart, the Bollinger Bands are gradually narrowing, and the moving averages are closely aligned. Gold is expected to continue its wide-range oscillation today. Short-term trading can focus on buying low and selling high, looking for buying opportunities based on the support levels of 4180/4163.
Gold has now entered a oscillating phase, swinging within a large range. This oscillating trend adds more uncertainty to the upcoming unclear news events. This uncertainty makes both bulls and bears hesitant, requiring patience to wait for further developments in market news. Given the short-term oscillation in gold, it's advisable to avoid buying at highs or selling at lows.
Key Levels:
First Support: 4196, Second Support: 4165, Third Support: 4140
First Resistance: 4230, Second Resistance: 4255, Third Resistance: 4278
Gold Intraday Trading Strategy:
BUY: 4170-4175, SL: 4160, TP: 4190-4200;
SELL: 4235-4240, SL: 4250, TP: 4220-4210;
More Analysis →

XAUUSD Analysis - Trendline Rejection & Potential Bounce Setup📊 XAUUSD 30-Minute Technical Analysis – Trendline Pressure & Key Demand Zone
This 30-minute XAUUSD chart shows gold currently trading under a clear descending trendline, indicating short-term bearish pressure. Price has rejected the trendline multiple times, confirming sellers are still active in the market.
🔻 Current Market Structure
Gold is forming lower highs and lower lows, respecting the downtrend structure. Recent candles show rejection from the trendline once again, suggesting a potential continuation toward the lower support zone.
🟦 Mini Reversal Zone (MRZ)
A key short-term demand area exists between 4,190 – 4,185 (marked in blue).
This zone has previously acted as a minor support, and the price may attempt a temporary bounce from here.
🟩 Major Demand Zone / Volume Burst Area
The stronger reversal area sits below the MRZ, highlighted in green.
This is where the chart indicates:
High buying volume previously entered the market
Bullish reactions were seen earlier
The next impulsive leg may start once price enters this volume burst zone
This zone will be crucial for spotting bullish reversal patterns, such as:
Bullish engulfing
Pin bar / hammer
Break and retest setups
🔍 What We Need
Inside the marked demand zones, we need a positive bullish pattern to confirm buyer strength. Entering without confirmation may be risky due to ongoing trendline resistance.
📉 Expected Price Path
The projected price movement shows:
A drop from current levels toward the MRZ
A potential short pullback
Final sweep into the Volume Burst Zone
A possible bullish reversal from that deeper area
If a strong bullish pattern forms in the green zone, buyers may push back toward the trendline and possibly attempt a breakout.
⚠️ Important Notes
Trendline remains the immediate barrier for buyers
Bearish continuation is possible until the deeper support zone is tested
Only bullish confirmation patterns can validate a reversal
✅ Short Summary (For Minds / Social Posting)
Gold is still under bearish pressure on the 30M chart, moving inside a descending trendline. Price is expected to test the Mini Reversal Zone and possibly drop deeper into the Volume Burst Demand Zone. A bullish reversal is only valid if a strong positive pattern forms in these areas.

XAUUSD: Bearish Correction Targets $3822 amidst Uptrend.Scenario: Bearish Corrective Move within a larger Uptrend.
Current Price (Approx.): $4,218.81
Chart Context: Price has already retraced from the recent high of $4,381.73 and is currently hovering near the 0.236 Fibonacci Retracement ($4,249.74) and above the 0.4 Fibonacci Retracement ($4,158.02).
Key Levels
Key Resistance Zone (Potential Reversal): $4,338 (Close to the recent high/start of the pullback).
Primary Target (Take Profit): $3,822 (Coincides with the 1.0 Fibonacci Retracement level of the structure shown, indicating a full retracement of the move from $3,822.46 to $4,381.73).

short gold I think the retrace will be bigger than initially thought.
let us get ready for some profits.

Gold uptrend rectangleHello guys, we’re looking at a continuous trend from gold. After that surprising downtrend for just a second (4154) we see a positive bullish. Be careful everyone!
