Trade ideas

Gold on buyShiny, timeless, and always in style! ✨
Ready to invest in gold? Now's the perfect time to buy.
Comment below your favorite gold piece or tag a friend who loves it!
XAUUSD Signal📢 New Trading Signal Released
The market is forming a clean structure, with price reaching a key zone that has been on my radar. Current indicators align with the expected move, and volume confirms the potential momentum building in this area.
I will continue to monitor the setup closely and provide updates if market conditions shift.
This is not financial advice—simply my personal market outlook.
🕒 Follow my profile for more signals and real-time analysis.

XAU/USD maintains bullish momentum–waiting for breakout at 4180🌍 Market Overview
Gold is currently trading around 4,170 USD, continuing its strong upward momentum.
Main drivers:
• USD weakness → money flowing into gold
• Falling bond yields
• Softer Fed expectations → higher demand for safe-haven assets
Gold continues to maintain a bullish structure, forming higher highs and higher lows.
________________________________________
📊 Technical Analysis
🔽 Key Support Zones
• 4148 – 4160 (new support after breakout)
• 4128 – 4135 (stronger support if deeper correction occurs)
🔍 Holding above 4148 is crucial to maintain the bullish trend.
🔼 Resistance Zones
• 4180 (near-term resistance – potential rejection)
• 4195 – 4200 (strong psychological resistance)
⚡ Current Momentum
• Price is above all short-term EMAs → BUYers are dominating
• Increasing volume → steady bullish pressure
• No clear reversal signals around 4164 yet
________________________________________
🔎 Outlook
Main trend: BULLISH
Scenarios:
• A pullback to 4148–4160 before rising would be ideal.
• A breakout above 4180 on H1 close → price may extend toward 4200.
• A break below 4148 → deeper correction toward 4135.
🎯 Trade Ideas
🔺 BUY XAU/USD – Trend-Following Setup
• Entry: 4151 – 4148
🎯 TP: 40 / 80 / 200 pips
🛑 SL: 4145
🔻 SELL XAU/USD – Counter-Trend (Only with rejection candles)
• Entry: 4195 – 4198
🎯 TP: 40 / 80 / 200 pips
🛑 SL: 4201

XAUUSD (Gold) Trading Setup - November 26, 2025
🚨 New Trade Alert on GOLD (XAUUSD)! 🚨
Two potential entry strategies from MyShare Finance:
⚡️ BUY SCALP (High Risk) | Logical Entry | SL: 4142
🎯 BUY ZONE (Medium Risk) | Logical Entry | SL: 4124
Timeframe: 15M | Posted: Wed, 26 Nov 2025
#GoldTrading #XAUUSD #TradingSetup #ForexSignals #BuyGold #SwingTrading

Long gold and take a vacation, seems like nobody can stop gold XAUUSD, gold is broken out from the consolidation zone, and Long gold and take a vacation, seems like nobody can stop gold

ElDoradoFx – GOLD ANALYSIS (26/11/2025, ASIA)Gold enters Asia holding above key intraday support after a corrective US move. Price is compressing inside a breakout structure, sitting between liquidity pockets and preparing for a directional expansion. Momentum indicators show early recovery signals, but the session remains sensitive to liquidity sweeps from Tuesday’s volatility.
⸻
📉 Technical Outlook
🔵 D1
• Daily structure remains bullish above 4,022–3,936 demand zone.
• Price is forming higher lows inside a tightening wedge.
• RSI recovering from mid-levels (≈57), indicating potential upside continuation if liquidity allows.
🟣 H1
• Price consolidating between 4,159 high and 4,121 intraday low.
• Rejection from upper trendline + BOS retest confirms Asia range conditions.
• H1 liquidity sits both above 4,142 and below 4,121 → expect stop sweeps before trend direction.
🟢 15M–5M
• Multiple BOS & CHoCH confirming short-term compression.
• Price trading just above 50 EMA & near 200 EMA support at 4,113–4,121.
• Momentum histogram turning positive after London close recovery.
⸻
📐 Fibonacci Golden Zone
Last swing:
Swing High: 4,159
Swing Low: 4,109
Golden Zone: 4,134 – 4,142
(This exact range aligns with current consolidation + liquidity pool.)
⸻
🎯 High Probability Zones
🔻 SELL SETUP (High-Probability Rejection Zone)
• Sell Zone: 4,142 – 4,150
• Confirmation:
• M5/M15 rejection
• Bearish CHoCH ↘
• MACD histogram turning red
• Targets:
• TP1 → 4,127
• TP2 → 4,114
• TP3 → 4,109 (liquidity low)
• Invalidation: Above 4,155
⸻
🔹 BUY SETUP (Strong Demand + Trendline + EMA Confluence)
• Buy Zone: 4,113 – 4,122
• Confirmation:
• Tap into the blue demand zone
• Bullish CHoCH ↗
• MACD shift to green
• Targets:
• TP1 → 4,134
• TP2 → 4,142
• TP3 → 4,150
• Invalidation: Below 4,108
⸻
📌 Breakout Scenarios
🔼 Bullish Breakout
Above 4,150
• Activation target: 4,159
• Expansion target: 4,175 – 4,185
🔽 Bearish Breakout
Below 4,108
• Activation target: 4,095
• Expansion target: 4,070 – 4,060
⸻
📰 Fundamental Watch (Asia)
• Low-impact data during Asia → price may remain technical.
• Market still digesting US Consumer Confidence drop and earlier volatility, meaning liquidity manipulation likely between sessions.
• Watch JPY flows around Tokyo open.
⸻
📌 Key Levels
Resistance: 4,142 • 4,150 • 4,159
Support: 4,121 • 4,114 • 4,109
Golden Zone: 4,134 – 4,142
Breakout Triggers: 4,150 / 4,108
⸻
📈 Summary (Directional Bias)
Asia likely to range inside 4,121–4,142 until liquidity breakout.
Bias remains bullish above 4,121 and bearish below 4,108.
⸻
— ElDoradoFx PREMIUM 3.0 Team 🚀
⸻
🥇 ElDoradoFx PREMIUM 3.0 – PERFORMANCE 25/11/2025 🥇
⚡ Precision. Patience. Profit.
📈 BUY +80 PIPS
📈 BUY +40 PIPS
🕐 SELL LIMIT – Not Activated
📈 BUY +80 PIPS
📉 SELL +40 PIPS
❌ SELL -40 PIPS (SL)
📉 SELL +20 PIPS
📈 BUY +60 PIPS
📉 SELL +20 PIPS
📈 BUY +50 PIPS
📈 BUY +335 PIPS
━━━━━━━━━━━━━━━
💎 SWING TRADES – STILL RUNNING
🔵 BUY → +2,850 PIPS
🟣 BUY → +1,600 PIPS
📊 Long-term positions remain strong with continued bullish momentum.
━━━━━━━━━━━━━━━
💰 TOTAL PIPS GAIN: +705 PIPS
🎯 10 Signals → 9 Wins
🔥 Accuracy: 90%
━━━━━━━━━━━━━━━
👏 Congratulations if you profited — consistent setups, precise entries, and top-tier results again today!
Stay ready for tomorrow’s session — GOLD momentum remains 🔥
— ElDoradoFx PREMIUM 3.0 Team 🚀

XAUUSD – Retest in Progress After Sweep of 4135
Gold pushed into the 4132–4135 liquidity zone and rejected cleanly, pulling back toward the prior breakout area. Price is now retesting structure from above.
Key Points
4135 acted as a liquidity sweep → sharp rejection confirms sellers active there.
Price is currently retesting the 4125–4128 zone.
As long as price holds above 4120, bullish continuation is still valid.
Losing 4120 opens the door back toward 4098 and potentially 4075.
Bullish Scenario
Hold above 4120
Break back over 4135
Targets: 4144 → 4150
Bearish Scenario
Break below 4120
Targets: 4100 → 4075

LiamTrading – XAUUSD H1 | Gold follows the head-and-shoulders...LiamTrading – XAUUSD H1 | Gold follows the head-and-shoulders pattern, watch for a pullback to POC to enter trades
Gold is completing the final upward move of the head-and-shoulders pattern on the H1 timeframe. The price has now reached the Fibonacci zone (combining both retracement and extension), coinciding with the resistance cluster – POC of the Volume Profile, so a tug-of-war reaction is understandable. My plan is to take advantage of this pullback: prioritize short-term buying according to the current wave, then wait to sell at the strong resistance above.
Macroeconomic context
Russia continues to launch missiles into Kyiv right after the US – Ukraine reached a “19-point plan,” causing the prospect of peace talks to fall into a deadlock again.
However, secret negotiations between the US, Russia, and Ukraine in Abu Dhabi are still ongoing, with key terms yet to be finalized.
The situation of “war not stopping – negotiations not finished” keeps global risk sentiment tense, thereby continuing to be a catalyst for the demand to hold gold in the medium and long term. However, in the short term, prices can still fluctuate strongly around important technical zones before choosing a clearer direction.
Technical analysis H1 – Head-and-shoulders pattern, Fibonacci, Volume Profile
The head-and-shoulders pattern has formed quite clearly, the price is currently in the completed upward move of the right shoulder, approaching the upper resistance zone.
The current price zone of gold is:
Touching the Fibonacci retracement of the previous downward move.
Simultaneously coinciding with the Fibonacci extension of the short-term upward wave → reactions and fluctuations are likely to appear.
Below the price, the 4090–4093 zone is a small support/POC zone during the day, where the Volume Profile thickens, suitable for short-term buying according to the current upward trend.
Above, the 4185–4187 cluster is strong resistance:
Confluence of potential right shoulder peak + old supply zone + Fibonacci extension level.
This is the zone I prioritize watching for a SELL when the pattern completes.
Notable support/FVG zones: 4122–4116 (near support), 4169–4210 (FVG/medium-term resistance).
Reference trading scenarios
1. Buy according to the current upward wave (short-term)
Buy: 4091–4093
SL: 4085
TP: 4120 → 4145 → 4170 → 4190 → 4220
Logic: Buy at the confluence support zone + small POC, take advantage of the price push to complete the right shoulder/pattern. When the trade reaches about +1R, move SL to breakeven to protect the account.
2. Sell at head-and-shoulders pattern resistance (medium-term priority)
Sell: 4185–4187
SL: 4193
TP: 4170 → 4155 → 4130 → 4110
Logic: This is a strong resistance zone, coinciding with the peak of the supply zone and Fibonacci extension. Only activate the SELL order when H1/M15 gives a clear rejection signal (pin bar, bearish engulfing, weakening volume) around 4185–4187.
Additional price zones to note
Support – FVG: 4122–4116
Resistance – FVG: 4169–4210
Can be used as a short scalp zone, but the main scenario should still be prioritized:
Buy below 409x when not yet reaching major resistance.
Sell around 418x when the head-and-shoulders pattern shows signs of completion.

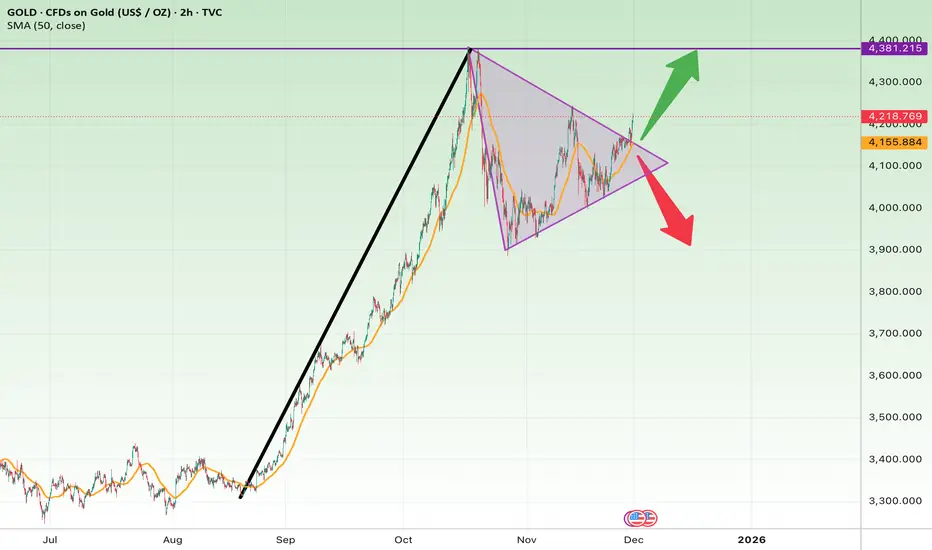
Gold - Triangle Squeeze Before the Next Major MoveGold is currently consolidating inside a symmetrical triangle, right after a massive bullish rally. This compression pattern typically precedes a strong breakout — and based on market structure, the bullish scenario is more probable.
Bullish Scenario (Primary Outlook)
If price breaks above the triangle resistance and confirms:
Targets (Bullish):
$4,250
$4,380
$4,500 (extended target)
Stop Loss (for long position):
• $3,940
(Below triangle support + below 50-day SMA)
Bearish Scenario (Alternative)
If gold loses triangle support:
Targets (Bearish):
$3,950
$3,880
$3,800 (major support)
Stop Loss (for short position):
• $4,120
(Above triangle resistance)
Summary
Gold is tightening inside a symmetrical triangle and preparing for a decisive move.
Trend bias remains bullish, and a breakout could send XAUUSD toward new highs above $4,400.

Gold: Shorts from 4250 Profit — Beware of Shakeouts TodayOn Monday, gold moved higher within a range. It first surged to 4255 but met resistance and pulled back to find support, then consolidated around 4220 before moving upward again. Later, it was once more pressured downward near 4265. Yesterday, I publicly suggested buying below 4220 and watching the resistance near 4250—selling if the structure turned unfavorable. Today, gold pulled back below 4200. After taking profits perfectly during the drop, we executed a new long entry and captured a small gain.
From a technical perspective, based on the triangle breakout projection, the short-term key support zone defining bullish or bearish strength is 4170–4180. Within this zone, the strategy remains to follow the trend and buy. On a larger scale, gold is trading within the 4380–3890 range, which serves as the trend divider: a breakout above 4380 would restart the bullish trend, while a breakdown below 3890 would confirm a bearish trend.
So far, gold has completed its first test of the 4200 area. The short-term pattern continues to reflect a cycle of pushing higher, pulling back, retesting, and repeated consolidation. This level is likely to see more fluctuations. The key focus is whether the market can reclaim 4236–4245 during the next upward move.
Today’s trading plan:
Sell lightly near 4245 on a rebound; if the price breaks strongly, watch the resistance near 4265.
Buy near 4200 on pullbacks; if support breaks, watch the 4179 zone.

Gold prices surged and then retreated, with the market focusing Gold prices surged and then retreated, with the market focusing on Fed rate cut expectations and ISM data.
Market Recap: In late Asian trading on Monday (December 1st), spot gold prices suddenly declined, currently trading around $4220 per ounce, down more than $36 from the earlier intraday high of $4256.51 per ounce. Earlier in the session, gold prices briefly broke through $4250 per ounce, reaching their highest level in six weeks. At the start of the month, gold buyers continued to dominate amid rising market expectations of a Fed rate cut.
Market Focus: Fed Rate Cut Expectations and Economic Data
According to the CME FedWatch tool, the market currently expects an 87% probability of a 25 basis point rate cut by the Fed at its December monetary policy meeting. At 23:00 Beijing time on Monday, the US will release its November ISM Manufacturing PMI, which is expected to decline slightly to 48.6 from 48.7 in October. A further contraction in manufacturing could further solidify the Fed's plan for a December rate cut, thus suppressing the dollar and boosting gold. This week will see the release of several important data points, including ADP employment data, ISM Services PMI, jobless claims, and the core PCE price index. These will provide crucial guidance for market movements ahead of next week's Federal Reserve interest rate meeting.
Technical Analysis: Retreat from Highs, Focus on Key Support
Intraday Price Analysis: Gold prices rose rapidly from around $4205 in the morning, reaching a high of $4256, but retreated sharply in the afternoon, hitting a low of $4215. Currently, the strength of the support level at $4200 needs to be monitored. If it holds, the upward trend is likely to continue.
Key Levels
Resistance: $4255-$4260 (Intraday high area; a break above this level would open up further upside potential)
Support:
First Support: $4215 (Initial hourly support)
Key Support: $4173-$4180 (Daily chart strength/weakness dividing line; a break below this level could lead to consolidation)
Trading Strategy
Overall, gold maintains a strong daily chart pattern, but short-term risks of a pullback from these highs should be considered. The recommended strategy is to primarily buy on dips, with selling on rallies as a secondary approach. The key focus should be whether gold can hold above $4215 and stabilize in the afternoon.
Trading Strategy Reference
Short Position Strategy
Entry Area: Initiate short positions in batches around $4255-$4260.
Stop Loss: $8
Target Range: $4230-$4215, break below to $4200.
Long Position Strategy
Entry Area: Initiate long positions in batches around $4200-$4205.
Stop Loss: $8
Target Range: $4230-$4240, break above to $4260.
Risk Warning: Increased market volatility necessitates strict control of position size and stop-loss orders to avoid holding losing positions. Specific entry points should be adjusted flexibly based on real-time market movements.
Outlook
Gold has experienced a technical pullback after reaching a six-week high, but it remains supported by expectations of a Fed rate cut. The focus today is on the US ISM data; weak data could catalyze a new round of buying. Investors should closely monitor the battle between bulls and bears around the $4200 level and trade accordingly.

XAUUSD Bullish Continuation With Structure Support – Intraday ViGold continues to respect its rising structure after building higher lows. The recent pullback was absorbed inside the marked support region, and price is now pushing back toward the upper range.
The structure suggests strength as long as price holds above the lower support band.
Key Technical Areas:
Support / Hold Zone: 4,186 – 4,220 region
Reaction Area: 4,235 – 4,245
Resistance / Upper Range: 4,280 – 4,295
Technical Outlook:
As long as price remains above the support zone, bullish continuation remains possible toward the upper range. A clear hold above recent highs may open further upside potential, while a breakdown below support would invalidate the structure.
This is a technical analysis idea for educational and charting purposes only.
If you want, I can also give you:
✅ A shorter version
✅ A caption for social media
✅ A more professional/advanced version
✅ A matching hashtag set

XAUUSD Bullish Explosion! Target4285 🔥 Smart Money Concept Explanation
Market is currently maintaining bullish order flow with consistent HH–HL structure, showing strong demand from institutional footprints.
Price has tapped into an Internal Demand Mitigation (IDM) area and is reacting bullishly after engineering liquidity below intraday lows.
The previous Break of Structure (BOS) confirms the continuation of bullish displacement.
Now price is expected to reach the upper Buy-Side Liquidity (BSL) zones.
---
🎯 Targets (TP divided into 3 parts)
1️⃣ TP1 → 4260
• First buy-side liquidity pocket
• Ideal partial close point
2️⃣ TP2 → 4272
• Situated at the next imbalance fill zone
• Captures mid-range liquidity
3️⃣ TP3 → 4285 (Final Target)
• Major external buy-side liquidity
• Completion of overall bullish expansion
---
📌 Market Psychology / Why This Buy is Strong
Liquidity swept below 4245 area
Price tapped into imbalance + demand confluence
Institutional mitigation confirming bullish continuation
Strong bullish displacement candles
Clear buy-side liquidity sitting above 4260 → 4285
---
⚠ Risk Management
Always maintain SL at 4240, just below liquidity sweep zone.
Use partial profit-taking on each TP to protect capital.
---
#XAUUSD #Gold #Forex #SmartMoneyConcept #SMC #BuySetup #LiquidityZones #OrderFlow #BOS #IDM #TechnicalAnalysis #Trading #ForexSignals #IntradayTrading #Scalping #SwingTrading #MarketStructure #PriceAction


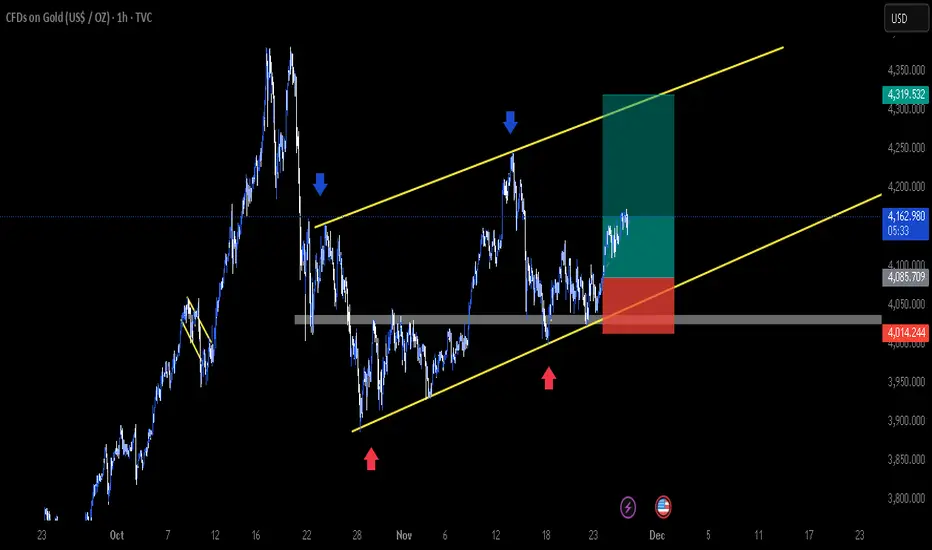
Opportunity Showed Up on GOLDAfter an arguably top-down analysis, finally Gold revealed its hands and gave us and entry opportunity. A good question, will it hit Take Profit? Let's wait and see.

XAUUSD: Will It Continue to Decline? We have been receiving long profit signals for a consecutive week, and I believe all of you have already gotten them. The market has once again validated my view by breaking through the 4200 level, allowing us to reap substantial profits.
Next week, gold is expected to enter a correction phase and may decline to test the support level around 4160-4180. If you still have short orders in your account, this will be your final chance to close them.
I will send out accurate trading signals as soon as the market opens next week—don’t miss out.

The 3 Trades That Got Me $100k Funded AccountWhen I trade XAUUSD, I only look for buying opportunities since the overall trend is bullish and there's a large list of fundamental support factors.
All of my trades always start off with a 1:1 risk to reward and then I trail based on the daily structure. Once a daily candle loses below the last, I exit the trade. Once the trade is in profit by 300 points on the smaller timeframes I move my stop loss to breakeven.
The first trade I want for a breakout above resistance. I was going to enter right on the breakout but I thought there was a chance of a fakeout so I waited until we had a small red doji candle. Stop loss was placed below that doji. I then held the trade until the daily candle closed below the last.
The second trade, I waited for a retest of the 10 SMA. The second trade felt risky but I only risk 1% per trade. Once price action started closing higher on the daily timeframe, I simply held it until we had that large bearish engulfing candle at the top.
The third trade was a no brainer, price closed above the 10SMA. My stop was below the daily candle's low and I targeted the 4200 psychological handle.

Gold Is Coiling for a Big Move — Triangle Breakout Incoming?Gold has formed a symmetrical triangle after a strong vertical rally.
Price is currently breaking out of the upper triangle boundary, which can signal continuation of the larger bullish trend.
Bullish Scenario (Confirmed breakout)
Upside Targets:
• 4320
• 4380 (major resistance)
• 4450 if momentum expands
Bearish Scenario (Failed breakout / breakdown)
Downside Targets:
• 4050
• 3950
• 3850 (major structural support)
Stop Loss
• Long: below 4160
• Short: above 4230
Gold Buy SetupHi All,
Just small analysis for Gold - Entered buy from here and SL _ TP on the chart.
Please do your analysis before entering trade on my analysis (This is only for educational purposes).
Happy Trading
Green Pips To All

Master the Market with This Secret StrategyHey traders! If you’ve ever watched XAUUSD suddenly explode up or crash down and wondered “What just happened?” — this is the answer. And that’s exactly why today’s topic matters.
To truly master gold, you need to understand one thing better than most traders do: how interest rates and the FED shape every major move on this chart.
When I first started trading, I relied heavily on patterns, indicators, and momentum signals. But the longer I traded, the more obvious it became: gold doesn’t make its biggest moves because of a pattern — it moves because the flow of money shifts. And nothing shifts money faster than the FED.
Interest rates are basically the “price of the dollar,” and gold reacts to that instantly:
High rates → strong USD → gold usually drops.
Lower rates or a dovish tone → weaker USD → gold rallies hard.
But here’s the part most traders never realize:
The FED doesn’t need to change rates to move gold.
Sometimes a single hawkish or dovish sentence is enough to push XAUUSD $20–$30 in minutes. That’s why understanding the tone of the FED — not just the numbers — is your real edge.
And this leads to the strategy I’ve used consistently with XAUUSD:
If the market expected hawkish but hears dovish → gold pumps.
If the market expected dovish but gets hawkish → gold drops fast.
That “expectation gap” is what gives us the clean moves we love trading.
On TradingView, I keep it simple:
I never enter on the first spike — that move is almost always engineered to grab liquidity. Instead, I wait 15–30 minutes for the real structure to form, watch for a break and retest, and then I follow the true direction. This approach has saved me from countless traps during FED weeks.
So when you’re analyzing XAUUSD, don’t just stare at the candles.
Look at the interest rate environment.
Listen to the FED’s tone.
Measure what the market expected versus what actually happened.
Master that connection — and suddenly the gold chart feels less chaotic and a lot more predictable.

GoldTrading Strategy | November 28-29✅ 4-Hour Chart (H4) Trend Analysis
1️⃣ Overall Structure: Bulls in Control, Price Breaks Key Resistance
Price has broken above and stabilized above the key resistance at 4156 (yellow line), forming consecutive bullish candles with strong volume, indicating clear bullish strength.
The latest bullish candle has a strong body and closed near its high, showing that upward momentum is still continuing.
2️⃣ Moving Averages: Bullish Alignment
MA5, MA10, and MA20 are in a classic bullish formation, and price is consistently advancing along MA5 and MA10.
MA20 is turning upward, which is a key signal of trend reversal.
➡️ This indicates that the medium-term trend has strengthened, with bulls dominating the market.
3️⃣ Bollinger Bands: Upper Band Opening, Trend Strengthening
Price is riding along the upper Bollinger Band — a typical sign of a strong bullish trend.
The upper band is expanding upward, indicating rising volatility and expanding upside potential.
✅ 1-Hour Chart (H1) Trend Analysis
1️⃣ Trend Structure: Strong Rally, Short-Term Pullback Expected
H1 recently surged to 4226.89 and then pulled back slightly, showing a normal correction after a strong rally.
Price remains above MA5 and MA10, indicating a strong pullback rather than a trend reversal.
2️⃣ Moving Averages: Short-Term Still Bullish
MA5 and MA10 remain in a bullish formation.
MA20 is starting to provide support, making it the key level for short-term pullbacks.
➡️ Short-term bias remains bullish, but a technical correction may occur at any time.
3️⃣ Bollinger Bands: Upper Band Pressure
The H1 upper Bollinger Band is around 4222, and price saw reduced volume after touching it, suggesting short-term profit-taking.
🔴 Resistance Levels: 4226 / 4230
🟢 Support Levels: 4195 / 4182
✅ Trading Strategy Reference
1️⃣ Buy on Pullback (Main Strategy)
Buy in the 4182–4195 range
🎯 Targets: 4218 / 4230
⛔ Stop Loss: 4170
Reason:
H4 has clearly broken above 4156, confirming a medium-term bullish trend. A pullback is a buying opportunity.
2️⃣ Short at High Levels (Secondary Strategy, Light Positions)
Short near 4226–4230 if price shows rejection
🎯 Targets: 4205 / 4195
⛔ Stop Loss: Above 4238
Reason:
H1 faces pressure at the upper Bollinger Band, showing short-term exhaustion and potential for a pullback.

Gold Trade Set Up Nov 28 2025Price created a new HH on the 1h in Asia session then reversed in London to test 1h demand and bounced off it. Overall i am still bullish. internally price swept low range liquidity so i will want to see 5m-15m engulfing candle to continue higher to BSL
